LANDSCAPE AND SPRAWL.
DIACHRONIC QUANTITATIVE ASSESSMENT1
Domenico Enrico Massimo Mariangela Musolino Alessandro Malerba Geomatic Valuation University Laboratory (GeVaUL) PAU Department, Mediterranean University of Reggio Calabria, Italy
Abstract. Relevant Landscape phenomenon is the focus of the present research i. e. the urban
sprawl dating from 1870 to the present date, its quantitative estimation, and its correlation (or not) to demographic growth.
Until the mid-1900s European consolidated historic settlements had been traditionally char-acterized by urban compactness. Subsequently, the European (as well as worldwide) urban system has been affected by the phenomenon of urban sprawl, some negative impacts of which are: the dissemination of low-density new constructions in natural Landscape; the huge land consumption; the urbanization and sealing of land previously devoted to agriculture; the use of private cars for commuting; the huge increase in energy consumption for mobility.
Keywords: Urban Sprawl; Estimation of Sprawl; Gis; WebGis; Valuation; Demographic
dy-namics.
1. Object of the research
This research deals with the contemporary urban system and with the urban sprawl phenomenon.
It examines some of the possible policy responses to worldwide city over-expansion, addressed by international organizations to wrestling sprawl to the ground, i. e.:
‐ information system;
‐ quantitative assessment overtime of over-expansion; ‐ strategy design;
‐ urban revitalization and economic revamping of already existing settlements; ‐ a better organization of public transport system crossing already existing and
new settlements, and serving directly their inhabitants.
Research, supported by key GIS and WebGis tools, investigates the eventual re-lationship of urban expansion with:
1
Attributions: Massimo D.E. authored § 1, 4, 6, 7, 10; Musolino M. authored § 2, 3,
‐ demographic dynamics; ‐ territorial economy.
Research is focused on a Case Study in Calabria, the Southmost region of conti-nental Italy.
Alternative future scenarios in the real world have been designed for the entire region chosen, considering population, Gross Domestic Product (GDP), infra-structures, and transport system. Key role has been played by GeoDataBase of all settlements that research has built-up.
Then research performs: sprawl measurements; economic analysis; valuations of ratios between .
The first results of this meta-analysis show that urban revitalization strategy (in-tegrated green infrastructure and transportation system) can help to treasure the existing settlements and thus:
‐ reduce sprawl trend;
‐ mitigate frantic hyper-mobility produced by sprawl itself; ‐ improve territorial accessibility and their regional economy; ‐ reduce energy consumption and CO2 emissions.
2. Research general framework
The experimental research here presented deals with the complexity of European (as well as worldwide) urban system and namely with urban sprawl phenome-non, aiming to find-out and propose mitigation measures as policy responses to it. Sprawl, i. e. the relevant phenomenon afflicting world settlements in the last half century, is conventionally defined as «the physical pattern of low density of large urban areas, under market conditions, mainly in the surrounding of agricul-tural areas as well as open land».
The inter-disciplinary analysis of this world-wide and impressive phenomenon has produced studies, researches and policy opinions deeply different, diversi-fied and sometimes divergent.
A common ancillary and propaedeutic position to face urban sprawl phenome-non seems to be shared by all scientific community and ideological opinions: the categorical imperative to start-up, without any hesitation, a general system of assessment, estimation and valuation (SGV) to understand the size of urban sprawl and therefore design possible solution to mitigate its negative impacts. This should be done not only in sparse and fragmentary discontinued areas with a poise sampling and erratic Case Studies, but within a general framework by starting-up a diachronic observatory activity characterized by: objective scien-tific basis of analysis; impartiality; a wide time span of observation; total (no partial) covering of observed territories.
Then, synchronic and systematic observations including vast, entire and contin-uous geographic areas should be performed.
3. Research structure
Research here presented is focused on main interconnected sub-objectives. First. Meta-analysis at geographic level
Research conducts a meta-analysis at geographic scale of the relevant relation-ship between “urban sprawl” and “economic growth” by examining and indi-rectly investigating at that scale some of the institutional interpretations marking urban sprawl as a critical case of market failure. These interpretations are devel-oped by research centers connected to Institutions such as Governments of Eu-ropean Union and the United States of America, running sub-continental territo-ries where a significant part of the world economy as well as sprawl phenome-non are concentrated.
Second. Analysis at territorial level
Given the complex issue under investigation, present research has started-up a first parallel and synopsis between meta-analysis at geographic scale and a Case Study at territorial level, by directly investigating at local scale the relationship of urban over-expansions with: - underlain demographic dynamics; - trend of territorial economy.
4. Geographic and territorial scales
Meta-analysis outlines the positive or negative (more likely) impacts of urban sprawl. In the latter case of negative effects, Institutions and Governments, at different geographic levels, may suppose interventions of policy responses to mitigate sprawl either on negative impacts (of neutralization) or on causal ele-ments (solution).
The meta-analysis conducted in the four continents identifies in some driving forces the causes of the worldwide phenomenon of the sprawl. Some of them are: economic growth; demographic boom; re-localization of complex activities in semi-urban areas; housing shortage in central urban areas; high index of crowding, i. e. population filled in small areas.
Researchers agree to identify and assess the following negative effects: envi-ronmental, in terms of land, water and air consumption, and also acoustic pollu-tion; social, in terms of dramatic increase of individual commuting by private car and time people spend for it; high human costs of commuting: psychologi-cal, health, familiar.
In the last decades strong policy responses have been addressed, in particular in Europe, to mitigate sprawl. Among them there are:
central areas;
‐ containment, i. e. re-urbanization of suburban areas by enhancing street con-nectivity and reducing the enormous dimension of urban blocks;
‐ new urbanism, i. e. construction of new compact and dense settlements char-acterized by “street intensity” and a mix of various urban functions and only if served by heavy urban rail system;
‐ heavy urban and interurban rail system, i. e. collective sustainable infrastruc-ture on rail.
Present research has started-up in the Case Study area, Calabria region, a deep investigation, supported by key GIS and WebGis tools, about the eventual caus-al relationship of urban expansions with: - demographic dynamics; - territoricaus-al economy; - degree of accessibility and mobility.
In particular, the objectives pursued by the research are: documentary-geographic; analytical-economic i. e. explanatory-hermeneutic.
5. Documentary geographic objective
The documentary-geographic objective of Case Study research is to disaggre-gate and deepen the a poise (partial) sample researches performed at continental level by institutions, centers, pools and investigation groups of European Union, USA, PRC and other countries of developed economies.
Case Study takes up the challenge of: higher details of geographic scale; com-prehensiveness of examination; total covering of territories; much wider time span of urban history. In fact, research performs systematic investigations (not sampling ; not partial), on settlements (of Case Study area) by considering all the inhabited places at un-precedent detailed scales. Afterwards, the square me-ters are calculated for each inhabited settlement, even the smallest one, by taking a picture of the urban dynamics at different dates: 1870; 1954; 2001; 2009.
6. Analytical-economic objective
The analytical-economic sub-objective i.e. the explanatory-hermeneutic part of the Case Study research examines if a causal relationship exists, first of all be-tween topographic urban enlargement dynamics of each settlement bebe-tween 1870 and 2009, and their population increase; and then with present level of in-come i. e. GDP ranking. All this, to verify the existence or not of a demographic motivation or an economic-productive explanation for the recorded impressive urban over-expansions.
Territorial Economy
Research has then compared the results concerning sprawl measurement, popu-lation dynamics and economic growth with other Italian regions as Trentino,
Valle d’Aosta, Friuli and Tuscany, so called “Italia intermedia” [i. e. “Interme-diate Italy”] for their medium size in terms of population, economy, production, inter-sectoral mix, way of life.
Sprawl in the Case Study area has distinctive characteristics. Its causes seem to be different to those identified at geographic international scale. In fact, the driv-ing forces are not confirmed . In the Case Study area, sprawl is not connected to the level of income i. e. GDP ranking singled out as the causes in other contexts at geographic scale, as it is described in the following paragraphs.
Local policy responses
Further objective concerns the possibility to address policy response to the ana-lyzed phenomenon. A possible goal might be to start-up a valuation framework based on geographic meta-analysis to verify if transportation policy is a possible local response to sprawl in terms of popular consensus and Institutional approv-al.
7. Case study
Research has designed and built-up a geographic information system of the his-toric settlements of the entire Calabria region in ArcGIS structured in both car-tography and demography, within the framework of a more general valuation system (SGV). This has been done in order to verify the existence and consist-ence of urban sprawl, to perform objective measurements and to derive herme-neutics of the possible causal relationship.
Local research has begun with the Case Study concerning all the settlements of one of Calabria’s five provinces. The overall settlement expansion at provincial level is expressed in square meters and derived from the analytical summing-up of the expansion of each urban settlement.
Each of this is compared to its demographic dynamics as well as to its provincial income in order to understand whether the exponential open land and farmland consumption in the central area, is motivated by a proportional increase of popu-lation, or anticipated and caused by a growth of production and income at pro-vincial level.
Documentary-Geographic Sub-Objectives and Outcomes
The original main element of the entire research strategy is the cartographic measurement of the diachronic insediative perimeters (original and sub-sequent). References have been made to spatial “scientific” representations, maps giving total coverage. These have greater details compared to the tradi-tional seventeenth century “chorographic” maps. In fact, Case Study research adopted and used the “modern” topographic maps at scale 1:50.000, 1:25.000, up to 1:10.000. These are of course much more detailed than the traditional less detailed “chorographic” historical representation at scales around
1:200.000-1:400.000. In between “chorographies” (XVII century) and “topographies” (XIX-XX century) there is the extraordinary Map the Kingdom of Two Sicily, in 1788 (XVIII century), scale 1:88.000. It is the most advanced “scientific” map in the world at that age. The perimeterization stage of the historic settlements has been focused on three main dates: 1870 (Unification of Italy); 1954 (post-war); 2001 (present). Each of the 694 settlements in the region Calabria (previ-ously censused and localized in GIS environment) has been perimetered (or sin-gled out) , on the cited systematic and total coverage maps, at the three different dates and the square meters of their extension of the built-up areas have been calculated.
Analytical-Economic Sub-Objectives and Outcomes
Once the documentary-geographic research was set-up, the interpretation and the hermeneutics of the urban sprawl phenomenon has begun in the specific Case Study. The crucial point (in terms of management of the territory and gov-ernment of the settlements) is to analyze the relationship between built-up square meters per inhabitant. This represents a great result of the research. It makes assessment possible, at least a first approximation, of a demographic mo-tivation of the urban over-expansion analyzed and reported in the first result. The same result is represented in cartography (see figures). The integrated anal-ysis performed looks towards future urban development.
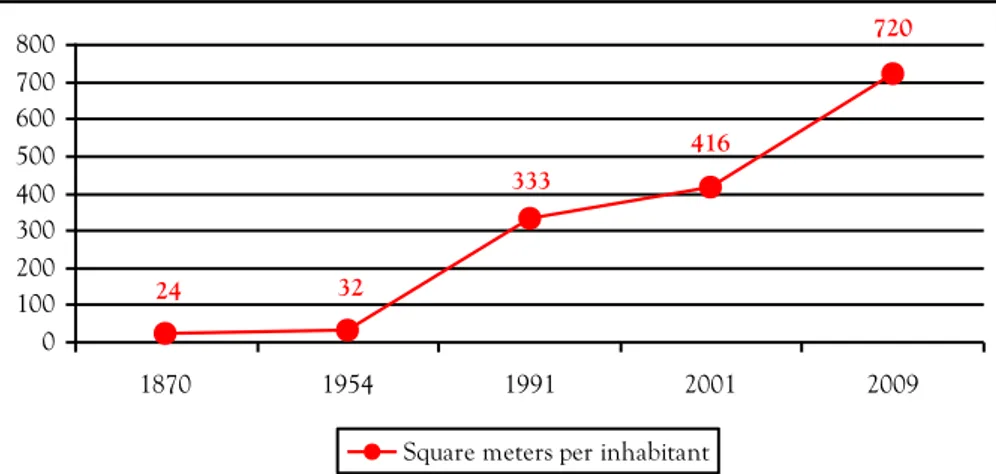
A preliminary ratio between built-up land and amount of future forecasted set-tled population can be established. In fact, it is useful to assess in advance the demographic reasonableness, or not, of possible further urban expansion envis-aged by urban planning. In particular, research has investigated sprawl and de-mography and their relationship with economic growth at territorial level by im-plementing a Case Study in the entire region of Calabria, focusing specifically on the central isthmian area (the narrowest part of Italy: 40 km) where the sec-ond (Catanzaro) and third (Lamezia Terme) towns of the region are located. The result of the comparison between built-up square meters and related inhab-itants (m2 \ inhabitants) is impressive for the entire Calabria region. In the spe-cific Case Study concerning the province of Catanzaro, this ratio goes from 24 m2\inhabitants in 1870, to 32 m2\inhabitants in 1954, to 333 m2\inhabitants in 1991, to 416 m2\inhabitants in 2001.
Furthermore, a ratio of around 720 m2\inhabitants is forecasted and granted in local urban planning tools. The latter is alarming because demographic projec-tions do not support hypothesis of significant regional population growth, and to the diminishing population corresponds the prevision of a urban over-expansion. All this is worsened by the spread (= sprawl) of building construction allowed in agricultural, arable, forestry and open land by urban planning tools.
Table 1.
Province of Catanzaro. Valuation of urban evolution. Diachronic analysis 1870-2009:
built-up land; population; ratio m2\inhabitant.
The overconsumption of land for each resident
Year Built-up Land
Urban Population m2\ Inhabitant m2 inhabitants 1870 (a) 4.523.578 (b) 191.648 23,60 1954 (a) 8.903.840 (b) 274.286 32,46 1991 (a) 120.448.495 (b) 360.895 333,74 2001 (a) 144.519.312 (b) 347.302 416,12 Prg 2009 (c) 250.000.000 (d) 340.000 719,84
Source: (a) work-out of the authors on the basis of official historic cartography at 1870, 1954, 1991, 2001; (b) Istat; (c) urban plans; (d) Town Halls
The transformation of the table in the diagrams with a logarithmic (y) axes makes evident the absence of demographic motivation for the urban and build-ing over-expansion.
Graph 1. Province of Catanzaro. Diachronic analysis 1870-2009. Trends: population
(blue triangles); built-up land (red squares) [(y) axis, logarithmic]
Source: work-out of the authors on the basis of official historic cartography at 1870, 1954, 1991, 2001; Istat; urban plans; Town Halls
340.000 347.302 360.895 274.286 191.648 250.000.000 4.523.578 8.903.840 120.448.495 144.519.312 100.000 1.000.000 10.000.000 100.000.000 1.000.000.000 1870 1954 1991 2001 2009
Inhabitants Square meters of built-up land
in in in in in m2 m2 m2 m 2 m2
Graph 2. Province of Catanzaro. Valuation of urban evolution. Diachronic analysis
1870-2009. Trend: square meters per inhabitant
Source: work-out of the authors on the basis of: official historic cartography at 1870, 1954, 1991, 2001; Istat data; urban plans data from the Town Halls
Figure 1. Urban sprawl assessment. Original settlements at 1870 (red) and 1954 (orange)
within the sprawl of today expansion at 2001 (grey). Province of Catanzaro (Calabria)
720 416 32 333 24 0 100 200 300 400 500 600 700 800 1870 1954 1991 2001 2009
309
8. Key role of geomatic valuation
Powerful GIS tools makes it possible the computer science support for key anal-yses: - land use dynamics for an entire region; - relationship between settlements and farm land from 1783 to 2010; - per capita m2 of urbanized land for each in-habitants; - transport alternative designs. The built-up GeoDataBase has there-fore made it possible to store and connect in a comprehensive framework many information layers, such as: - georeferenced historical cartographies from 1783-1870 to present date; - boundaries of each settlement at different dates; - calcula-tion in m2 of total land consumption over time (1870-2010) on scientific carto-graphic basis; - democarto-graphic data reconstructing population dynamics for each settlement in the last two centuries; - economic data; - information about mobili-ty; - design of alternative scenarios of intervention to wrestling sprawl to the ground.
9. Ratio between soil and built up area
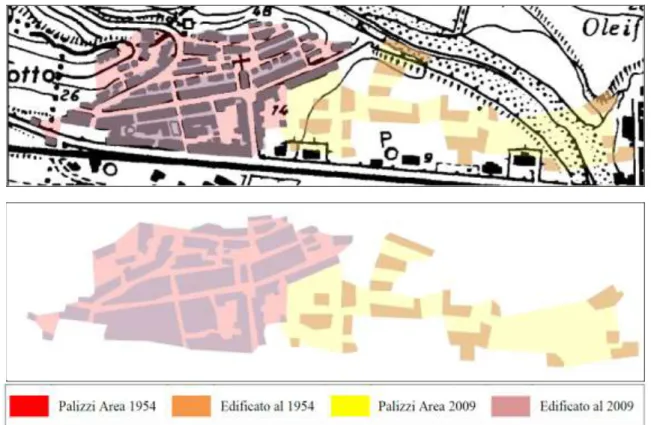
Research started the estimation, on objective basis, of the ratio: m2 of soil con-sumed for each m2 of built up area. This ratio is named: Indice di Copertura, IdC. This is to document (or not) the degree of dispersion of new sprawl post 1954, and to compare 1954 IdC to 2011 Idc.
Figure 2. Palizzi Marina. BaseMap: 1954\2009. Historic settlement and new sprawl. 1:5.000
Table 2.
Palizzi Marina. 1954 IdC vs 2009 IdC Total Area mq Built up Area mq Ratio: Built up \ Total D % Total \ Built up mq 1954 35.059 21.316 + 61 1,4 2009 24.985 7.633 + 31 3,3
Case Study provides the following relevant results. In 1954 IdC is 1,4. In 2009 IdC is 3,3. These data confirm that contemporary sprawl is soil consuming .
10. First considerations
Research focused on a global, European, national and local element of settle-ment, namely the urban sprawl or low density way of disperse development causing a huge waste of open, arable, agricultural and forest land.
Innovation in research in this Case Study is the total analysis of land in the stud-ied area. In fact, all settlement dynamic from XVIII century (1783-1788) to date have been analyzed and spatially measured from 1870 to 2011.
The urban over expansion in the period is impressive going from following ratio between per capita urbanized m2 and inhabitants:
‐ 24 m2 \ inhabitant in 1870; ‐ 32 m2 \ inhabitant in 1954; ‐ 332 m2 \ inhabitant in 1991; ‐ 416 m2 \ inhabitant in 2001;
‐ 720 m2 \ inhabitant in urban plans of towns and villages (2009).
Results are alarming and call for more analysis and assessment and especially for policy initiative to wrestle sprawl to the ground through:
‐ treasuring existing settlements; ‐ revitalizing historic centers;
‐ re-connecting green infrastructure, (especially heavy railroad) with and dense development;
‐ regenerating building in terms of energy efficiency and consequent indoor better quality of life;
‐ stop implementation of urban plans of towns and villages (legalized sprawl); ‐ stop further development and sprawl.
Summary
Research assesses urban development i. e. sprawl in its quantitative dimension.
Urban sprawl surrounding small historic centers, medium-sized towns and big cities, has ex-asperated and exacerbated:
‐ building dispersion resulting in a boom of the demand for private cars; ‐ exponential development of pipelines and related management costs;
‐ duplication of roads serving almost exclusively individual locations and journeys; ‐ overall pollutant emissions increase;
‐ reduction of landscape and natural buffers useful to absorb and capture carbon dioxide. The first step in a new strategy for urban sprawl mitigation is the quantitative diachronic es-timation of Landscape and soil consumption and destruction, not just in some small sample areas but in the all spaces (municipality; district; province; region) under investigation.
Analysis of urban sprawl, in a given area, will take into account the following factors: ‐ urban development dynamics;
‐ demographic trends; ‐ economic history.
The above methodology is implemented performing a direct analysis of all settlements from 1870 to 2009 giving special attention to:
‐ size (in square meters) and dimensions of each center; ‐ dynamic of its population, in the same years.
A specific Case Study, concerning a province in Calabria, the Southernmost region in Italy, is proposed and presented, examining the correlation (or not) between soil consumption and demographic dynamics.
Sprawl analysis, from 1870 to 2009 (with additional direct checking on aerial photos and on 2011 census), was performed in the whole Province of Catanzaro, in Calabria, the southern-most region of continental Italy.
No evidence has been found concerning the correlation between construction \ settlement de-velopment and population growth.
A detailed spatial and demographic analysis, at a provincial scale, seems to confirm the Euro-pean Union research conclusions i.e. that EuroEuro-pean urban sprawl is the result of market failure and not the consequence of demographic pressure or of the housing demand. For this reason <Policies at all levels including local, national and European need to have an urban dimen-sion, to tackle urban sprawl and to redress the market failure>.
Finally, the urban sprawl is unjustified from demographic and ecological points of view.
Selected Bibliography Initial Studies Concerning Sprawl
1. Clawson, M. (1971). Suburban Land Conversion. Washington. Mimeo. 2. Clawson, M. (1973). Planning and Urban Growth. Washington. Mimeo.
Sprawl
3. European Environment Agency (2006). Urban Sprawl in Europe. The Ignored
Chal-lenge. Office for Official Publications of the European Communities, Luxembourg. ISSN
1725-9177.
4. Galster, G.; & Hanson, R.; & Ratcliffe, M.; & Coleman, S.; & Freihage, J. (2001).
Wrestling Sprawl to the Ground. SGA, Washington D.C., Usa. Mimeo.
5. Kim, A.M. (2002). Urban Land Market Development in Transition Economies. Depart-ment of Urban Studies and Planning, Massachusetts Institute of Technology, Cambridge, Ma, Usa. Mimeo.
6. Emiliani, V. (2007). Il consumo di suolo in Italia. Roma. Mimeo.
7. Massimo, D.E. (2008). Appunti su Trasporti ed Estimo. Caso di Studio in Calabria. Cor-so a scelta <Valutazione della Sostenibilità Architettonica Urbana Ambientale>. Univer-sità degli Studi Mediterranea, Laboratorio GeVaUL “PauGis”. Reggio Calabria. Mimeo.
8. Massimo, D.E.; & Musolino, M.; & Barbalace, A.; & Fragomeni, C.; & Guidara, M.; & Malerba, A.; & Marzo Micale, A.; & Massimo, A.P.P.; & Mercuri, A.E.S.; & Vescio, M. (2009). GIS dello sprawl urbanistico. Recenti innovazioni nelle stime quantitative. Atti della Dodicesima Conferenza Nazionale Utenti ESRI. GIS in action. Roma, 27-28.05.2009. ESRI Italia, Roma. CD-Rom.
9. Massimo, D.E.; & Barbalace, A. (2009). Urban sprawl e crescita territoriale. La sfida del-la scadel-la in una stima a livello sub-regionale in Cadel-labria. Atti deldel-la XXX Conferenza Ita-liana di Scienze Regionali. Federalismo, integrazione europea e crescita regionale. AI-SRe, Milano. CD-Rom.
10. Massimo, D.E. (2009). Valutazione dell’urban sprawl e strumenti GIS. In: Asita.
Federa-zione delle Associazioni Scientifiche per Informazioni Territoriali e Ambientali. Vol. 13.
Asita, Milano.
11. Saum, C. (2008). Beijing and Shanghai: Places of Change and Contradiction. Land Lines. Vol 20, n. 4: pp. 2-7. Lincoln Institute of Land Policy, Cambridge, Ma, Usa.
12. Young, D. (1995). Alternatives to Sprawl. Lincoln Institute of Land Policy, Cambridge, Ma, Usa. ISBN 1-55844-128-X.
Local Economy
13. Unioncamere (2006). Pil 2005 delle province italiane. Roma. Mimeo.
14. Unioncamere (2006). Il prodotto lordo delle economie provinciali negli anni 2003-2005. Roma. Mimeo (28.12.2006).
15. Istat (2003). Conti economici territoriali: stima anticipata della dinamica di alcuni
ag-gregati economici nelle grandi ripartizioni geografiche. Roma. Mimeo.
Domenico Enrico Massimo
Geomatic Valuation University Laboratory (GeVaUL), PAU Department, Mediterranean Uni-versity of Reggio Calabria, Italy
E-mail: [email protected]
Alessandro Malerba Geomatic Valuation University Laboratory
(GeVaUL), PAU Department, Mediterranean Uni-versity of Reggio Calabria, Italy
Mariangela Musolino Geomatic Valuation University Laboratory
(GeVaUL), PAU Department, Mediterranean Uni-versity of Reggio Calabria, Italy