Note: This article will be published in a forthcoming issue of
the Journal of Aging and Physical Activity. This article appears
here in its accepted, peer-reviewed form; it has not been copy
edited, proofed, or formatted by the publisher.
Section: Original Research
Article Title: Effects of Patterns of Walking Training on Metabolic Health of Untrained
Postmenopausal Women
Authors: Andrea Di Blasio1, Pascal Izzicupo1, Emanuele D’Angelo2, Sandra Melanzi1, Ines Bucci1, Sabina Gallina2, Angela Di Baldassarre1 and Giorgio Napolitano1
Affiliations: 1Department of Medicine and Aging Sciences, ‘G. D’Annunzio’ University of Chieti–Pescara, Italy. 2Department of Neuroscience and Imaging, ‘G. D’Annunzio’ University of Chieti–Pescara, Italy.
Running Head: Insulin Resistance and Walking Training Journal: Journal of Aging and Physical Activity
Acceptance Date: September 16, 2013
Effects of Patterns of Walking Training on Metabolic Health of Untrained Postmenopausal Women
Andrea Di Blasio1,*, Pascal Izzicupo1, Emanuele D’Angelo2, Sandra Melanzi1, Ines Bucci1, Sabina Gallina2, Angela Di Baldassarre1 and Giorgio Napolitano1
1
Department of Medicine and Aging Sciences, ‘G. D’Annunzio’ University of Chieti–Pescara, Italy
2
Department of Neuroscience and Imaging, ‘G. D’Annunzio’ University of Chieti–Pescara, Italy
Abstract
Purpose: High-intensity aerobic interval training (AIT) has been reported to be more effective
than continuous aerobic training (CoAT) to improve metabolic health. The aim of our study was to investigate whether moderate-intensity AIT is more effective than CoAT on metabolic health, when applied to a walking training program. Design/Methods: Thirty-two postmenopausal women (55.37 ±3.46 years) were investigated for body composition, plasma glucose, insulin, lipids, adiponectin, HOMA-IR, HOMA-AD, aerobic fitness, dietary habits and spontaneus physical activity, and randomly assigned to one of two different walking training programs: CoAT or AIT. Results: CoAT and AIT elicited the same physiological benefits, including: reduction of plasma glucose, insulin, HOMA-IR and HOMA-AD, and increase of plasma HDL-C, adiponectin and aerobic fitness. Conclusions: An AIT scheme as part of an outdoor walking training program elicits the same physiological adaptations as a CoAT scheme, probably because walking does not promote exercise intensities that elicit greater effects.
Key words: HOMA-IR, HOMA-AD, adiponectin, continuous aerobic training, aerobic interval
Introduction
Menopause is frequently associated with weight gain and a shift in body-fat accumulation from the hips and the thighs to the trunk. This is promoted by estrogen deficiency accompanied by a reduction in spontaneous physical activity, which is typical of ageing. This android obesity can contribute to a reduction in insulin sensitivity and development of dyslipidemia, insulin-resistance, and type 2 diabetes. These are important risk factors for cardiovascular disease (CVD), which represents the major cause of death among postmenopausal women (Zhang, Rexrode, van Dam, Li, and Hu, 2008). Increased body fat is also associated with modifications to adipocyte hormonal secretion, which can result in reduced production of adiponectin, one of the several adipokines that are produced by adipocytes (Arita et al., 1999). A reduction in
adiponectin secretion is important because of its significant role in the onset of metabolic disorders, such as type 2 diabetes and metabolic syndrome; indeed, adiponectin has insulin sensitizing, anti-inflammatory, and anti-atherogenic properties (Villareal-Molina &
Antuna-Puente, 2012). Due to the relationships between insulin and adiponectin, a new index has been
suggested as a predictor of insulin resistance: the homeostatic model assessment (HOMA) corrected for adiponectin (HOMA-AD) (Matsuhisa et al., 2007), which has been shown to be a more sensitive predictor of insulin resistance in subjects with normal and impaired glucose tolerance, and in diabetic subjects with moderate hyperglycemia (Matsuhisa et al., 2007).
In the literature, there are reports on the important role of physical activity and healthy eating in the prevention and treatment of insulin resistance and android obesity, and in the reduction of plasma adiponectin levels. Indeed, a role for aerobic training in the reduction of insulin resistance is well established (Pedersen & Saltin, 2006), as also for increased plasma adiponectin levels (Bouassida et al., 2010). Aerobic training can be performed in different
modalities: in a continuous manner, or in an alternating manner, where bouts of physical exercise at higher intensities are alternated with bouts of physical exercise at lower intensities. New scientific evidence suggests that high-intensity aerobic interval training (AIT) has a greater efficacy for increases in aerobic fitness and insulin sensitivity, and for reduction of risk factors for metabolic syndrome, with respect to continuous aerobic training (CoAT) (Tjønna et al., 2008). However, no scientific evidence has yet been reported to support the same effects for plasma adiponectin.
Although high-intensity AIT shows greater efficacy for the improvement of cardio-metabolic parameters, it can be unsafe, particularly in unhealthy and elderly people, for whom walking training must be recommended in any aerobic physical exercise program. Therefore, as
walking outdoors on the flat does not allow the exercise to reach high-intensity effort, it appears unlikely to expect the same amplitude of benefits of high-intensity AIT in a walking program. However, interval organization of walking training might be a valid method to interrupt the monotony of a continuous walk and to increase the adherence to physical exercise of those people who consider continuous walking through a whole exercise period to be boring. The study of the effects of different walking training patterns on health is useful because it promotes the health benefits of movement according to the psychological (e.g., individual preferences) and physio-pathological characteristics of everyone. Movement to promote health is of great importance, especially during the climacteric period, which, as indicated, is linked with increased cardiometabolic risk that can lead to reduced quality of life from menopause to old age. As a consequence, to prevent and to treat the decline of both physical performance and health, it is important that exercise specialists have as many choices as possible to effectively adapt physical exercise to the relevant situations.
Thus, the aim of our study was to compare a moderate-intensity AIT walking program and a CoAT walking program in untrained post-menopausal women, with regard to insulin resistance and plasma levels of lipids and adiponectin, while controlling for the effects of anthropometry and behavioral variables and matching the training to the mean exercise intensity.
Methods Participants
Fifty-five post-menopausal women (mean age, 57.09 ±4.24 years) responded to a public advertisment placed in the offices of several general physicians in the Pescara area (Italy). A telephone interview verified whether the women met the inclusion criteria of: age <65 years; no estrogen replacement therapy; no history of pulmonary, myocardial or orthopedic diseases that would limit walking; and no participation in any controlled diet and regular exercise program. The women were considered post-menopausal if their menses had naturally ceased for at least 12 months, and if they had plasma estradiol <20 pg/ml. Thirty-two of these women (mean age, 55.37 ±3.46 years) were considered eligible for the study.
The Ethics Committee of the ‘G. D’Annunzio’ University of Chieti–Pescara approved this study, and all of the participants gave their written informed consent.
Medical examinations and measurements were performed at the Centre of Sports Medicine of the ‘G. D’Annunzio’ University of Chieti–Pescara. The laboratory conditions were controlled for temperature (21-23 °C) and humidity (50%) (ACSM, 2005). The participants presented after overnight fasting, without having performed maximal muscle exertion the day before. The participants also abstained from alcohol consumption from 48 h before the tests and were standardized for fluid intake during the same period. Before starting the physical exercise training, they underwent medical history data collection, physical examination, blood sampling,
anthropometry, maximal stress tests, and dietary habits interviews. At the end of the basal measurements (T0), the participants were randomly assigned to one of two different walking training programs, which were equalized for mean intensity and volume. After the tests, and before the beginning of the physical exercise program, the daily physical activity of the participants was recorded over seven consecutive days under free-living context. The same tests were repeated after 14 weeks of aerobic exercise training (T1).
Blood sampling
After an 8-h overnight fast, venous blood samples were collected to measure total serum estradiol, glucose, insulin, adiponectin, total cholesterol, high-density (HDL-C) and low-density (LDL-C) lipoprotein cholesterol, and triglycerides. Glucose, HDL-C and triglycerides were assessed by enzymatic methods, LDL-C was calculated according to the Friedewald equation (Friedewald, Levy, and Fredrickson, 1972), and enzyme-linked immunosorbent assays were used to measure plasma estradiol, adiponectin and insulin (DRG Instruments GmbH, Marburg, Germany). The homeostatic model assessment for insulin resistance (HOMA-IR) was calculated as: (fasting insulin [µU/l] × fasting glucose [mg/dl]) / 405 (Matthews et al., 1985). The HOMA-IR corrected for adiponectin (HOMA-AD) was calculated as: (fasting insulin [µU/l] × fasting glucose [mg/dl])/ adiponectin [µg/ml] (Matsuhisa et al., 2007).
Anthropometry and body composition
A first level anthropometrist of the International Society for the Advancement of Kinanthropometry carried out the body measurements of the participants while they were still under fasting conditions. Body weight and stretched stature were measured to the nearest 0.1 kg and 0.1 cm, respectively, with the subjects dressed in light clothing and without shoes (Marfell-Jones, Olds, Stewart, and Carter, 2006), using a stadiometer with a balance-beam scale (Seca
220, Seca, Hamburg, Germany). Their body mass indices were calculated according to the formula of body weight/ stature2 [kg/m2]. Anthropometric tape (Seca 200, Seca) was used to measure their waist circumference that was measured as the smallest circumference between the rib cage and the iliac crest, at the end of normal expiration (Marfell-Jones et al., 2006). The body composition was assessed using an electrical bioimpedance technique, on a foot-to-foot, 50-kHz frequency, bioelectrical impedance scale (BC-420MA, Tanita, Tokyo, Japan). The impedance measurement error margin of the body composition analyzer was ±2%, which corresponded to about ±0.5% change in the body fat measurement of a person with a regular figure. The test was performed 3 h after getting up and immediately after voiding, with the participants in an upright position, barefoot and without conducting garments (ACSM, 2005).
Aerobic fitness assessment and cardiovascular eligibility for walking training
A resting 12-lead electrocardiogram (P8000, Esaote, Genoa, Italy) was performed after 10 min of supine rest. As most of the participants had never used a treadmill before, a graded maximal exercise test on a cycle ergometer (SANA BIKE 150 F, Ergosana GmbH, Bitz, Germany) was used to assess the aerobic fitness (METspeak) and eligibility of the participants for aerobic training. A medical doctor specialized in sports medicine supervised and conducted the stress tests. The participants were tested under continuous electrocardiogram monitoring (AT-10 plus, SCHILLER, Baar, Switzerland) coupled with blood pressure measurements at the end of each step of the graded maximal exercise test. The Astrand protocol was used to test the fitness of the participants, to the point at which there occurred absolute or relative indications for termination of a clinical graded exercise test, according to the American College of Cardiology/ American Heart Association guidelines (ACSM, 2005).
Dietary habits assessment
A dietician estimated the participant dietary habits and energy intake from 7-day dietary records, using the WinFood 2.7 software (Medimatica, Colonnella, Italy). This provided qualitative (macro and micronutrient composition of daily meals of up to 70 components) and quantitative (kcal, g) information about the meals of the participants. The food portions were recorded as they were consumed, by self-measurement using a scale or household measures (cup, tablespoon), and they were recorded on an open-ended form that included a section that clarified how to draw up the dietary record. At the end of the recording period, the dietician reviewed the records with each participant to clarify the entries, to probe for forgotten foods, and to collect further details of the preparation of the foods. The mean value of each investigated dietary parameter was used for statistical analysis.
Daily physical activity measurements
Daily physical activity was measured under free-living conditions over 7 consecutive days using SenseWear Pro2 armbands (BodyMedia, Pittsburgh, USA), which integrate the information gathered by two axis accelerometers and sensors (i.e., skin and near-body temperature, heat flux, galvanic skin response) with the sex, age, stature, weight, smoking status, and handedness of the user, to provide qualitative (intensity) and quantitative (number of daily steps, energy expenditure) information about the daily physical activity of the user. From the recorded data, we focused our attention on the mean intensity of daily physical activity (METsm/die), daily steps (STEPSm/die), time spent on physical activity with an intensity ≥3 METs and ≤6 METs (i.e., moderate-intensity physical activity; MIPATm/die) and with an intensity >6 METs (i.e. vigorous-intensity physical activity; VIPATm/die). The energy expenditure from MIPATm/die and from VIPATm/die were also calculated and considered. In addition, the time spent
in physical activities with intensities ≤1.5 METs (SEDENTARY TIMEm/die) and with intensities between 1.5 METs and 3 METs (LIPATm/die) were also considered. The T1 physical activity measurements were the only measurements taken 20 days prior to the end of the training. The weekdays included training days and non-training days. The mean of each parameter over the recorded days was used for the statistical analyses, for both T0 and T1. The T1 physical activity measurements were also gathered for T1 training days data and T1 non-training days data, and they were also separately compared with the T0 measurements. The participants wore their monitors throughout the recording days, except while bathing. The recordings did not include days when it was raining.
Physical exercise programs
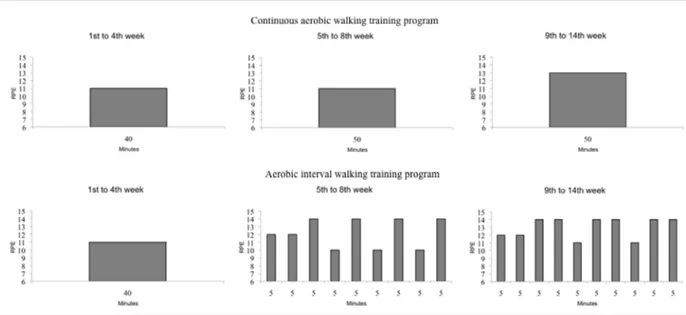
The participants walked on 4 days per week, for 14 weeks, and were randomly assigned to one of two training subgroups: walking CoAT or walking AIT. The exercise intensity was assigned and monitored according to the rating of the perceived exertion (RPE) scale (Borg, 1998). The participants were familiarized with this scale before the beginning of the training and during the first week of the training. Each training session included a 10-min warm-up, a training period, and 5-min to 10-min cooling down. During the warm-up, the walking speed progressively increased until the given intensity was reached. During the cooling down, the walking speed progressively decreased until the RPE decreased from the target level intensity to a RPE <10. The subgroups had the same walking program from the first to the fourth week of training and the same warm-up and cooling down periods throughout the 14 weeks of training (Figure 1).
The walking CoAT participants (n = 16) were trained at moderate intensities (i.e., 11-13 RPE) in a continuous manner. The duration and intensity of their training was modulated according to the week of training (Figure 1).
Starting from the fifth week of training, the walking AIT participants (n = 16) trained with alternating periods of moderate intensity and low intensity, which were modulated according to the duration and the week of training (Figure 1).
We calculated the volume of each exercise session by multiplication of the duration of the session (min) by the RPE points (RPE). The sum of the volume of all of the completed exercise sessions provided the volume of the exercise program of each participant. All of the participants walked together according to their subgroup membership. An exercise trainer supervised all of the weekly sessions, and also checked on compliance with the training sessions. The exercise trainer monitored the exercise intensities of the participants through the talk test, which has been shown to be a relatively precise and consistent method for monitoring exercise intensity (Persinger, Foster, Gibson, Fater, and Porcari, 2004). In addition, to ascertain that the participants trained as precisely as possible at the given intensities, during every training session every participant wore a necklace with a print of the RPE scale as a pendant, to be able to correctly visualize the scale and to transform the perceived exertion into numbers. To eliminate the effects of seasonal changes on the amounts and patterns of physical activity (Buchowski et al., 2009), the study was conducted during the summer. The walking training was the only study intervention.
Statistical analysis
The data were tested for normality before statistical analysis (i.e., skewness and kurtosis tests for normality), using the STATA 10 software (StataCorp LP, College Station, USA), and are presented as means ±standard deviations.
Because of the small sample size, non-parametric statistics were applied. The Wilcoxon test, performed on the whole sample, was used to detect the effect of aerobic walking training, not considering its organization (i.e., walking CoAT or walking AIT), on the investigated variables. When a significant change was detected, the Mann-Whitney test was used to compare the modification between subgroups (i.e., post-training value minus pre-training value, ∆). The same variables were also compared for their basal values with the Mann-Whitney test. To determine whether walking training promoted a reduction in spontaneous physical activity, we compared the mean weekly values of the variables of physical activity recorded at T0 with those recorded at T1. Furthermore, the T0 values were also separately compared with those recorded at T1 during the training days and the non-training days. Statistical significance was set at p ≤0.05.
Results
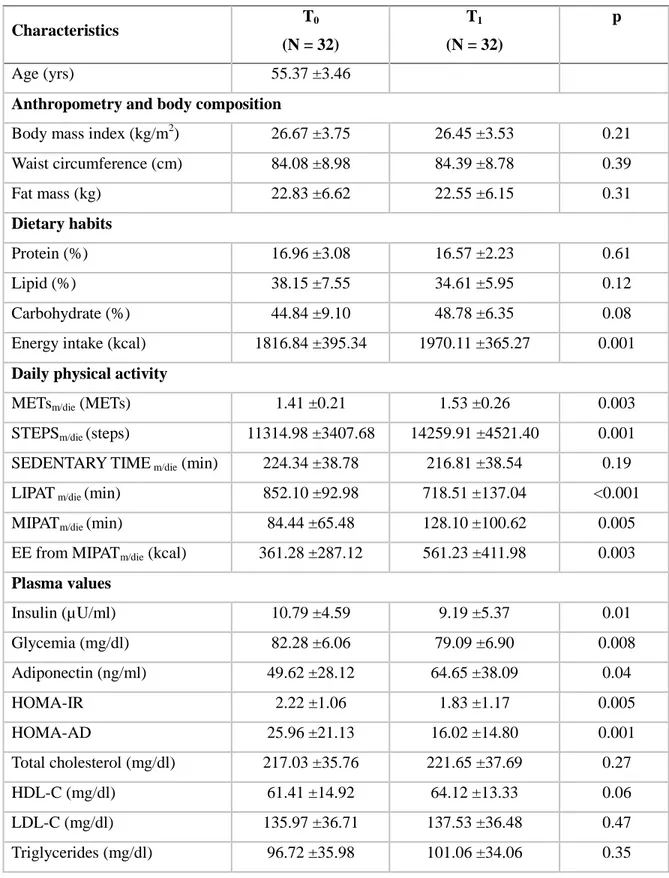
Table 1 shows the basal (T0) characteristics of the participants and the effects of aerobic training on the investigated variables, not considering the effects of its organization. After 14 weeks of aerobic training, participants had a mean significant reduction of plasma insulin (p = 0.01) and glycemia (p = 0.008), and of HOMA-IR (p = 0.005), HOMA-AD (p = 0.001), and LIPATm/die (p <0.001), and a mean significant increase of adiponectin (p = 0.04), aerobic fitness (p <0.001), daily energy intake (p = 0.001), METsm/die (p = 0.003), STEPSm/die (p = 0.001), MIPATm/die (p = 0.005) and EE from MIPATm/die (p = 0.003) (Table 1). To determine the effects of the organization of the experimented aerobic training that had the same volume and mean
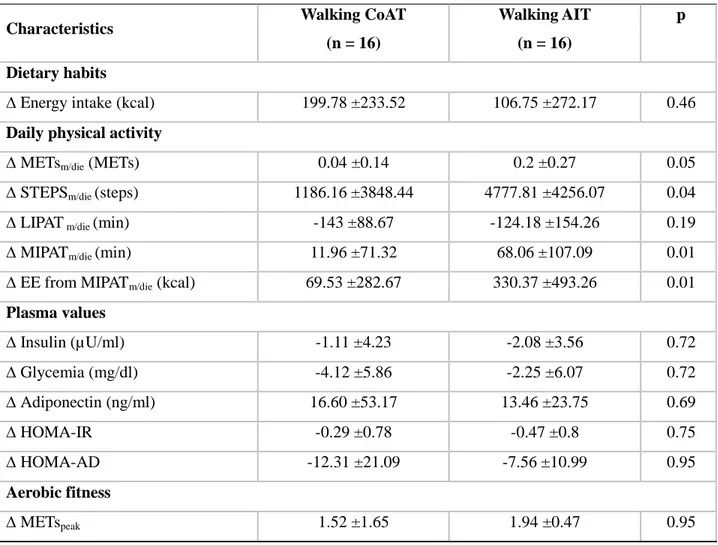
intensity, we compared the ∆ of the significantly modified variables (Table 1) (i.e., walking CoAT vs. walking AIT) (Table 2). Statistical analysis showed that the walking CoAT and walking AIT programs elicited different modifications of only METsm/die (p = 0.05), STEPSm/die (p = 0.04),
MIPATm/die (p = 0.01) and EE from MIPATm/die (p = 0.01): the ∆ values recorded for walking AIT members were significantly greater than those recorded for walking CoAT members (Table 2). When we compared the basal values of the previously described modifications, statistical analysis showed that the subgroups differed only for their basal spontaneous physical activity: before the beginning of the training period, walking CoAT members were more active than walking AIT members; indeed, they had significantly higher STEPSm/die (p = 0.05), MIPATm/die (p = 0.04) and EE from MIPATm/die (p = 0.02) (Table 3). As the literature indicates that the addition of a training program to daily physical activity of previous sedentary women can result in a reduction in their spontaneous physical activity, which counteracts some of the positive effects of the training (Izzicupo et al., 2013; Di Blasio et al., 2013; Di Blasio et al., 2012), we analysed the trend of spontaneous physical activity of our participants. Statistical analysis confirmed that the walking training did not result in any reductions in spontaneous physical activity; indeed, comparisons of the mean weekly values of the variables of physical activity recorded at T0 with those recorded at T1 during nontraining days showed no significant modifications (Table 3). On the contrary, when comparing the T0 data with the data recorded at T1 during training days, significant increases of METsm/die, STEPSm/die, MIPATm/die, and EE from MIPATm/die were detected in both subgroups (Table 3).
The subgroups underwent the same volume of physical exercise (walking CoAT: 19537.19 ±4258.26 min × RPE; walking AIT: 20043.75 ±3557.66 min × RPE; p = 0.83). The choice to consider the volume of physical exercise instead of the number of training sessions
attended was mainly followed because the volume of physical exercise changed from the beginning to the end of the training programs. Indeed, the same adherence with a different distribution of non-attendance does not guarantee that participants had the same amount of physical exercise.
There were no significant modifications recorded across the anthropometric variables.
Discussion
The present study shows the positive effects of walking training on insulin resistance and plasma adiponectin, independent of the anthropometric and dietary habits parameters and of the patterns of walking training. Across these exercise subgroups, when exercising at the same volume and at moderate maximum intensity (RPE 14), walking AIT did not provide better positive metabolic adaptations with respect to a mean-intensity-matched walking CoAT program. Indeed, both of these subgroups showed reduced insulin resistance and increased aerobic fitness and plasma adiponectin levels, without significant differences in the magnitudes of these changes. Our results here are thus different from those of Tjønna et al. (2008), who investigated the effects of high-intensity AIT with respect to moderate-intensity CoAT, and from those of Karstoft et al. (2012), who investigated the effects of walking AIT with respect to walking CoAT; in both of these other studies, AIT elicited better metabolic responses than CoAT. In terms of the Tjønna et al. (2008) study, we appear to have obtained different results because the maximum achievable speed during walking training determines the physical effort that does not exceed the anaerobic threshold but lies between the aerobic and the anaerobic thresholds (Sentija & Markovic, 2009), even if we assume that these untrained postmenopausal women have a low anaerobic threshold (Gaskill et al., 2001; Herdy & Uhlendorf, 2011). This is of great relevance, because the key factor that confers greater efficacy to the high-intensity AIT in terms of the
variations of some of the physiological variables, including insulin resistance, appears to be the combination of high intensity (i.e., intensity greater than the anaerobic threshold) and duration of the bouts of exercise. The discrepancy between our results and those obtained by Karstoft et al. (2012) might be due to the different training intensities used, although we cannot really know whether the relative intensities used by Karstoft et al. (2012) (i.e., % of walking VO2 peak) are lower, equal to, or greater than ours (i.e., RPE) because of the different methods. As reported by Karstoft et al. (2012), the walking speed of their walking CoAT subgroup was so close to normal walking speed as to probably not elicit any significant changes in aerobic fitness, and as a consequence, did not adequately stimulate the body metabolism. On the contrary, in the present study, the walking CoAT group always underwent brisk walking, which corresponds to a slight/ moderate increase in the breathing rate, even during the lowest intensity of the training. So, it is likely that our walking CoAT group trained at higher intensities than that of Karstoft et al. (2012). However, taken all together, in terms of our results here and those recorded in these two cited studies (Tjønna et al., 2008; Karstoft et al., 2012), this confirms that in order to optimize body stimulation through physical exercise, both the pattern of the training and the mean intensity of the training have to be considered. Indeed, these determine the choice, according to the pattern, of exercise intensity and duration, and the total duration of the exercise sessions.
With regard to adiponectin, our results add data to the literature that show that moderate-to-high-intensity physical exercise can have the greatest impact on adiponectin levels, without any well established dose-response relationship (Simpson, Fiatarone, and Singh, 2008). Indeed, the study of Tjønna et al. (2008), which was conducted with moderate-to-high-intensity training, and our study, which was conducted on light-to-moderate-intensity training, suggest that to elicit
plasma adiponectin variations, the mean intensity and duration of the training are more important than the pattern of training.
Although the subgroups had the same positive modifications, neither of them showed any significant reductions in the anthropometric variables and the plasma lipids that could be explained by modifications to the spontaneous dietary habits that occurred; indeed, we detected an increase in the daily energy intake was seen, which probably prevented the achievement of a negative energy balance, a necessary step to induce body-fat reduction (Turner, Holman, Matthews, Hockaday, and Peto, 1979). The positive modifications to HOMA-IR, HOMA-AD and adiponectin reinforce the concept of the positive role of such physical exercise on insulin resistance and plasma levels of adiponectin, independent of body-fat variations.
There is a growing literature that indicates that increased or no modified spontaneous physical activity are not always the consequences of participation in physical exercise (Di Blasio et al., 2012; Manthou, Gill, Wright, and Malkova, 2010). Instead, there are several possible compensatory pathways (e.g., a reduction in spontaneous physical activity as a consequence of participation in a physical exercise program) that are under several controllers (Garland et al., 2011). As aerobic physical exercise has been shown not to be effective to induce improvements to some metabolic variables in the presence of some of these compensatory pathways (i.e., a reduction in spontaneous physical activity) (Di Blasio et al., 2013; Di Blasio et al., 2012), we also analyzed the data relating to the spontaneous physical activity of these participants, in a search for differences or supplementary explanations for the observed metabolic results. Our data show that in both subgroups, physical exercise participation did not elicit a reduction in spontaneous physical activity. Indeed, we did not detect any significant modification of physical activity parameters comparing T0 with T1 nontraining day data, while the T0 with T1 training day
data comparisons reavealed a physical activity increase in both subgroups (Table 3). As a consequence, the observed metabolic results can only be attributed to the physical exercise programs.
The real limitation of our study is the small sample size that prompted the use of nonparametric statistics, to be more certain of the results obtained. Therefore, the consequent conclusions from our study are not generalizable and must be further verified with increased sample size. Following this real limitation, there are questionable limitations. Indeed, even if the use of subjective methods to monitor the intensity of training and the lack of intervention on behavioral variables that might influence the metabolic parameters can be considered limitations of the present study, both the literature and the study design reinforce these weak points. Indeed, the literature reports a strong correlation between the RPE scale and all of the objective parameters of exercise intensity, even if the use of the RPE scale requires the familiarization with both the scale and the method. The method was principally chosen because of its two important characteristics: it is low cost (i.e. no monitors are needed), and it allows automatic regulation of walking speed to maintain the given exercise intensity when aerobic fitness increases. In addition, the monitoring of both spontaneous physical activity and dietary habits allows possible confounding effects to be removed, even if the insertion of an intermediate control, between T0 and T1, is needed to be more certain about the real trend of the dietary and physical activity parameters from the beginning to the end of the study.
According to our data, walking outdoors in an interval pattern at moderate intensity and without running did not provide further gains in terms of positive metabolic effects with respect to those elicited by continuous walking training. Indeed, when matched for moderate intensity, the CoAT and AIT training elicited the same reductions in plasma glucose, insulin, HOMA-IR
and HOMA-AD, and the same increases in aerobic fitness and plasma adiponectin, independent of body fat reduction. Therefore, our results indicate that these different patterns of walking training achieved the same results, thus supplying a useful arguement against sedentarism, in terms of the possibility to use a walking AIT scheme either alone or in rotation with a walking CoAT scheme in both adults and ageing people. At the same time, there is growing literature relating to the positive effects of high-intensity AIT on health. Thus, when appropriate, both in adults (Kessler, Sisson, and Short, 2012) and in seniors (Molmen, Wisloff, Aamot, Stoylen, and Ingul, 2012), a walking AIT scheme can be used as a light introduction to a full interval training scheme to psycologically and physiologically accustom the exercisers.
Acknowledgements
The authors are grateful to Dr. Christopher Berrie for linguistic revision of the manuscript
Funding sources and conflict of interest
The study was supported in part by funds from the Italian Ministry for Education, University and Research. The authors declare that they have no conflicts of interest.
References
ACSM (2005). ACSM Guidelines for Exercise Testing and Prescription. Seventh edition. Baltimore, USA: Lippincott Williams & Wilkins.
Arita Y, Kihara S, Ouchi N, Takahashi M, Maeda K, Miyagawa J, et al. Paradoxical decrease of an adipose-specific protein, adiponectin, in obesity. Biochemical and Biophysical Research Communications 1999; 257:79-83.
Borg G (1998). Borg’s Perceived Exertion and Pain Scales. Champaign, IL: Human Kinetics. Bouassida A, Chamari K, Zaouali M, Feki Y, Zbidi A, Tabka Z. Review on leptin and
adiponectin responses and adaptations to acute and chronic exercise. British Journal of Sports Medicine 2010; 44:620-630.
Buchowski MS, Choi L, Majchrzak KM, Acra S, Mathews CE, Chen KY. Seasonal changes in amount and patterns of physical activity in women. Journal of Physical Activity and Health 2009; 6:252-261.
Di Blasio A, Ripari P, Bucci I, Di Donato F, Izzicupo P, D'Angelo E, et al. Walking training in postmenopause: effects on both spontaneous physical activity and training-induced body adaptations. Menopause 2012; 19:23-32.
Di Blasio A, Bucci I, Ripari P, Giuliani C, Izzicupo P, Di Donato F, et al. Lifestyle and high-density lipoprotein cholesterol in post-menopause. Climateric 2013; epub.
Friedewald WT, Levy RI, Fredrickson DS. Estimation of the concentration of low-density lipoprotein cholesterol in plasma, without use of the preparative ultracentrifuge. Clinical Chemistry 1972; 18:499-502.
Garland T, Schutz H, Chappell MA, Keeney BK, Meek TH, Copes LE, et al. The biological control of voluntary exercise, spontaneous physical activity and daily energy expenditure in
relation to obesity: human and rodent perspectives. Journal of Experimental Biology 2011; 214:206-229.
Gaskill SE, Walker AJ, Serfass RA, Bouchard C, Gagnon J, Rao DC, et al. Changes in ventilatory threshold with exercise training in a sedentary population: the HERITAGE Family Study. International Journal of Sports Medicine 2001; 22:586-592.
Herdy AH, Uhlendorf D. Reference values for cardiopulmonary exercise testing for sedentary and active men and women. Arquivos Brasileiros de Cardiologia 2011; 96:54-59.
Izzicupo P, D’Amico MA, BAscelli A, Di Fonso A, D’Angelo E, Di Blasio A, et al. Walking training affects dehydroepiandrosterone sulfate and inflammation independent of changes in spontaneous physical activity. Menopause 2013; 20:455-463.
Karstoft K, Winding K, Knudsen SH, Nielsen JS, Thomsen C, Pedersen BK, et al. The effects of free-living interval-walking training on glycemic control, body composition, and physical fitness in type 2 diabetes patients. Diabetes Care 2013; 36:228-236.
Kessler HS, Sisson SB, Short KR. The potential for high-intensity interval training to reduce cardiometabolic disease risk. Sports Medicine 2012; 42:489-509.
Manthou E, Gill JMR, Wright A, Malkova D. Behavioral compensatory adjustment to exercise training in overweight women. Medicine and Science in Sports and Exercise 2010; 42:1121-1128.
Marfell-Jones M, Olds T, Stewart A, Carter L (2006). International Standards for
Anthropometric Assessment. Potchefstroom, ZA: ISAK.
Matsuhisa M, Yamasaki Y, Emoto M, Shimabukuro M, Ueda S, Funahashi T, et al. A novel index of insulin resistance determined from the homeostasis model assessment index and
adiponectin levels in Japanese subjects. Diabetes Research and Clinical Practice 2007; 77:151-154.
Matthews DR, Hosker JP, Rudenski AS, Naylor BA, Treacher DF, Turner RC. Homeostasis model assessment: insulin resistance and beta-cell function from fasting plasma glucose and insulin concentrations in man. Diabetologia 1985; 28:412-419.
Molmen HE, Wisloff U, Aamot IL, Stoylen A, Ingul CB. Aerobic interval training compensates age related decline in cardiac function. Scandinavian Cardiovascular Journal 2012; 46:163-171.
Pedersen BK, Saltin B. Evidence for prescribing exercise as therapy in chronic disease. Scandinavian Journal of Medicine and Science in Sports 2006; 16:3-63.
Persinger R, Foster C, Gibson M, Fater DCW, Porcari JP. Consistency of the talk test for exercise prescription. Medicine and Science in Sports and Exercise 2004; 36:533-553.
Sentija D, Markovic G. The relationship between gait transition speed and the aerobic thresholds for walking and running. International Journal of Sports Medicine 2009; 30:795-801.
Simpson KA, Fiatarone Singh MA. Effects of exercise on adiponectin: a systematic review. Obesity 2008; 16:241-256.
Tjønna AE, Lee SJ, Rognmo Ø, Stølen TO, Bye A, Haram PM, et al. Aerobic interval training versus continuous moderate exercise as a treatment for the metabolic syndrome: a pilot study. Circulation 2008; 118:346-354.
Turner JE, Markovitch D, Betts JA, Thompson D. Nonprescribed physical activity energy expenditure is maintained with structured exercise and implicates a compensatory increase in energy intake. American Journal of Clinical Nutrition 2010; 92:1009-1016.
Turner RC, Holman RR, Matthews D, Hockaday TD, Peto J. Insulin deficiency and insulin resistance interaction in diabetes: estimation of their relative contribution by feedback analysis from basal plasma insulin and glucose concentrations. Metabolism 1979; 28:1086-1096.
Villareal-Molina MT, Antuna-Puente B. Adiponectin: anti-inflammatory and cardioprotective effects. Biochimie 2012; 94:2143-2149.
Zhang C, Rexrode KM, van Dam RM, Li TY, Hu FB. Abdominal obesity and the risk of all-cause, cardiovascular, and cancer mortality. sixteen years of follow-up in US women. Circulation 2008; 117:1658-1667.
Table 1. Baseline characteristics (T0) and effects of aerobic training (T1) for all of the participants combined. Characteristics T0 (N = 32) T1 (N = 32) p Age (yrs) 55.37 ±3.46
Anthropometry and body composition
Body mass index (kg/m2) 26.67 ±3.75 26.45 ±3.53 0.21 Waist circumference (cm) 84.08 ±8.98 84.39 ±8.78 0.39 Fat mass (kg) 22.83 ±6.62 22.55 ±6.15 0.31 Dietary habits Protein (%) 16.96 ±3.08 16.57 ±2.23 0.61 Lipid (%) 38.15 ±7.55 34.61 ±5.95 0.12 Carbohydrate (%) 44.84 ±9.10 48.78 ±6.35 0.08 Energy intake (kcal) 1816.84 ±395.34 1970.11 ±365.27 0.001
Daily physical activity
METsm/die (METs) 1.41 ±0.21 1.53 ±0.26 0.003
STEPSm/die (steps) 11314.98 ±3407.68 14259.91 ±4521.40 0.001
SEDENTARY TIME m/die (min) 224.34 ±38.78 216.81 ±38.54 0.19
LIPAT m/die (min) 852.10 ±92.98 718.51 ±137.04 <0.001
MIPATm/die (min) 84.44 ±65.48 128.10 ±100.62 0.005
EE from MIPATm/die (kcal) 361.28 ±287.12 561.23 ±411.98 0.003
Plasma values Insulin (µU/ml) 10.79 ±4.59 9.19 ±5.37 0.01 Glycemia (mg/dl) 82.28 ±6.06 79.09 ±6.90 0.008 Adiponectin (ng/ml) 49.62 ±28.12 64.65 ±38.09 0.04 HOMA-IR 2.22 ±1.06 1.83 ±1.17 0.005 HOMA-AD 25.96 ±21.13 16.02 ±14.80 0.001 Total cholesterol (mg/dl) 217.03 ±35.76 221.65 ±37.69 0.27 HDL-C (mg/dl) 61.41 ±14.92 64.12 ±13.33 0.06 LDL-C (mg/dl) 135.97 ±36.71 137.53 ±36.48 0.47 Triglycerides (mg/dl) 96.72 ±35.98 101.06 ±34.06 0.35
Characteristics T0 (N = 32) T1 (N = 32) p Aerobic fitness METspeak 7.55 ±1.39 8.29 ±1.49 <0.001
Note: METsm/die, mean intensity of daily physical activity; STEPSm/die, daily steps; SEDENTARY TIMEm/die, time spent in physical activities with intensities ≤1.5 METs; LIPATm/die, time spent in physical activities with intensities between 1.5 and 3 METs; MIPATm/die, time spent in moderate-intensity physical activity; EE from MIPATm/die, energy expenditure from MIPATm/die; HOMA-IR, homeostatic model assessment for insulin resistance; HOMA-AD, homeostatic model assessment for insulin resistance corrected by adiponectin; HDL-C, high-density lipoprotein cholesterol; LDL-C, low-density lipoprotein cholesterol.
Table 2. Effects of subgroup membership on the modifications to the variables monitored
Characteristics Walking CoAT
(n = 16)
Walking AIT (n = 16)
p
Dietary habits
∆ Energy intake (kcal) 199.78 ±233.52 106.75 ±272.17 0.46
Daily physical activity
∆ METsm/die (METs) 0.04 ±0.14 0.2 ±0.27 0.05
∆ STEPSm/die (steps) 1186.16 ±3848.44 4777.81 ±4256.07 0.04
∆ LIPAT m/die (min) -143 ±88.67 -124.18 ±154.26 0.19
∆ MIPATm/die (min) 11.96 ±71.32 68.06 ±107.09 0.01
∆ EE from MIPATm/die (kcal) 69.53 ±282.67 330.37 ±493.26 0.01
Plasma values ∆ Insulin (µU/ml) -1.11 ±4.23 -2.08 ±3.56 0.72 ∆ Glycemia (mg/dl) -4.12 ±5.86 -2.25 ±6.07 0.72 ∆ Adiponectin (ng/ml) 16.60 ±53.17 13.46 ±23.75 0.69 ∆ HOMA-IR -0.29 ±0.78 -0.47 ±0.8 0.75 ∆ HOMA-AD -12.31 ±21.09 -7.56 ±10.99 0.95 Aerobic fitness ∆ METspeak 1.52 ±1.65 1.94 ±0.47 0.95
Note: ∆, post-training value minus pre-training value; METsm/die, mean intensity of daily physical activity; STEPSm/die, daily steps; SEDENTARY TIMEm/die, time spent in physical activities with intensities ≤1.5 METs; LIPATm/die, time spent in physical activities with intensities between 1.5 and 3 METs; MIPATm/die, time spent in moderate-intensity physical activity; EE from MIPATm/die, energy expenditure from MIPATm/die; HOMA-IR, homeostatic model assessment for insulin resistance; HOMA-AD, homeostatic model assessment for insulin resistance corrected by adiponectin; HDL-C, high-density lipoprotein cholesterol; LDL-C, low-density lipoprotein cholesterol.
Table 3. Basal differences and trends in the physical activity from T0 to both T1 non-training days and T1 training days, according to subgroup membership.
Characteristics T0 T1 non-training days T1 training days METsm/die Walking CoAT 1.42 ±0.17^ 1.47 ±0.22 1.53 ±0.22^ Walking AIT 1.40 ±0.24^^ 1.53 ±0.31 1.67 ±0.29^^ STEPSm/die Walking CoAT 11914.28 ±2656.71*^ 12571.50 ±5544.39 14610.13 ±5832.47^ Walking AIT 10715.69 ±4021.73*^^ 13188.69 ±6579.54 17794.13 ±3411.50^^
SEDENTARY TIMEm/die
Walking CoAT 230.91 ±48.87 230.68 ±43.42 235.90 ±48.92 Walking AIT 219.75 ±27.79 204.90 ±30.74 214.50 ±40.34 LIPATm/die Walking CoAT 868.81 ±75.40^ 841.44 ±62.39 795.11 ±77.99^ Walking AIT 825.68 ±97.77 827.00 ±147.01 776.56 ±162.14 MIPATm/die Walking CoAT 90.94 ±48.75*^ 81.62 ±58.75 127.81 ±58.46^ Walking AIT 77.94 ±79.97*^^ 122.31 ±109.02 172.75 ±118.99^^
EE from MIPATm/die
Walking CoAT 409.00 ±238.20*^ 364.78 ±278.75 559.21 ±264.96^ Walking AIT 313.56 ±329.81*^^ 500.37 ±467.39 787.12 ±524.84^^
Note: METsm/die, mean intensity of daily physical activity; STEPSm/die, daily steps; SEDENTARY TIMEm/die, time spent in physical activities with intensities ≤ 1.5 METs; LIPATm/die, time spent in physical activities with intensities comprised between 1.5 and 3 METs; MIPATm/die, time spent in moderate-intensity physical activity; *significant differences between basal values, p ≤0.05; ^significant differences between T0 and T1 values, p ≤0.05; ^^ significant differences between T0 and T1 values, p ≤0.01.