The evolution of free acidity and oxidation related
parameters in olive oil during olive ripening from
cultivars grown in the region of Calabria, South Italy
Angelo Maria Giuffrè
Università degli Studi 'Mediterranea‛ di Reggio Calabria, Italy - Dipartimento di AGRARIA, Reggio Calabria, Italia.
*Corresponding author:
Dr. Angelo Maria Giuffrè, Università degli Studi ′Mediterranea′ di Reggio Calabria. Dipartimento AGRARIA. Contrada Melissari, 89124, Reggio Calabria, Italia. Phone: +39 (0) 965.1694362 Email: [email protected]
Received: 11 April 2018; Accepted: 28 June 2018
INTRODUCTION
The olive tree (
Olea europea L.) is one of the symbols of
culture in the Mediterranean basin and, in the human diet,
olive oil is by far the most consumed vegetable oil in this
geographical area. More generally olive oil is one of the
main products of the Mediterranean diet (Boskou, 2015).
Several studies have emphasized its nutraceutical properties,
and it can be considered as a functional food for its
hypertensive, atherogenic, inflammatory and
anti-thrombotic properties (Carluccio et al., 2007). Olive oil’s
high content of oleic acid and minor components (such as
phenols) could reduce oxidative damage (Fitó et al., 2007),
may exert a protective effect against the development of
many type of cancer, mainly breast cancer (Escrich et al.,
2007) and can reduce cardiovascular disease risk factors
(Huang and Sumpio, 2008). In addition, if olive oil is applied
to the skin after sun exposure, it shows an inhibitory effect
on sun-induced cancer development (Viola and Viola, 2009).
Studies conducted on the relationship between bioactive
compounds and human health have demonstrated the
beneficial effects of phenols, which were found to stimulate
osteoblast cell (MG-63) proliferation (García-Martínez et
al., 2016). Findings in animal experimental models (Bulotta
et al., 2014) proved that oleuropein and hydroxytyrosol have
both a high bioavailability (Cicerale et al., 2010; Cicerale
et al., 2012), and an absolute absence of acute or
sub-chronic toxicity (D’Angelo et al., 2001; Soni et al., 2006).
From the organoleptic point of view, phenols in olive oil
are responsible for bitterness (Dabbou et al., 2011).
Many factors were found to influence olive fruit and olive
oil composition. Harvest year was found to influence the
olive fruit (Giuffrè, 2017) and olive oil composition with
regard to triglycerides (Giuffrè, 2013a) and some minor
components such as sterols (Giuffrè 2012; Giuffrè and
Louadj, 2013), waxes (Giuffrè, 2013b) and fatty alcohols
(Giuffrè 2013c; Giuffrè 2014a).
Another factor influencing olive oil composition is the
harvest date, which was found to affect sterols (Giuffrè
et al., 2012), waxes (Giuffrè, 2014b), fatty alcohols (Giuffrè,
2014c) and triglycerides (Giuffrè, 2014d).
The variation in free acidity and oxidation related parameters was studied in olive oil produced from olives at different stages of ripening from cultivars growing in the Calabria region (South Italy). A three-year study was conducted on twelve cultivars growing in rainfed conditions. The number of bi-weekly samplings per each cultivar varied from 5 to 7 depending on the cultivar characteristics in this geographical area. Free acidity remained within the present legal parameters for an extra virgin olive oil (< 0.8%) in all cultivars until 1st November and was
highest in Nocellara Messinese cv (1.23%) and in Sinopolese cv (1.25%) on 3rd January. Phenolic and tocopherol contents were highest
in oils from Nociara cv (350 mg kg-1 and 223 mg kg-1 respectively) and in Coratina cv (342 mg kg -1 and 216 mg kg-1 respectively) on
1st October and decreased constantly during olive ripening. Oil stability index was maximum in Itrana cv, from 22.48 h to 8.82 h in two
months ripening. Chlorophyll and carotene content decreased with harvest date. Keywords: Biodiversity; Harvest date; Oil oxidation; Olive cultivar
A B S T R A C T
http://www.ejfa.me/
During olive fruit ripening oil quantity increases (Lavee and
Wodner, 2004; Desouky et al., 2010; Laila Haggag et al.,
2013; Giuffrè, 2017) but olive oil quality may deteriorate,
for this reason it is important to know the rate at which
the chemical parameters vary, so as to decide the optimum
moment to collect drupes, obtaining the best balance
between olive oil quantity and chemical quality.
This work discusses findings on free acidity and the
parameters related to oil oxidation during olive ripening
of twelve cultivars in the region of Calabria (South Italy).
MATERIALS AND METHODS
The geographical area of production, the choice of the
olive cultivars and the applied agronomic practices have
been described in a previous work (Giuffrè, 2017). A 25 kg
aliquot of fruits for each cultivar and for each harvest
date was randomly and manually collected from ten olive
trees and was quickly transferred to the laboratory. The
oil extraction was conducted within four hours of olive
harvesting with a laboratory mill Agrimec Valpesana, San
Casciano (Florence, Italy). Olives were washed and crushed
with a metallic hammer crusher, after which the olive paste
was placed in a stack with metallic grids and the oil-water
mixture was extracted by pressure. After extraction, the
oil-water mixture was centrifuged with a laboratory centrifuge
and the obtained oil was filtered with filter paper. The olive
oil was stored in 100 mL amber coloured glass bottles, and
closed with a screw cap polymeric material. The bottles
were then stored at about 15 - 17 °C in the dark until
analysis. All oils were analysed within 5 days of extraction.
Analytical methods
Free acidity
Free acidity was determined with the method proposed by
the EU (2015), Annex II. The oil was dissolved in a diethyl
ether/ethylic alcohol solution 1:1 and titration was carried
out with a 0.1 N NaOH solution.
Peroxide value
Peroxide was determined with the method proposed by
the EU (2015), Annex III. The oil was dissolved in a 2:3
chloroform/acetic acid solution and titration was carried
out with a 0.01 N sodium thiosulphate solution.
Spectrophotometric indices
The analysis in the ultraviolet region was conducted as
suggested by the European Regulation annex IX (EU, 2015).
In brief, the oil was dissolved in cyclohexane (1:100) and the
solution was read at 232 and 270 nm. These absorptions are
expressed as specific extinctions E
1%1 cm (the extinction
of 1 % solution of the fat in the specified solvent, in a
thickness of 1 cm) conventionally indicated by K (also
referred to as ‘extinction coefficient’) (EU, 2015). A Perkin
Elmer Waltham, Massachusetts, U.S.A. spectrophotometer
(model Lambda 2, double ray) was used.
Carotenes and chlorophylls
Carotene and chlorophyll contents were quantified
spectrophometrically using the method proposed by
Minguez-Mosquera (1991).
Total phenolic content
The total phenolic content was determined according to
the method proposed by Kalantzakis et al (2006).
Total tocopherol content
Tocopherol composition analysis was conducted by HPLC
and the IUPAC method 2432 (1987) was applied. The
HPLC analysis was carried out using a Knauer instrument
(Berlin, Germany) equipped with an UV detector
(model 2600) and by a 5 μm LiChrosorb RP18 (Merck)
(120 x 4.6 mm), methanol/water (98/2) was the mobile
phase at a flow rate of 1.5 mL/min.
Oil stability index (OSI)
OSI was determined with the method Cd-12b-92 proposed
by AOAC (1997).
A Rancimat apparatus model 679 (Metrohm,
Herisau - Switzerland) was used. A 5 g aliquot of oil
was placed in the reaction tube and the instrument was
heated to 110 °C. A 150 mL/min air flow was set and the
conductivity tube was filled with 50 mL of bi-deionised
water. The speed chart was 1 cm/h.
Antioxidant activity (DPPH assay)
The test allows antioxidant power to be determined
by reacting the sample to be analysed with a solution
of DPPH
●[2,2-diphenyl-1-picrylhydrazyl, PM 394.33,
C18H72N5O6] and analysing the decrease in the peak of
the radical by UV analysis. The radical scavenging activity
towards DPPH
●was expressed as the percentage reduction
in DPPH concentration by the constituents of the oils
(Kalantzakis et al., 2006). The antiradical activity of olive
oils was calculated using a 6 * 10
-5M DPPH· in methanol
solution and reading the absorbance at 515 nm with an
Agilent spectrophotometer, model 89090A (CA, USA).
Statistical analysis
All olive oils were analysed in triplicate from samples
separately prepared. Excel 2010 software was used to
calculate means and standard deviations. SPSS 17.0
software for Windows (SPSS Inc., Chicago, IL, USA)
was used to calculate statistical differences by one-way
ANOVA and Tukey test for post hoc analysis at
p < 0.05;
two variables were considered: the cultivar and the fruit
harvest date.
RESULTS AND DISCUSSION
Free acidity
FA is due to the hydrolysis of triglycerides in the presence
of water and by the catalytic action of the lipase enzyme. In
this process, triglycerides are split into glycerol, mono ,
di-glycerides and fatty acids. This process starts in the fruits, in
particular when the skin has been broken by insects (mainly
Bactrocera oleae) or if they are damaged by hailstorms or
during drupe harvesting. FA values are presented in Table 1.
Considering only this parameter, before 1
stNovember all
cultivars produced extra virgin olive oil, i.e. all oils showed
a FA value below the 0.8% indicated by the EU (2015) and
COI (2015). After this date EVOO continued to be extracted
only from Cassanese cv until 3
rdJanuary. The oil obtained
from Coratina (1.03%) and Ottobratica cvs (0.83%) were
the first two (mid-November) which exceeded the maximum
FA value indicated by the International standards for an
EVOO. In the studied oils, FA showed a very high significant
increase with harvest date for all cultivars. The cultivar effect
determined very highly significant (1
stOctober) or highly
significant differences (in on all the other harvest dates).
Peroxide value
PV is related to the oxidation of the unsaturated fatty acids
contained in an oil with the formation of hydroperoxides.
From the chemical point of view oxidation is a spontaneous
reaction of fat due to free radicals of unsaturated acids
in contact with oxygen in the air with a classic chain
reaction that occurs through a trigger and a subsequent
propagation reaction. The oxidised oils or fats develop an
unpleasant odour and taste that render the oil unpalatable
and, finally, inedible. Both the European (EU, 2015) and
the COI (COI, 2015) standards indicate only one value
(20 meq O
2/kg) to distinguish whether an oil is edible or
not. Sinopolese cv was borderline after 1
stDecember and
exceeded this value from mid-December. Frantoio, Itrana,
Nociara, Picholine and Roggianella cvs showed the lowest
values throughout harvesting (Table 2). In the studied oils,
Sinopolese cv exceeded 10 meq O
2/kg on all harvest dates,
moreover, this cultivar showed the highest values for all
cultivars on all harvest dates except on 1
stOctober. In nine
of the twelve studied cultivars an initial PV decrease and a
subsequent increase was observed. Other Authors found
the same trend in oil from fruits of a Jordan Nabali cv
(Humeid et al., 1992), in oil from fruits of seven Tunisian
oleasters (Baccouri et al., 2007), in oil from fruits from
Arbequina cv grown in Spain (Abenoza et al., 2015) and
in oil from fruits of Manzanilla cv and Frantoio cv grown
in Australia (Alowaiesh et al., 2016). We found a different
trend in oil from Leccino cv in which we measured an
initial increase and a subsequent decrease (Table 2). We
found a constant increase only in oil from Sinopolese cv,
from the first to the last harvest date, similar to findings
by El Sohaimy et al. (2016) who found the same increase
in Manzanilla and Kalamata cvs from Egypt.
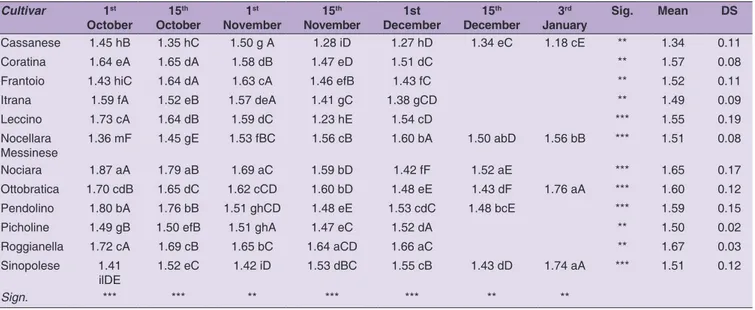
K 232 and K270
Spectrophotometric analysis in the ultraviolet can provide
information about the quality of a fat, its state of
preservation and changes brought about by technological
processes. The presence of conjugated diene and triene
systems determines the absorption at 232 nm and 270 nm
respectively (EU, 2015). K232 values are listed in the
Table 3. The average K232 values in olive oils showed
significant variations during olive ripening (
p < 0.001;
p < 0.01). A decreasing trend was found in almost all
cultivars except in Sinopolese, Nociara and Nocellara
Messinese cvs in which a non-constant trend was detected.
In many cases the K232 value of the last sampling during
Table 1: Free acidity variation in olive oil (expressed as % of oleic acid) during fruit ripening. Results are presented as themean value ± standard deviation, n=3; ***significance at P < 0.001; ** significance at P < 0.01. Means in the same column are distinguished by small letters. Means in the same line are distinguished by capital letters
Cultivar 1st October 15 th October 1 st November 15 th November 1 st December 15 th December 3 rd
January Sig. Mean DS
Cassanese 0.29 iCD 0.31 hiC 0.34 gB 0.34 hB 0.36 mA 0.30 eC 0.37 dA ** 0.33 0.03
Coratina 0.54 aE 0.61 aD 0.66 aC 1.06 aB 1.31 aA *** 0.83 0.33
Frantoio 0.30 iE 0.33 hD 0.37 gC 0.65 eB 0.72 iA *** 0.47 0.20
Itrana 0.42 cdE 0.52 cCD 0.54 eC 0.70 dB 0.77 gA *** 0.59 0.14
Leccino 0.45 cD 0.46 dD 0.60 cC 0.73 cB 0.80 fA *** 0.61 0.16
Nocellara
Messinese 0.30 iF 0.52 cE 0.67aD 0.69 dD 1.09 bC 1.19 aB 1.23 abA *** 0.81 0.36
Nociara 0.35 fgF 0.42 eE 0.55 eD 0.61 fC 0.66 lB 1.20 aA *** 0.63 0.30 Ottobratica 0.37 fF 0.53 cE 0.64 bD 0.83 bC 0.89 dB 0.95 cA 0.95 cA ** 0.74 0.23 Pendolino 0.50 bF 0.58 bE 0.65 abD 0.74 cC 0.89 dB 1.00 bA *** 0.73 0.19 Picholine 0.32 hDE 0.35 gD 0.42 fC 0.61 fB 0.75 ghA *** 0.49 0.19 Roggianella 0.27 lE 0.38 fD 0.44 fC 0.50 gB 0.99 cA *** 0.52 0.28 Sinopolese 0.40 eG 0.47 dF 0.58 dE 0.72 cD 0.86 eC 0.93 cdB 1.25 aA *** 0.74 0.29 Sign. *** ** ** ** ** ** **
olive ripening was in countertrend to the decreasing trend.
All K232 values from October to January were within the
2.50 stated by the European regulations (EU, 2015) and the
International Olive Council (COI, 2015) for an extra virgin
olive oil. The cultivar effect showed significant differences
(
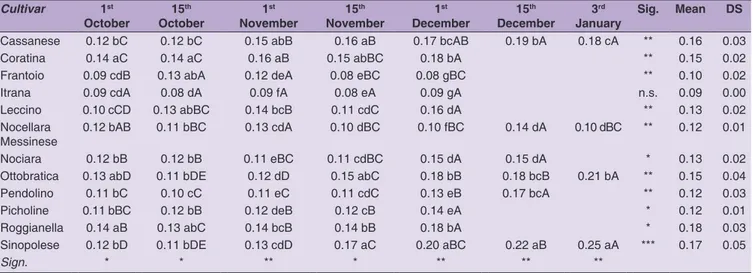
p < 0.001; p < 0.01) at each harvest date (Table 3). K270
values were significantly different during olive ripening
except for Itrana cv in which no differences were found
in the oil extracted from 1
stOctober to 1
stDecember
(Table 4). Cassanese, Coratina, Roggianella and Sinopolese
cvs showed a constant trend and the K270 value
increased with harvest date. The other cultivars showed
a non-constant trend, sometimes with an initial decrease
(Nocellara Messinese, Nociara, Ottobratica, Pendolino)
and a final increase. Almost all K270 values were within
the 0.22 stated by the European regulations (EU, 2015) and
the International Olive Council (COI, 2015) for an extra
virgin olive oil, except for Sinopolese cv when olives were
picked on the last two harvest dates (Table 4).
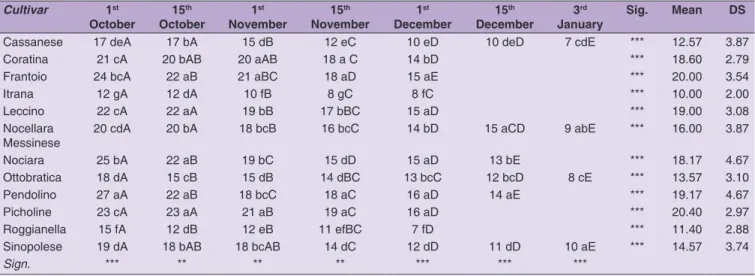
Carotenes and Chlorophylls
Carotenes are pigments exerting an antioxidant activity in
olive oil (Servili and Montedoro, 2002). Chlorophylls exert
an antioxidant activity if oil is stored in the dark whereas,
when oil is exposed to the light they promote the formation
of oxygen radicals and speed oxidation. Carotenes and
chlorophylls are also responsible for colour in olive oil,
yellow-orange and green respectively.
Table 2: Peroxide value variation in olive oil (expressed as meq O2/kg) during fruit ripening. Results are presented as the mean value ± standard deviation, n=3; ***significance at P < 0.001; ** significance at P < 0.01. Means in the same column are distinguished by small letters. Means in the same line are distinguished by capital letters
Cultivar 1st October 15 th October 1 st November 15 th November 1 st December 15 th December 3 rd
January Sig. Mean DS
Cassanese 8.37 fgA 5.24 mE 6.21 hD 4.17 nF 7.81 ilB 8.36 eA 7.17 dC *** 6.76 1.62
Coratina 11.43 aA 8.93 eC 10.38 dB 6.14 mD 5.20 nE *** 8.41 2.68 Frantoio 7.51 iB 6.66 hD 6.23 hE 7.22 fC 7.86 iA *** 7.10 0.65 Itrana 4.65 mC 4.45 nD 6.34 gB 6.33 eB 8.00 hA *** 5.95 1.45 Leccino 10.03 eD 11.17 bC 12.48 bA 11.47 cB 9.44 fE *** 10.92 1.20 Nocellara Messinese 10.80 cD 9.19 dE 8.89 fF 8.80 dFG 11.20 cC 11.48 bB 14.30 bA *** 10.67 1.96
Nociara 7.70 hB 6.58 iDE 5.99 ilF 6.68 iD 9.22 gA 7.52 fC *** 7.28 1.14
Ottobratica 8.42 fF 7.56 gG 11.65 cD 12.06 bC 13.40 bB 9.88 dE 13.76 cA *** 10.96 2.40 Pendolino 11.73 bA 10.43 cC 8.93 eE 6.73 hF 9.51 eD 11.05 cB *** 9.73 1.78 Picholine 7.43 lC 8.27 fB 5.75 mE 6.35 lD 9.63 dA *** 7.49 1.54 Roggianella 7.44 lB 6.12 lD 6.03 iDE 7.15 gC 7.77 mA *** 6.90 0.79 Sinopolese 10.63 dG 12.76 aF 13.50 aE 15.99 aD 17.55 aC 21.51 aB 25.33 aA *** 14.34 4.65 Sign. *** *** *** *** *** *** ***
Table 3: K232 value variation in olive oil during fruit ripening. Results are presented as the mean value ± standard deviation, n=3; ***significance at P < 0.001; ** significance at P < 0.01. Means in the same column are distinguished by small letters. Means in the same line are distinguished by capital letters
Cultivar 1st October 15 th October 1 st November 15 th November December1st 15 th December 3 rd
January Sig. Mean DS
Cassanese 1.45 hB 1.35 hC 1.50 g A 1.28 iD 1.27 hD 1.34 eC 1.18 cE ** 1.34 0.11
Coratina 1.64 eA 1.65 dA 1.58 dB 1.47 eD 1.51 dC ** 1.57 0.08
Frantoio 1.43 hiC 1.64 dA 1.63 cA 1.46 efB 1.43 fC ** 1.52 0.11
Itrana 1.59 fA 1.52 eB 1.57 deA 1.41 gC 1.38 gCD ** 1.49 0.09 Leccino 1.73 cA 1.64 dB 1.59 dC 1.23 hE 1.54 cD *** 1.55 0.19 Nocellara Messinese 1.36 mF 1.45 gE 1.53 fBC 1.56 cB 1.60 bA 1.50 abD 1.56 bB *** 1.51 0.08 Nociara 1.87 aA 1.79 aB 1.69 aC 1.59 bD 1.42 fF 1.52 aE *** 1.65 0.17 Ottobratica 1.70 cdB 1.65 dC 1.62 cCD 1.60 bD 1.48 eE 1.43 dF 1.76 aA *** 1.60 0.12 Pendolino 1.80 bA 1.76 bB 1.51 ghCD 1.48 eE 1.53 cdC 1.48 bcE *** 1.59 0.15
Picholine 1.49 gB 1.50 efB 1.51 ghA 1.47 eC 1.52 dA ** 1.50 0.02
Roggianella 1.72 cA 1.69 cB 1.65 bC 1.64 aCD 1.66 aC ** 1.67 0.03
Sinopolese 1.41
ilDE 1.52 eC 1.42 iD 1.53 dBC 1.55 cB 1.43 dD 1.74 aA *** 1.51 0.12
Per our findings, both carotene and chlorophyll contents
showed a gradual decrease during olive ripening. Pendolino
and Sinopolese cultivars had the highest initial carotene
content (40 mg kg
-1oil), whereas in all other cultivars a
carotene content lower than 25 mg kg
-1was calculated.
Itrana cv showed the lowest carotene content before
15
thNovember (Table 5). Baccouri et al (2007) found the
same decreasing trend in oil obtained from fruits of the
Tunisian wild oleaster and a similar carotene content was
found from the first to the last harvest date.
Total phenolic content
Phenols can be found in every part of all plants, and are
a fundamental part of the human diet. Three classes of
phenols are present in olives: i) lignans, ii) the simple
phenol derivatives from phenylethyl alcohol, cinnamic and
benzoic acids, iii) the oleuropein and ligstroside aglycons
and their derivatives (Conde et al., 2008). The cultivar effect
caused high and very high significant differences in the
cultivars studied in this work. The total phenolic content
decreased in the oil of all cultivars with drupe ripening
and the calculated means showed very highly significant
differences (
p < 0.001) from the first to the last harvest
date (Table 7). Six of the twelve studied cultivars had an
initial total phenolic content higher than 300 mg kg
-1. After
one month’s ripening, only in the oil of two cultivars this
value was exceeded, i.e. Coratina (364 mg kg
-1) and Nociara
(312 mg kg
-1). The initial highest total phenolic content was
Table 4: K270 value variation in olive oil during fruit ripening. Results are presented as the mean value±standard deviation, n=3; ***significance at P<0.001; ** significance at P< 0.01; * significance at P< 0.05; n.s., not significant. Means in the same column are distinguished by small letters. Means in the same line are distinguished by capital letters.
Cultivar 1st October 15 th October 1 st November 15 th November 1 st December 15 th December 3 rd
January Sig. Mean DS
Cassanese 0.12 bC 0.12 bC 0.15 abB 0.16 aB 0.17 bcAB 0.19 bA 0.18 cA ** 0.16 0.03
Coratina 0.14 aC 0.14 aC 0.16 aB 0.15 abBC 0.18 bA ** 0.15 0.02
Frantoio 0.09 cdB 0.13 abA 0.12 deA 0.08 eBC 0.08 gBC ** 0.10 0.02
Itrana 0.09 cdA 0.08 dA 0.09 fA 0.08 eA 0.09 gA n.s. 0.09 0.00
Leccino 0.10 cCD 0.13 abBC 0.14 bcB 0.11 cdC 0.16 dA ** 0.13 0.02
Nocellara
Messinese 0.12 bAB 0.11 bBC 0.13 cdA 0.10 dBC 0.10 fBC 0.14 dA 0.10 dBC ** 0.12 0.01
Nociara 0.12 bB 0.12 bB 0.11 eBC 0.11 cdBC 0.15 dA 0.15 dA * 0.13 0.02
Ottobratica 0.13 abD 0.11 bDE 0.12 dD 0.15 abC 0.18 bB 0.18 bcB 0.21 bA ** 0.15 0.04
Pendolino 0.11 bC 0.10 cC 0.11 eC 0.11 cdC 0.13 eB 0.17 bcA ** 0.12 0.03
Picholine 0.11 bBC 0.12 bB 0.12 deB 0.12 cB 0.14 eA * 0.12 0.01
Roggianella 0.14 aB 0.13 abC 0.14 bcB 0.14 bB 0.18 bA * 0.18 0.03
Sinopolese 0.12 bD 0.11 bDE 0.13 cdD 0.17 aC 0.20 aBC 0.22 aB 0.25 aA *** 0.17 0.05
Sign. * * ** * ** ** **
Table 5: Carotene variation in olive oil during fruit ripening. Results are presented as the mean value ± standard deviation, n=3; ***significance at P < 0.001; ** significance at P < 0.01; * significance at P <0.05. Means in the same column are distinguished by small letters. Means in the same line are distinguished by capital letters
Cultivar 1st October 15 th October 1 st November 15 th November 1 st December 15 th December 3 rd
January Sig. Mean DS
Cassanese 15 deA 13 eB 10 eC 10 bcC 7 cdD 8 cD 4 bcE *** 9.45 3.63
Coratina 23 bcA 23 cA 14 bcB 8 dC 8 cC ** 15.03 7.57
Frantoio 22 cA 14 eB 15 bcB 10 bcC 8 cD *** 13.80 5.40
Itrana 9 gA 7 fgAB 4 gC 3 eC 7 cdAB ** 6.00 2.36
Leccino 25 bA 16 deB 11 dC 11 bC 8 cD *** 14.17 6.71 Nocellara Messinese 17 dA 13 eB 12 dB 7 dC 7cdC 16 bA 6 bC ** 11.14 4.53 Nociara 23 bcA 9 fB 8 fB 7dB 5 eC 5 dC ** 9.33 6.91 Ottobratica 23 bcA 18 dB 12 dC 11 bC 11 bC 9 cD 5 bE *** 12.83 6.08 Pendolino 40 aA 28 bB 16 bD 12 bE 12 bE 20 aC ** 21.39 10.87 Picholine 21 cA 17 dB 9 fD 9 cD 12 bC ** 13.37 5.15 Roggianella 11 fA 9 fAB 10 eA 7 dC 6 dC ** 8.60 2.07 Sinopolese 40 aA 31 aB 23 aC 17 aD 17 aD 17 bD 20 aC ** 23.64 8.76 Sign. ** ** ** * ** ** **
found in the oil from Coratina cv (382 mg kg
-1) in which this
antioxidant fraction decreased 14.92% after two months,
even if it remained the highest for all the harvest dates on
which Coratina cv was picked. Pendolino and Sinopolese
cvs contained the lowest phenolic values which were lower
than 200 mg kg
-1on their respective last sampling dates.
The decreasing trend we observed was in agreement with
findings of other Authors in oil from Hojoblanca and
Picual cvs grown in Spain (Gutiérrez et al., 1999), and as
found in oils of Ottobratica cv (Sicari et al., 2009) and
Roggianella cv (Giuffrè et al., 2010) grown in a geographical
area close to that of the present experiment.
Tocopherol content
Tocopherols are the second main class of antioxidants in
an olive oil in which α-tocopherol is the component present
in the highest quantity, from 88.5% to more than 95%, the
remaining part is β+γ tocopherol and δ-tocoppherol (Fedeli,
1977; Huang et al., 2008; Asik and Özkan, 2011). In nature
the total content in α-tocopherol decreases with fruit ripening
(Tripoli et al. 2005).
From olives of the Nociara cv the oil with the highest
initial tocopherol content (223 mg/kg) was extracted, which
gradually decreased 2.56 times to 87 mg/kg in olives collected
on 15
thDecember (Table 8). On 1
stOctober a tocopherol
content higher than 200 mg/kg was found in the oil of 5 of
the 12 studied cultivars: Coratina, Itrana, Nociara, Ottobratica
and Picholine. After one month, no cultivar produced an oil
exceeding this quantity. The cultivar effect produced highly
significant or very highly significant differences during olive
ripening. The harvest date produced significant, highly
significant and very highly significant differences in the same
oils. Gutierrez et al (1999), in Spanish cultivars a decreasing
Table 7: Total phenol variation in olive oil during fruit ripening. Results are presented as the mean value ± standard deviation. n=3; ***significance at P < 0.001; ** significance at P < 0.01; * significance at P < 0.05. Means in the same column are distinguished by small letters. Means in the same line are distinguished by capital lettersCultivar 1st October 15 th October 1 st November 15 th November 1 st December 15 th December 3 rd
January Sig. Mean DS
Cassanese 344 bA 298 eB 276 dC 267 dD 256 cE 241 bcF 193 bcG *** 267.86 47.03
Coratina 382 aA 379 aAB 364 aC 348 aD 325 aE *** 359.60 23.61
Frantoio 267 eA 258 iB 230 ghC 226 iCD 212 hE *** 238.60 23.04
Itrana 309 cA 283 fgB 277 dC 261 deD 250 cdE *** 276.00 22.58
Leccino 273 eA 257 lB 247 fC 232 ghD 208 hE *** 243.60 24.89
Nocellara
Messinese 295 dA 288 fB 279 dC 270 dCD 252 cE 223 dF 209 aG *** 259.43 32.92
Nociara 350 bA 344 bAB 312 bC 292 bD 281 bE 262 aF *** 306.89 35.21
Ottobratica 345 bA 332 cB 293 cC 286 bcCD 259 cE 249 bF 199 bG *** 280.43 50.10
Pendolino 254 fA 236 nB 233 ghBC 220 iD 201 hiE 195 fEF *** 223.11 22.35
Picholine 313 cA 312 dAB 254 eC 245 fgD 233 fE *** 271.40 38.26
Roggianella 289 dA 276 hB 255 eC 253 fCD 241 eE *** 262.80 19.32
Sinopolese 255 fA 246 mAB 239 gC 240 gC 222 gD 209 eE 192 bcF *** 229.00 22.42
Sign. ** *** ** ** *** *** ***
Table 6: Chlorophyll variation in olive oil during fruit ripening. Results are presented as the mean value ± standard deviation, n=3; ***significance at P < 0.001; ** significance at P < 0.01; * significance at P < 0.05. Means in the same column are distinguished by small letters. Means in the same line are distinguished by capital letters
Cultivar 1st October 15 th October 1 st November 15 th November 1 st December 15 th December 3 rd
January Sig. Mean DS
Cassanese 17 deA 17 bA 15 dB 12 eC 10 eD 10 deD 7 cdE *** 12.57 3.87
Coratina 21 cA 20 bAB 20 aAB 18 a C 14 bD *** 18.60 2.79
Frantoio 24 bcA 22 aB 21 aBC 18 aD 15 aE *** 20.00 3.54
Itrana 12 gA 12 dA 10 fB 8 gC 8 fC *** 10.00 2.00
Leccino 22 cA 22 aA 19 bB 17 bBC 15 aD *** 19.00 3.08
Nocellara
Messinese 20 cdA 20 bA 18 bcB 16 bcC 14 bD 15 aCD 9 abE *** 16.00 3.87
Nociara 25 bA 22 aB 19 bC 15 dD 15 aD 13 bE *** 18.17 4.67
Ottobratica 18 dA 15 cB 15 dB 14 dBC 13 bcC 12 bcD 8 cE *** 13.57 3.10
Pendolino 27 aA 22 aB 18 bcC 18 aC 16 aD 14 aE *** 19.17 4.67
Picholine 23 cA 23 aA 21 aB 19 aC 16 aD *** 20.40 2.97
Roggianella 15 fA 12 dB 12 eB 11 efBC 7 fD *** 11.40 2.88
Sinopolese 19 dA 18 bAB 18 bcAB 14 dC 12 dD 11 dD 10 aE *** 14.57 3.74
α-tocopherol content was found in oil from Picual cv and
an initial α-tocopherol constant content with a subsequent
decreasing content during ripening in oil from Hojiblanca cv
(Sakouhi et al., 2008). Neves, 2011; Gutierrez 1999; Salvador,
2001
OSI
The resistance to oxidation of an oil or fat depends
on natural or added antioxidants, saturation degree,
pro-oxidants or prior abuse. Oxidation is slow until
this resistance is overcome, at which point oxidation
accelerates and becomes very fast. The time before this fast
acceleration of oxidation is called the ‘induction period’
(AOAC, 1997). The results of our study can classify the oils
into three groups. Itrana cv (first group) showed the highest
resistance to oxidation, on 1
stOctober the oil extracted
from this cultivar resisted oxidation for 22.48 h, decreasing
to 8.82 h in oil produced 2 months later. Picholine, Coratina
and Nociara were in the second group and resisted 10-12 h
during October. All other cultivars (third group) presented a
resistance 10 h from the start of the study. The harvest date
caused very highly significant differences (p < 0.001) in the
OSI decreasing trend during olive ripening in all cultivars.
The cultivar effect caused highly significant (p < 0.01)
and very highly significant differences (p < 0.001). Our
results are in accordance with findings of Sicari (2017)
who found significant differences between oils extracted
from different cultivars.
Antiradical activity (DPPH assay)
The antiradical activity (AA) in olive oil was evaluated
with the DPPH assay. Many Authors have found a
positive correlation between the radical scavenging activity
measured as DPPH percentage of inhibition and the total
phenolic content in olive oil (Samaniego Sánchez et al.,
2007; Asik and Özkan, 2011; Goldsmith et al., 2014).
Table 8: Total tocopherol variation in olive oil during fruit ripening. Results are presented as the mean value ± standard deviation. n=3; ***significance at P < 0.001; ** significance at P< 0.01; * significance at P < 0.05. Means in the same column are distinguished by small letters. Means in the same line are distinguished by capital lettersCultivar 1st October 15 th October 1 st November 15 th November 1 st December 15 th December 3 rd
January Sig. Mean DS
Cassanese 189 eA 174 cB 141 cV 111 fD 85 eE 70 dF 71 bF *** 120.14 48.86
Coratina 216 abA 203 aB 178 abC 165 bD 144 aE *** 180.60 28.37
Frantoio 168 fA 150 dB 133 cdC 120 eD 80 fE *** 130.20 33.36 Itrana 202 cdA 188 bB 173 bC 106 gD 94 dE *** 152.60 49.28 Leccino 156 gA 131 eB 128 dB 127 dB 90 deC * 126.40 23.59 Nocellara Messinese 104 hA 106 gA 98 fB 90 hC 86 eCD 77 cE 50 cF ** 87.29 19.36 Nociara 223 aA 207 aB 181 aC 174 aD 100 cE 87 abF *** 162.00 56.07 Ottobratica 204 cdA 200 aA 187 aB 155 cC 108 bD 91 aE 88 aF *** 147.57 51.41
Pendolino 132 hA 127 efAB 111 eC 89 hD 85 eDE 83 bE *** 104.50 21.85
Picholine 209 cA 152 dB 116 eC 80 lD 73 gE *** 126.00 56.10
Roggianella 153 gA 150 dA 133 cdB 85 iC 84 eC ** 121.00 34.18
Sinopolese 112 iA 105 gB 94 fC 83 iD 84 eD 72 dE 70 bE ** 88.57 15.91
Sign. *** *** ** *** ** ** ***
Table 9: OSI variation in olive oil during fruit ripening. Results are presented as the mean value ± standard deviation. n=3; ***significance at P < 0.001; ** significance at P < 0.01; * significance at P < 0.05. Means in the same column are distinguished by small letters. Means in the same line are distinguished by capital letters
Cultivar 1st October 15 th October 1 st November 15 th November 1 st December 15 th December 3 rd
January Sig. Mean DS
Cassanese 8.77 fA 8.29 eB 6.91 eE 7.73 cC 6.60 cdE 7.12 aD 5.55 aF *** 7.28 1.08
Coratina 11.27 eA 10.34 bcB 8.21 cC 7.59 cE 8.00 bCD *** 9.08 1.62
Frantoio 8.08 hA 7.15 fB 6.66 efC 5.33 eD 4.74 hiE *** 6.39 1.36
Itrana 22.48 aA 18.40 aB 16.72 aC 11.65 aD 8.82 aE *** 15.62 5.43 Leccino 8.19 hA 7.08 fB 5.43 hC 5.11 eD 5.16 fgD *** 6.19 1.38 Nocellara Messinese 6.58 mA 6.47 gB 5.50 hC 5.02 efD 5.33 fC 4.98 cD 4.42 bE *** 5.47 0.80 Nociara 11.67 dA 10.58 bcB 9.59 bC 8.27 bD 6.73 cE 5.69 bF *** 8.76 2.29 Ottobratica 12.21 cA 10.04 dB 7.51 dC 4.71 gD 4.22 lmE 3.37 eF 2.12 dG *** 6.31 3.73 Pendolino 7.18 lA 6.41 gB 5.46 hC 4.78 gD 4.35 lE 4.00 dF *** 5.36 1.24 Picholine 13.49 bA 10.89 bB 9.17 bC 8.34 bD 5.53 eE *** 9.48 2.96 Roggianella 7.79 iA 6.23 hB 5.89 gC 4.31 hD 3.16 nE *** 5.48 1.79 Sinopolese 8.35 gA 6.95 fB 5.23 iCD 5.66 dC 4.82 hE 4.02 dF 2.70 cG *** 5.39 1.86 Sign. *** *** ** ** *** *** ***
This correlation was also found in our results; the AA
values (Table 10) decreased with the decrease of the total
phenolic content. Coratina cv showed the highest initial AA
value according to the total phenolic content and the total
tocopherol content of this cultivar (Table 7). The cultivar
effect showed very highly significant differences between
cultivars (Table 10) even if the AA was high also in the oils
produced during the final part of the productive seasons.
The harvest date had a significant influence (p < 0.05)
on the oil obtained from Coratina cv and a very highly
significant effect (p < 0.001) on all other oils.
CONCLUSION
The purpose of this study was to assess free acidity and
oxidation related parameters in olive oil during fruits
ripening of twelve olive cultivars grown in Calabria (South
Italy). Findings can be used to predict the harvest date to
obtain olive oils with the best chemical characteristics and
to preserve their bioactive molecules. Free acidity increased
significantly during olive ripening whereas in the oil of
many cultivars the peroxide value showed an initial decrease
and a subsequent increase.
K232 presented a tendency to decrease from October
to January whereas K270 presented an inverse trend, in
both cases their values always remained within the legal
parameters for an extra virgin olive oil. Pigments such
as chlorophylls and carotenes decreased constantly with
the harvest date. Bioactive compounds, such as phenols
and tocopherols, were studied and Coratina and Nociara
showed the highest initial content; in all cultivars a constant
decreasing content was found. The resistance to oxidation
measured as oil stability index decreased with harvest date
and at the same time a reduction in the antiradical activity
expressed as DPPH assay was found.
AKNOWLEDGEMENTS
This research was supported by: Distretto ad alta tecnologia
agroindustriale della Calabria AGRIFOODTECH –
PROGETTO PON03PE_00090_2. Sustainable models
and new technologies for olives and olive oil.
REFERENCES
Abenoza, M., J. M. Lasa, M. Benito, R. Oria and A. C. Sánchez-Gimeno. 2015. The evolution of Arbequina olive oil quality during ripening in a commercial super-high density orchard in north-east Spain. Riv. Ital. Sostanze Gr. 92: 83-92.
Alowaiesh, B., Z. Singh and S. G. Kailis. 2016. Harvesting time influences fruit removal force, moisture, oil content, free fatty acids and peroxide in the oil of Frantoio and Manzanilla olive cultivars. Aust. J. Crop Sci. 10: 1662-1668. DOI: 10.21475/ ajcs.2016.10.12.p7737
Asık, H. U. and G. Özkan. 2011. Physical, chemical and antioxidant properties of olive oil extracted from Memecik cultivar. Akademik Gıda. 9: 13-18.
AOAC International Arlington. 1990. AOAC Official Methods of Analysis. 15th ed. AOAC International Arlington, USA.
AOAC. 1997. Method, No Cd-12b92 (Official Methods of Analysis of the Association of Official Analytical Chemists, Reapproved 1997). Method for Analysis of Oil Stability Index.
Baccouri, B., W. Zarrouk, D. Krichene and I. Nouairi. 2007. Influence of fruit ripening and crop yield on chemical properties of virgin olive oils from seven selected oleasters (Olea europea.). J. Agron. 6(3): 388-396.
Boskou, D. 2015. Mediterranean diet food: Strategies to preserve a healthy tradition. J. Exp. Food Chem. 1: 1. DOI: 10.4172/ Table 10: Antioxidant activity (DPPH test) variation in olive oil during fruit ripening. Results are presented as the mean value ± standard deviation. n=3; ***significance at P < 0.001; ** significance at P < 0.01; * significance at P < 0.05. Means in the same column are distinguished by small letters. Means in the same line are distinguished by capital letters
Cultivar 1st October 15 th October 1 st November 15 th November 1 st December 15 th December 3 rd
January Sig. Mean DS
Cassanese 83.12 dA 81.34 eB 79.25 eC 75.15 iD 74.02 iE 73.06 dF 71.11 dG *** 76.72 4.53 Coratina 86.65 aA 85.59 aB 85.33 aBC 84.26 aE 84.81 aD *** 85.33 0.90 Frantoio 81.67 gA 81.20 efB 80.22 dC 78.38 ghD 78.53 fE *** 80.00 1.51 Itrana 82.02 eA 81.16 efB 81.09 cB 80.43 eC 80.45 dC * 81.03 0.65 Leccino 80.07 ilA 79.17 lB 78.87 fC 78.44 gD 77.65 hE *** 78.84 0.89 Nocellara Messinese 81.88 fA 81.05 gB 81.06 cB 80.87 dC 80.64 dCD 80.06 bE 78.54 bF *** 80.59 1.05 Nociara 84.99 bA 84.77 bAB 84.12 bC 83.74 bD 83.21 bE 82.12 aF *** 83.83 1.06 Ottobratica 84.56 bcA 84.17 cAB 84.10 bB 83.46 bcC 82.82 cD 82.15 aE 81.38 aF *** 83.23 1.17 Pendolino 80.22 iA 79.55 iB 79.20 eBC 78.68 gD 78.05 gE 77.77 cF *** 78.91 0.93 Picholine 82.31 eA 81.98 dAB 81.39 cC 80.47 eD 79.50 eE *** 81.13 1.15 Roggianella 81.37 hA 80.27 hB 79.23 eC 79.07 fCD 78.43 fE *** 79.67 1.16
Sinopolese 80.19 iA 79.33 ilB 78.54 gC 78.26 ghCD 78.12 gD 77.55 cE 77.09 cEF *** 78.44 1.05
jefc.1000104.
Bulotta, S., M. Celano, S. M. Lepore, T. Montalcini, A. Pujia and D. Russo. 2014. Beneficial effects of the olive oil phenolic components oleuropein and hydroxytyrosol: Focus on protection against cardiovascular and metabolic diseases. J. Transl. Med. 12: 219. DOI: 10.1186/s12967-014-0219-9.
Cicerale, S., L. J. Lucas and R. S. Keast. 2010. Biological activities of phenolic compounds present in virgin olive oil. Int. J. Mol. Sci. 11: 458-479.
Cicerale, S, L. J. Lucas and R. S. Keast. 2012. Antimicrobial, antioxidant and anti-inflammatory phenolic activities in extra virgin olive oil. Curr. Opin. Biotechnol. 23: 129-135.
COI. 2015. Trade Standard Applying to Olive Oils and Olive-Pomace Oils. COI/T.15/NC No 3/Rev. 9, June.
Conde, C., S. Delrot and H. Gerós. 2008. Physiological, biochemical and molecular changes occurring during olive development and ripening. J. Plant Physiol. 165: 1545-1562. DOI: 10.1016/j. jplph.2008.04.018
Dabbou, S., S. Dabbou, R. Selvaggini, S. Urbani, A. Taticchi, M. Servili and M. Hammami. 2011. Comparison of the chemical composition and the organoleptic profile of virgin olive oil from two wild and two cultivated Tunisian Olea europaea. Chem. Biodivers. 8: 189-202.
D’Angelo, S., C. Manna, V. Migliardi, O. Mazzoni, P. Morrica, G. Capasso, G. Pontoni, P. Galletti and V. Zappia. 2001. Pharmacokinetics and metabolism of hydroxytyrosol, a natural antioxidant from olive oil. Drug Metab. Dispos. 29: 1492-1498. El Sohaimy, A. A. S., H. M. El-Sheikh, M. Taha Refaay and A. M.
M. Zaytoun. 2016. Effect of harvesting in different ripening stages on olive (Olea europea) oil quality. Am. J. Food Technol. 11(1-2): 1-11. DOI: 10.3923/ajft.2016.1.11.
Carluccio, M. A., M. Massaro, E. Scoditti and R. De Caterina. 2007. Vasculoprotective potential of olive oil components. Mol. Nutr. Food Res. 51: 1225-1234. DOI: 10.1002/mnfr.200600305. Desouky, I. M., F. L. Haggag, M. M. M. Abd El-Migged and
E. S. El-Hady. 2010. Change in some physical and chemical fruit properties during fruit development stage of some olive oil cultivars. Am. Eurasian J. Agric. Environ. Sci. 7: 12-17.
Escrich, E., R. Moral, L. Grau, I. Costa and M. Solanas. 2007. Molecular mechanisms of the effects of olive oil and other dietary lipids on cancer. Mol. Nutr. Food Res. 51: 1279-1292. DOI: 10.1002/mnfr.2007002131279.
EU. 2015. Consolidated text. Characteristics of Olive Oil. 1991R2568 - EN - 01.01.2015 -027.001. Annexes II, III, IX.
Fedeli, E. 1977. Lipids of olives. Prog. Chem. Fats Other Lipids. 15: 57.
Fitó, M., R. de la Torre and M. I. Covas. 2007. Olive oil and oxidative stress. Mol. Nutr. Food Res. 51: 1215-1224. DOI: 10.1002/ mnfr.200600308 1215.
García-Martínez, O., E. De Luna-Bertos, J. Ramos-Torrecillas, C. Ruiz, E. Milia, M. L. Lorenzo, B. Jimenez, A. Sánchez-Ortiz and A. Rivas. 2016. Phenolic compounds in extra virgin olive oil stimulate human osteoblastic cell proliferation. PLoS One. 11: e0150045. DOI: 10.1371/journal.pone.0150045.
Giuffrè, A. M., A. Piscopo, V. Sicari and M. Poiana. 2010. The effects of harvesting on phenolic compounds and fatty acids content in virgin olive oil (cv Roggianella). Riv. Ital. Sostanze Gr. 87: 14-23. Giuffrè, A. M. 2012. Steroli, eritrodiolo e uvaolo in olio di oliva da
cultivar coltivate in calabria. Ind. Aliment. Italy. 51: 20-26. Giuffrè, A. M. 2013a. Influence of cultivar and harvest year on
triglyceride composition of olive oils produced in Calabria (Southern Italy). Eur. J. Lipid Sci. Technol. 115: 928-934.
DOI: 10.1002/ejlt.201200390.
Giuffrè, A. M. 2013b. Influence of harvest year and cultivar on wax composition of olive oils. Eur. J. Lipid Sc. Technol. 115: 549-555. DOI: 10.1002/ejlt.201200235.
Giuffrè, A. M. 2013c. Alcoli alifatici e terpenici in olio di oliva estratto da cultivar coltivate in Calabria. Ind. Aliment. Italy 52: 28-35. Giuffrè, A. M. and L. Louadj. 2013. Influence of crop season and
cultivar on sterol composition of monovarietal olive oils in Reggio Calabria (Italy). Czech J. Food Sci. 31: 256-263.
Giuffrè, A. M. 2014a. The effects of cultivar and harvest year on fatty alcohol composition of olive oils from South West Calabria (Italy), Grasas Aceites. 65: e011. DOI: 10.3989/gya.073913. Giuffrè, A. M., L. Louadj, M. Poiana and A. Macario. 2012. Composition
en sterols des huiles extraites d’olives de cultivars de la province de Reggio Calabria (Sud d’Italie). Riv. Ital. Sostanze Gr. 89: 177 183.
Giuffrè, A. M. 2014b. Wax Ester variation in olive oils produced in Calabria (Southern Italy) during olive ripening. J. Am. Oil Chem. Soc. 91: 1355-1366. DOI: 10.1007/s11746-014-2476-4. Giuffrè, A. M. 2014c. Evolution of fatty alcohols in olive oils produced
in Calabria (Southern Italy) during fruit ripening. J. Oleo Sci. 63: 485-496. DOI: 10.5650/jos.ess13212.
Giuffrè, A. M. 2014d. Variation in triacylglycerols of olive oils produced in Calabria (Southern Italy) during olive ripening. Riv. Ital. Sostanze Gr. 91: 221-240.
Giuffrè A. M. 2017. Biometric evaluation of twelve olive cultivars under rainfed conditions in the region of Calabria, South Italy. Emir. J. Food Agric. 29: 696-709. DOI: 10.9755/ejfa.2017.v29.i9.110. Giuffrè A. M., M. Capocasale and C. Zappia. 2017. Tomato seed oil
for edible use: Cold break, hot break, and harvest year effects. J. Food Process. Pres. 41: e13309. DOI: 10.1111/jfpp.13309. Goldsmith, C. D., C. E. Stathopoulos, J. B. Golding and P. D. Roach.
2014. Fate of the phenolic compounds during olive oil production with the traditional press method. Int. Food Res. J. 21: 101-109. Gutierrez, F., B. Jimenez, A. Ruiz, M. A. Albi. 1999. Effect of olive
ripeness on the oxidative stability of virgin olive oil extracted from the varieties Picual and Hojiblanca and on the different components involved. J. Agric. Food Chem. 47: 121-127. Huang, L. C., B. E. Sumpio. 2008. Olive oil, the Mediterranean diet,
and cardiovascular health. J. Am. Coll. Surg. 207: 407-416. DOI: 10.1016/j.jamcollsurg.2008.02.018.
Humeid, M. A., H. R. H. Takruri, R. F. Daqqaq. 1992. Effect of ripening of “Nabali” olives on the yield and some chemical properties of extracted oil. Emir. J. Agric. Sci. 4: 53-66.
IUPAC. 1987. International union of pure and applied chemistry. Determination of Tocopherol and Tocotrienols in Vegetable Oils and Fats by HPLC: Method 2.432. In: Paquot, C., and A. Haufenne (Eds.), Standard Methods for the Analysis of Oils, Fats and Derivatives. Blackwell Scientific Publications, Oxford. pp. 2432/1-2432/7.
Kalantzakis, G., G. Blekas, K. Pegklidou and D. Boskou. 2006. Stability and radical-scavenging activity of heated olive oil and other vegetable oils. Eur. J. Lipid Sc. Technol. 108: 329-335. DOI: 10.1002/ejlt.20.
Laila Haggag, F., M. F. M. Shahin, E. A. E. Genaidy and A. A. Fouad. 2013. Changes in fruit weight, dry matter, moisture content and oil percentage during fruit development stages of two olive cultivars. Middle East J. Agric. Res. 2: 21-27.
Lavee, S. and M. Wodner. 2004. The effect of yield, harvest time and fruit size on the oil content in fruits of irrigated olive trees (Olea europaea), cvs. Barnea and Manzanillo. Sci. Hortic. 99: 267 277.
Minguez-Mosquera, M. I., L. Rejano, B. Gandul, A. H. Sanchez, J. Garrido, 1991. Color-pigment correlation in virgin olive oil. J. Am. Oil Chem. 68: 332-336.
Sakouhi, F., S. Harrabi, C. Absalon, K. Sbei, S. Boukhchina and H. Kallel. α-Tocopherol and fatty acids contents of some Tunisian table olives (Olea europea L.): Changes in their composition during ripening and processing. Food Chem. 108: 833-839. DOI: 10.1016/j.foodchem.2007.11.043.
Sánchez, C. S., A. M. Troncoso González, M. C. García-Parrilla, J. J. Quesada Granados, H. López García de la Serrana and M. C. López Martíne. 2007. Different radical scavenging tests in virgin olive oil and their relation to the total phenol content. Anal. Chim. Acta. 593: 103-107. DOI: 10.1016/j.aca.2007.04.037.
Servili, M. and G. Montedoro. 2002. Contribution of phenolic compounds to virgin olive oil quality. Eur. J. Lipid Sci. Technol. 104: 602-613. Sicari, V., A. M. Giuffrè, A. Piscopo and M. Poiana. 2009. Effect of the
“Ottobratica” variety ripening stage on the phenolic profile of the obtained olive oil. Riv. Ital. Sostanze Gr. 86: 215-219.
Sicari, V. 2017. Antioxidant potential of extra virgin olive oils extracted from three different varieties cultivated in the Italian province of Reggio Calabria. J. Appl. Bot. Food Qual. 90: 76-82.
Soni, M. G., G. A. Burdock, M. S. Christian, C. M. Bitler and R. Crea. 2006. Safety assessment of aqueous olive pulp extract as an antioxidant or antimicrobial agent in foods. Food Chem. Toxicol. 44: 903-915.
Tripoli, E., M. Giammanco, G. Tabacchi, D. Di Majo, S. Giammanco and M. La Guardia. 2005. The phenolic compounds of olive oil: Structure, biological activity and beneficial effects on human health. Nutr. Res. Rev. 18: 98-112. DOI: 10.1079/NRR200495. Viola, P. and M. Viola. 2009. Virgin olive oil as a fundamental nutritional
component and skin protector. Clin. Dermatol. 27: 159-165. DOI: 10.1016/j.clindermatol.2008.01.008.