Abstract. – OBJECTIVE: The availability of a low dose radiation technology such as Cone Beam Computed Tomography (CBCT) in dental practice has increased the number of scans avail-able for forensic purposes. Moreover, specific software allows for three-dimensional (3D) char-acterization of the maxillary sinuses. This study was performed to determine whether sinus max-illary volumes can be useful to identify gender after validating the use of the Dolphin software as a tool for volumetric estimation of maxillary sinus volumes.
PATIENTS AND METHODS: The validation was performed by four different operators mea-suring the volume of six phantoms, where the real volume was already known. The maxillary sinus volumes of 52 patients (26 males and 26 females) mean age 24.3 were calculated and compared between genders and sagittal skele-tal class subdivision. The measurements for patients and phantoms were based on CBCT scans (ILUMA™) processed by Dolphin 3D software.
RESULTS: No statistical difference was ob-served between the real volume and the vol-ume measurements performed by the opera-tors. No statistical difference was found in pa-tient’s maxillary sinus volumes between gen-der.
CONCLUSIONS: Based on our results, it is not possible to support the use of maxillary si-nuses to discern sexual difference in corpse identification.
Gender assessment through three-dimensional
analysis of maxillary sinuses by means of
Cone Beam Computed Tomography
M. SACCUCCI, F. CIPRIANI
1, S. CARDERI
2, G. DI CARLO
3, M. D’ATTILIO
4,
D. RODOLFINO
5, F. FESTA
7, A. POLIMENI
6Department of Oral and Maxillofacial Science, Sapienza University of Rome, Rome, Italy
1Department of Medical, Oral and Biotechnological Sciences, University G. D’Annunzio,
Chieti/Pescara, Italy
2Department of Medical, Oral and Biotechnological Sciences, University G. D’Annunzio,
Chieti/Pescara, Italy
3Department of Oral and Maxillofacial Science Sapienza University of Rome, Rome, Italy 4Department of Medical, Oral and Biotechnological Sciences, University G. D’Annunzio,
Chieti/Pescara, Italy
5Department of Medical, Oral and Biotechnological Sciences, University G. D’Annunzio,
Chieti/Pescara, Italy
6Department of Oral and Maxillofacial Science Sapienza University of Rome, Rome, Italy 7Department of Medical, Oral and Biotechnological Sciences, University G. D’Annunzio,
Chieti/Pescara, Italy
Key Words:
Forensic anthropology, Cone beam computed to-mography, Three dimensional imaging.
Introduction
Recently, judicial demand for gender identifica-tion has increased because of an increase in crimi-nal cases involving young people, irregular immi-gration and modern crimes. Gender identification is a classic procedure in forensic medicine as sex assessment constitutes an important step in con-structing a post-mortem profile. It is also useful in identifying skeletal remains as it is not uncommon to recover only partial remains. Common post-mortem forensic procedures for identification, in-cluding general external examination, radiographs and complementary biological methods, are some-times insufficient. Thus, forensic medicine would benefit from new identification methods that com-bine simplified procedures, lower costs and espe-cially, maximum accuracy. The primary goal when performing the identification of corpses is to com-pare ante-mortem and post-mortem records1,2. In
fact, massive post-mortem changes could compli-cate identification3. According to the literature, the
skull, the pelvis and long bones with an epiphysis and a metaphysis in skeletons have been used to
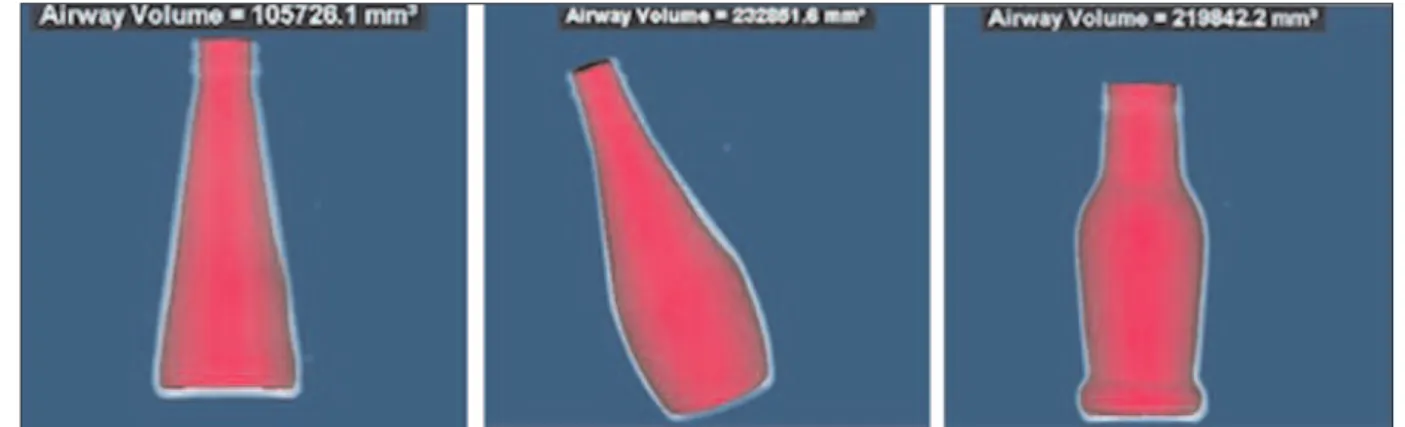
Figure 1. Known-volume phantoms.
boundaries of soft tissues and empty spaces (air). Concerning these advantages, CBCT technology became the elective tool in Orthodontics and Maxillofacial surgery when three-dimensional analysis was required. It is now easier to get a CBCT full skull report instead CT or MRI of or-thodontics patients. Most CT studies only deter-mined the linear metric variables of the maxillary sinus for forensic purposes. Conversely, a valid protocol for 3D volume assessment is still re-quired8,12. The main obstacle is still the lack of
information on the influence of human error on instrumentation, which could cause measure-ments to deviate from their actual values13.
More-over, only a few studies have tested volumetric analysis techniques with a phantom model14,15.
For these reasons, validation studies to define the experimental uncertainty are decisive in the esti-mation of volumetric analysis techniques13. The
aim of our study is to validate the use of Dolphin Imaging software to analyze CBCT images as a tool for volumetric estimation of maxillary sinus volumes and to test the intra- and inter-examiner reproducibility of this technique. In addition, we determine whether sinus maxillary volumes can be useful as a means to identify the sex of un-known persons.
Materials and Methods
A validation of the method with well-charac-terized phantoms was conducted to test the ex-perimental procedure in advance.
To evaluate software reliability, we used six known-volume phantoms replicating the geomet-rically complex anatomy of the maxillary sinuses (Figure 1):
determine gender. Moreover, it has been reported that maxillary sinuses maintain their anatomical shape and structure intact following fire acci-dents although the skull and other bones may be badly disfigured1. In this respect, the maxillary
sinuses have been proposed for corpse identifica-tion4. The maxillary sinus is a triangular pyramid
in the body of the maxilla. It presents three re-cesses: an alveolar recess pointed inferiorly, bounded by the alveolar process of the maxilla; a zygomatic recess pointed laterally, delimited by the zygomatic bone, and an infraorbital recess pointed superiorly, bounded by the inferior or-bital surface of the maxilla. The size of sinuses varies in different skulls, and even on the two sides of the same skull. To measure the internal dimension of the maxillary sinus has proven to be a challenge for researchers5. Considering the
complex structure of maxillary sinuses, magnetic resonance imaging (MRI) and x-ray computed tomography (CT) are the gold standard methods to depict the true anatomy of the Highmore’s antrum. Nevertheless, their use is limited by high dose, cost, or restricted accessibility6,7. These
drawbacks were overcome with the introduction of cone-beam computed tomography (CBCT)6,7.
Using CBCT technology, measurements of the maxillary sinus volume and the quantification of craniofacial structures are now available that re-duce radiation dose compared with CT scans as well as reduced costs compared with MRI. CBCT data sets allow the possibility of a realistic representation of the head of the patient and has expanded diagnostic possibilities, enabling three-dimensional (3D) simulation of surgical and or-thodontic procedures. In addition, since its intro-duction in 1998, CBCT technology has also been improved in terms of accuracy in identifying the
proper bone density range (1350-1650 gray scale range) and then graphically isolated prior to 3D and volumetric measurements15.
Segmentation Procedure
The obtained CT data were analyzed with Dol-phin Imaging software (DolDol-phin Imaging and Management solution, USA). The raw data sets, in DICOM format, were imported in the program 3D Dolphin Imaging. To segment the data cor-rectly, a calibration of the software should be performed following the procedure described be-low:
1.The type of tissue should be set: Hard (hard tissues), Soft (soft tissue), or Soft + Hard tis-sues (both), depending on the volume import-ed and of which part you want to examine. 2.Radiological artifacts were eliminated, as well
as any excess in the volumetric reconstruction; thus a precise portion to be examined were de-limited.
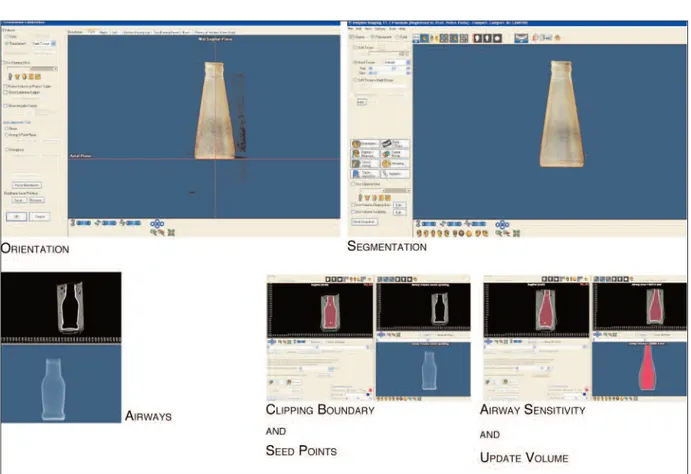
3.Reorientation of the volume in the three spa-tial planes was applied, correcting any errors in the positioning of the skull (or phantom) during the CT scan, or simply orienting it in a desired position (see Figure 2).
4.The Sinus/Airway tool function of Dolphin was set as follows (see Figure 2):
• Step 1: “clipping boundary and seed points”, where the airway structure has been identified selecting boundary points (seed points) in the coronal, axial and sagittal planes.
• Step 2: “slice airway sensitivity”, where the sensitivity of the virtual sensor was applied to discriminate airspace. In this study, the “sen-sitivity tool” was set to a value of 85/100. • Step 3: “Update volume”, where selecting
this option the volume was calculated. Measurements
All examiners were trained to use the above standardized study procedure and software tools. They performed phantom measurements in a dark room independently from each other and were blind to previous readings. Each measure-ment cycle was performed three times with an in-terval of 2 weeks between sessions to minimize personal memory effects. All segmentations were evaluated in random order by (A1) one graduate dental student (A2), one well experienced radiol-ogist (A3), one well experienced oral surgeon (A4) and one associate professor of Orthodon-tics. Each phantom was evaluated four times by • Three empty glass containers dipped inside a
cylinder of alginate; (Palgat™ Plus 3M Espe, Germany).
• Three empty glass containers dipped inside a cylinder of alginate and partially filled with al-ginate (Palgat™ Plus 3M Espe, Germany). These custom-made phantoms with known vol-umes were used as the gold standard, and their volume was confirmed by using the water weight equivalent. The volume of the glass containers was calculated by filling them completely with dis-tilled water (1 atm at 20°C). Water weight was de-termined by using a digital scientific scale (Giber-tini TM560, Max 560 g d = 0.01 g). The precision scale was first calibrated by measuring the empty containers. The weight of the distilled water (cal-culated in grams) was converted in volume (calcu-lated in mm3) using a specific conversion table.
Therefore, we dipped the containers inside a cylin-der made of alginate to mimic the soft tissue atten-uation of x-rays. Additionally, the 3D scans of 104 maxillary sinuses of a 52 Caucasian adults (mean age 24.3 ± 6.5 years, 26 females and 26 males) was retrospectively examined. All subjects had re-ceived a cone beam evaluation of the stomatognat-ic apparatus for the following reasons: (1) teeth extraction, such as wisdom teeth; (2) orthodontic evaluation of unerupted teeth; (3) the study of cephalometric aspects (lateral and postero-anteri-or), and (4) a dental implant. The exclusion crite-ria included history of paranasal sinus surgery and maxillofacial trauma, subjects with upper airway pathology, such as clinical sinusitis, and/or cysts of the maxillary sinus and odontogenic cysts. A cephalometric study was conducted on lateral cephalograms obtained from the volumetric 3D data. Subsequently, patients were divided accord-ing to Angle’s skeletal classifications. SNA, SNB, and ANB angles and AoBo distance has been used to assign patients to the appropriate skeletal groups: Skeletal class I (0° < ANB < 4°); Skeletal class II (ANB > 4°), and Skeletal class III (ANB < 0°). Patients and phantoms were scanned with ILUMA™ Cone beam volumetric tomography (IMTEC, 3 M Company, Ardmore, OK, USA), with a reconstructed layer thickness of 0.3 mm and a 512 × 512 pixel matrix. The device was op-erated at 120 kVp and 3-8 mA by using a high fre-quency generator with a fixed anode and a 0.5 mm focal spot. A single 40-s high-resolution scan was made of each skull. The voxel size was set at 0.25 mm, and the images were exported as DICOM files. Each maxillary sinus was visualized in the
the single operators. The error of the method of the maxillary sinuses analysis was then calculat-ed. One operator performed 30 double
measure-ments with an interval period of 30 days. Finally, all measurements on maxillary sinus volumes were assessed (see Figure 3).
Figure 2. Segmentation procedure.
Data Analysis
Data were analyzed on a personal computer us-ing Excel 2000 (Microsoft Corporation, Redmond, WA, USA) and SPSS 14.0 (SPSS Inc., Chicago, IL, USA) on a Microsoft Windows XP platform.
To assess the repeatability of multiple mea-surements for each Operator, and to compare the measurements among Operators, RM ANOVA was applied16.
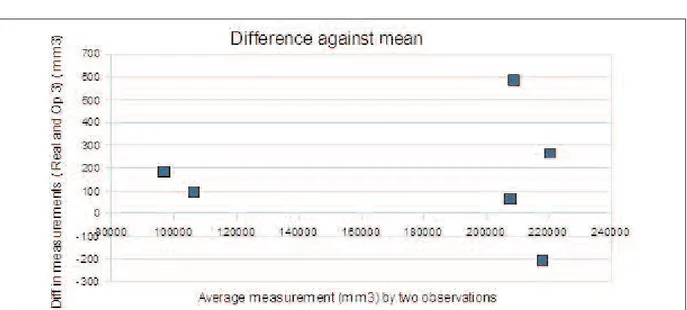
The Correlation Coefficient (Pearson Product-Moment Correlation Coefficient, r) was calculat-ed to describe the strength of the association be-tween the real and Operator measurements. Each pair of data were plotted and a line of equality was plotted. Additionally, the method described by Bland and Altman was applied to assess the agreement between target measurements and those of each Operator16. The most
straightfor-ward measure of disagreement between the two observations is simply the difference between the real measurements and those of each Operator; the mean difference (d) is a measure of the bias and the standard deviation (s) is a measure of the variation between the two observations. The dif-ference against the mean between the target and Operator measurements was plotted.
To analyze the error of the method, a non-parametric Kolmogorov-Smirnov test (KS test) and a parametric test (t-test) were performed. Be-fore running the t-test, the normality hypothesis and the equal variance hypothesis were tested. The Student’s t test was applied to compare right and left sinuses in the skeletal classes’ groups.
RM ANOVA was applied, independently from the skeletal groups division, to compare between them: (1) all the sinuses’ volumes, (2) all the
right sinus volumes, (3) all the left sinuses vol-umes. A Mann-Whitney Sum rank test was ap-plied to investigate the differences between male and female sinus volumes.
Results
The RM ANOVA results demonstrated the re-peatability of the measurement for each Opera-tor, confirming that the variability among obser-vations isn’t statistically significant. No statisti-cally significant differences were observed among Operators, confirming the reliability of the method, independently from the Operator (Table I).
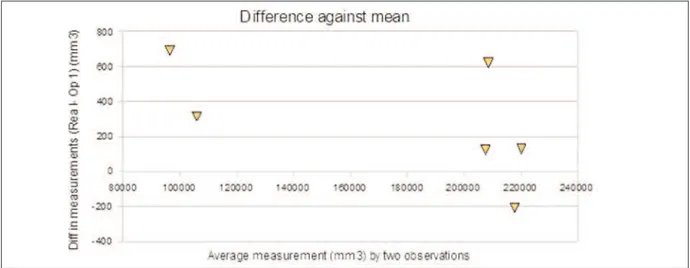
The Correlation Coefficient (Pearson Product-Moment Correlation Coefficient, r) demonstrated a strength association between real measurement and that of each Operator (r = 1). The plot of the difference against the mean between the target measurements and the measurements of each Op-erator is shown in Figures 4 to 7.
Real measurements p= 0.2 Operator 1 measurements p= 0.3 Operator 2 measurements p= 0.2 Operator 3 measurements p= 0.8 Operator 4 measurements p= 0.08 Operators 1, 2, 3, 4 p= 0.1
Table I. RM Anova results: comparisons among multiple measurements for each Operator and among Operators.
Statistical significance (p = 0.05) of comparisons among multiple measurements for each Operator and among Oper-ators (RM Anova).
The mean difference (d) between the real ob-servations and Operator 1 data, 277.56 mm3, and the standard deviation (s), 338.39 mm3, are small
compared with the values of volume observed (which range up to 220332.75 mm3). The
agree-ments limits are −399.22 mm3 and 954.34 mm3.
As shown in Figure 4, there is an agreement with a discrepancy only up to 691.31 mm3.
The Correlation Coefficient between the real measurement and that of Operator 1 (r = 1) con-firms a direct relationship between variables.
The mean difference (d) between the real ob-servations and Operator 2 data, −193.38 mm3,
and the standard deviation (s), 344.67 mm3, are
small compared with the values of volume
ob-served (which range up to 220332.75 mm3). The
agreements limits are −495.21 mm3 and 882.72
mm3. As shown in Figure 5, there is an
agree-ment with discrepancies only up to 678.5 mm3.
The Correlation Coefficient between the real measurement and that of Operator 2 (r = 1) con-firms a direct relationship between variables.
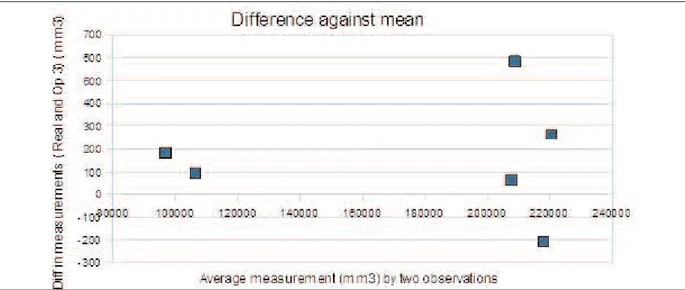
The mean difference (d) between the real ob-servations and Operator 3 data, 163.81 mm3 and standard deviation (s), 261.51 mm3, are relatively
small compared with the values of volumes ob-served (which range up to 220332.75 mm3). The
agreements limits are −359.21 mm3 and 686.83
mm3. As shown in Figure 6, there is agreement
with discrepancies only up to 586.75 mm3. The
Figure 5. Plot of the difference against the mean between the target measurements and the measurements of Operator 2.
Correlation Coefficient between the real mea-surement and that of Operator 3 (r = 1) confirm that a direct relationship between variables.
The mean difference (d) between the real obser-vations and the Operator 4 data, 108.04 mm3 and the standard deviation (s), 224.44 mm3, are small
compared with the values of volume observed (which range up to 220332.75 mm3). The
agree-ments limits are −340.84 mm3and 552.92 mm3. As
shown in Figure 7, there is a discrete agreement with discrepancies only up to 474 mm3.
The Correlation Coefficient between the real measurement and that of Operator 4 (r = 1) con-firm a direct relationship between variables.
The KS and t-tests show that the differences be-tween the two sets of measurements are not statis-tically significant. According to the KS test, the two sets of measures follow the same distribution. According to the Shapiro-Wilk test the two sets of measurements can be considered as normally dis-tributed. According to the F test, the hypothesis of equal variance in the two sets of measurements is accepted, so in the following t-test the Welch
ap-proximation to the degrees of freedom is not nec-essary. According to the t-test on paired samples, the null hypothesis that the two sets of measures have the same mean is accepted (Table II). Com-paring right and left sinus volumes for each Skele-tal Class, no statistical differences were observed, with p = 0.3 (First Class), p = 0.7 (Second Class), and p = 0.8 (Third Class). Comparing all sinuses’ volumes without any subdivision for Skeletal Class, no statistical difference was observed (p = 0.2). Similarly, no statistical difference was ob-served when right and left sinus volumes were taken into account (Table III). Comparing the vol-umes of all male and female subjects, without any subdivision for Skeletal Class, no statistical differ-ence was observed (p = 0.1).
Discussion
The first stage of the current study assessed re-peatability and accuracy of 3D measurements de-livered by Dolphin software. The RM ANOVA Figure 7. Plot of the difference against the mean between the target measurements and the measurements of Operator 4.
Error of the method SW KS F test t-test
Volume I W = 0.9594 D = 0.0857 F = 1.0385 t= -0.2709 pvalue = 0.2188 pvalue = 0.997 pvalue = 0.9129 pvalue = 0.7881 Volume II W = 0.9608
pvalue = 0.2418
Table II. Difference test on two sets of measures of sinus volumes.
SW Shapiro-Wilk test on normality; (KS) Kolmogorov-Smirnov test; (F test) F test to compare two variances; (T test) T test on equal means.
results (Table I) demonstrate the repeatability of the measurements for each operator, confirming that the variability of the measurements between the various observations is not statistically signif-icant. In addition, no statistically significant dif-ference was observed between the data of four operators, confirming the reliability of the mea-surement method, independently of the observer (Table I). The correlation coefficient (r) showed a strong association between the real and observed measurements of each operator (r = 1), demon-strating the reliability of the software to identify and measure the volume of different phantoms. For the second part of the study, the reliability of the operator who performed the measurements was tested, assessing the correlation between two different measurements performed at an interval of 30 days. The statistical analysis showed the existence of a strong correlation between the first and second set of measurements. Regarding the correlation between the volumes of 104 maxil-lary sinus and the three skeletal classes, the t-test (Table III) indicated a lack of correlation be-tween right and left maxillary sinus size, in each skeletal class, taken individually. The ANOVA test (Table III) shows:
1.The absence of a default size of the maxillary sinuses, in different skeletal classes, and inside each of them, and
2.The absence of correlation between the volu-metric dimensions of the paranasal maxillary spaces and the three different skeletal types. The “Sinus/Airway” volume measurement tool was then proved to be a valid and reliable instru-ment in the measureinstru-ment of the upper airway. The setting of the sensitivity (slice airway sensi-tivity), the identification and design of aries of the sample examined (clipping bound-ary) are fundamental to allow a reliable measure-ment (with a relative error < 0.4%). According to Alves et al15, there is no established protocol for
the threshold that should be used when airway volume is measured with Dolphin 3D software. Although manual thresholding is more time con-suming and might generate errors if not correctly applied, it has been shown to be more repro-ducible when compared with the automatic tech-nique. Indeed, El Palomo17, making a comparison
between three automatic procedures and a manu-al segmentation technique, stated that the latter was the method with the greatest accuracy and allows the greatest operator control. In attempt-ing to establish a standardized method for usattempt-ing the maxillary sinus, our results show no differ-ence in maxillary sinus volumes between male and female subjects. These data reject the hy-pothesis that maxillary sinus morphology is cru-cial to determine gender. Conversely, Uthman et al8 concluded that reconstructed CT images can
be used for sexing. Amin et al18detected in a CT
study that size of the left maxillary sinus are a useful feature in gender determination although only related to Egyptians population. These pre-vious studies focused upon taking linear mea-surements of the sinus using a 2D analysis, but were considered suitable for 3D characterization. The reproducibility of linear measurements is questionable when a convex shape is chosen to point out a landmark used for measurements19,20.
On the contrary, volumetric analysis of maxillary sinuses is independent from bias regarding point identification. Our study is conducted using CBCT datasets. Currently, the technical features of CBCT scans as well as the reduced cost com-pared with CT scans increased their use in hospi-tals and dentistry. This will enhance the availabil-ity of CBCT scans in cases requiring personal identification. The independence of maxillary si-nuses sizes between male and female subjects has been elucidated by the current study, which seems to refute the possibility of performing gender iden-tification using maxillary sinuses as suggested in previous research. Besides, taking into account dif-ferent sagittal skeletal patterns as Angle’s classifi-I Class right vs left II Class right vs left III Class right vs left
ttest p = 0.05 0.3 0.7 0.8
I-II-III Class I-II-III Class right I-II-III Class left
ANOVA p = 0.05 0.2 0.3 0.1
Table III. t-test between right and left sinuses volumes (mm3) for each Skeletal Class; ANOVA results for maxillary sinuses
cation the independence between maxillary sinus dimensions is unchanged. This shows how the maxilla and jaw positions are independent with re-spect to the maxillary sinus size.
Conclusions
In conclusion, forensic investigations would benefit from gaining more precise indications via the use of digital radiology, and in particular CBCT, exams and modern software for recon-structing 3D virtual models. The ability to per-form 3D measurements appears to be much more accurate compared with linear measurements, and reduces bias on intra-observer reproducibili-ty due to higher accuracy of the image investigat-ed. This approach appears to be a promising di-rection for further research on all possible anatomical characteristics that may differentiate individual groups, which may prove useful for forensic investigation on human identification. –––––––––––––––––-––––
Conflict of Interest
The Authors declare that there are no conflicts of interest.
References
1) CAMERIERER, FERRANTEL, MIRTELLAD, ROLLOUF, CIN -GOLANIM. Frontal sinuses for identification: quality
of classifications, possible error and potential cor-rections. J Forensic Sci 2005; 50: 1-4.
2) QUATREHOMME G, FRONTYP, SAPANET M, GREVIN G, BAILETP, OLIERA. Identification by frontal sinus pat-tern in forensic anthropology. Forensic Sci Int 1996; 83: 147-153.
3) RIEPERTT, ULMCKED, SCHWEDENF, NAFEB. Identifica-tion of unknown dead bodies by X-ray image comparison of the skull using the X-ray simulaton program FoXSIS. Forensic Sci Int 2001; 11: 789-798.
4) LERNO P. Identification par le sinus maxillaire.
Odontol Leg 1983; 216: 39-40.
5) KIRMEIER R, ARNETZL C, ROBL T, PAYER M, LORENZONI
M, JAKSEN. Reproducibility of volumetric measure-ments on maxillary sinuses. Int J Oral Maxillofac Surg 2011; 40: 195-199.
6) SCHWABRJ. Upper airway imaging. Clin Chest Med
1998; 19: 33-54.
7) LENZAMG, LENZA MM, DALSTRAM, MELSENB, CATTA
-NEO PM. An analysis of different approaches to
the assessment of upper airway morphology: a CBCT study. Orthod Craniofac Res 2010; 13: 96-105.
8) UTHMAN AT, AL-RAWI NH, AL-NAAIMIAS, AL-TIMIMI JF.
Evaluation of maxillary sinus dimension in gender determination using helical CT scanning. J Foren-sic Sci 2011; 56: 403-408.
9) ARIJIY, KUROKIT, MORIGUCHIS, ARIJIE, KANDAS. Age changes in the volume of the human maxillary si-nus: a study using computed tomography. Den-tomaxillofac Radiol 1994; 23: 163-168.
10) BARGHOUTH G, PRIOR JO, LEPORI D, DUVOISIN B, SCHNYDERP, GUDINCHETF. Paranasal sinuses in chil-dren: size evaluation of maxillary, sphenoid and frontal sinuses by magnetic resonance imaging and proposal of volume index percentile curves. Eur Radiol 2002; 12: 1451-1458.
11) JUN BC, SONG SW, PARKCS, LEE DH, CHOKJ, CHO
JH. The analysis of maxillary sinus aeration ac-cording to aging process; volume assessment by 3-dimensional reconstruction by high-resolutional CT scanning. Otolaryngol Head Neck Surg 2005; 132: 429-434.
12) KAWARAIY, FUKUSHIMAK, OGAWAT, NISHIZAKI K, GUN -DUZ M, FUJIMOTO M, MASUDAY. Volume
quantifica-tion of healthy paranasal cavity by three-dimen-sional CT imaging. Acta Otolaryngol 1999; 540: 45-49.
13) RUBIN GD, NAPELS, LEUNGAN. Volumetric analysis of volumetric data: achieving a paradigm shift. Ra-diology 1996; 200: 312-317.
14) WEISSHEIMER A, DEMENEZES LM, SAMESHIMA GT, EN
-CISOR, PHAMJ, GRAUERD. Imaging software accu-racy for 3-dimensional analysis of the upper air-way. Am J Orthod 2012; 142: 801-813.
15) ALVES M JR, BARATIERI C, MATTOS CT, BRUNETTO D, FONTESRDAC, SANTOSJR, RUELLASAC. Is the airway volume being correctly analyzed? Am J Orthod Dentofacial Orthop 2012; 141: 657-661.
16) STANTON A, GLANTZ S. Primer of biostatics.
Mc-Graw-Hill 5th edition, 2005; pp. 132-138.
17) ELH, PALOMO JM. Measuring the airway in 3 di-mensions: a reliability and accuracy study. Am J Orthod Dentofacial Orthop 2010; 137(4 Suppl): 50-59.
18) AMINMF, HASSANEL. Sex identification in Egyptian population using Multidetector Computed Tomog-raphy of the maxillary sinus. J Forensic Leg Med 2012; 19: 65-69.
19) SACCUCCIM, POLIMENIA, FESTAF, TECCOS. Do skele-tal cephalometric characteristics correlate with condylar volume, surface and shape? A 3D analy-sis. Head Face Med 2012; 15: 8-15.
20) SACCUCCI M, D’ATTILIO M, RODOLFINO D, POLIMENIA,
FESTA F, TECCO S. Condylar volume and condylar
area in class I, class II and class III young adult subjects. Head Face Med 2012; 14: 1-8.