UNIVERSITÀ DEGLI STUDI DI FOGGIA
DIPARTIMENTO DI SCIENZE AGRARIE, DEGLI ALIMENTI E
DELL'AMBIENTE
D
OTTORATO DIR
ICERCA IN“B
IOTECNOLOGIE DEI PRODOTTI ALIMENTARI”
(XXVIII
CICLO)
C
OORDINATORE:
PROF.
M
ATTEOA
LESSANDROD
ELN
OBILETESI DI DOTTORATO
Genetic fingerprinting and potential grape quality
of old Vitis vinifera genotypes
Dottorando: De Michele Maria
Tutor: prof.ssa de Palma Laura
Co-tutor: prof.ssa Lotti Concetta
2
1. CHAPTER: INTRODUCTION ... 4
1.1. Importance of identification, recovery and valorization of Vitis germplasm ... 4
1.2. Identification and characterization of the grapevine genotypes ... 7
1.3. The evaluation of grape oenological potential ... 10
References Chapter 1 ... 15
2. CHARTER: RESEARCH OBJECTIVES AND METHODOLOGIES... 19
2.1. Research objectives ... 19
2.1.1. The search path ... 20
2.2. Material and methods ... 20
2.2.1. Plant material ... 20
2.2.2. Analysis of genetic profile ... 21
2.2.2.1. DNA extraction ... 22
CTAB method ... 22
DNA extraction with DNeasy Plant mini kit ... 23
2.2.2.2. DNA quantification ... 24
2.2.2.3. DNA purification ... 25
2.2.2.4. SSR analyses ... 25
SSR choice ... 25
PCR analysis ... 27
Electrophoretic analysis of amplified products ... 28
Allele sizing ... 28
2.2.2.5. Genetic profile comparison ... 29
2.2.3. Qualitative characteristics of the grapes ... 30
2.2.3.1. Technological parameters ... 30
2.2.3.2 Indices of phenol compound content ... 30
3
Total polyphenol assay ... 32
Total anthocyanin and flavonoid assay ... 33
Total proantocyanidin assay... 34
Flavan reacting with vanillin assay ... 34
Statistical analysis ... 35
2.2.4. Entering data in the Italian Vitis Database... 35
References 2° Chapter ... 40
3. CHAPTER: RESULTS AND DISCUSSION ... 41
3.1 Analysis of Genetic profile ... 41
3.1.1. DNA extracted ... 41
3.1.2. Analysis of the amplified products ... 42
3.1.3. Analysis of microsatellite loci... 45
3.2. Qualitative characteristics of the grapes ... 49
3.2.1. Technological parameters ... 49
3.2.1.1. Technological parameters evaluated for the black-berry accessions of Monti Dauni and Gargano area ... 49
3.2.1.2. Technological parameters evaluated for the white-berry accessions of Gargano area ... 51
3.2.1.3. Technological parameters evaluated for the accessions of Alto Tavoliere area ... 53
3.2.2. Indices of the total content of the main phenol compounds ... 54
3.2.2.1. Indices of the total content of the main skin phenol compounds of Monti Dauni area ... 54
3.2.2.2. Indices of the total content of the main skin phenol compounds of Gargano area ... 55
Black-berry accessions ... 55
4 3.2.2.2. Indices of the total content of the main skin phenol compounds of Alto Tavoliere area ... 60 3.2.2.3. Hydroxycinnamyl tartaric acids content in the pulp of black-berry and withe-berry accessions of Monti Dauni and Gargano area ... 62 3.2.2.4. Hydroxycinnamyl tartaric acids content in the pulp of with-berry accessions of Alto Tavoliere area ... 63 References 3° Chapter ... 74 4. CHAPTER: FINAL REMAKS ... 76
5
1. CHAPTER: INTRODUCTION
1.1. Importance of identification, recovery and valorization of Vitis germplasm
Viticulture and enological industry have a relevant importance in Italy. In the year 2014, the national wine production was 41 million hl, that is, +3% than the average production of the last five years. Considering just wines, musts excluded, the Apulia is the third main producing Italian region (5.6 thousands hl), after Veneto and Emilia Romagna (http://www.inumeridelvino.it/2015/04/ produzione-di-vino-in-italia-aggiornamento-2014-stat.html). The Daunia area, that is, the Foggia province, in Northern Apulia, has a considerable relevance: with 27,000 ha devote to viticulture and more that 2 millions hl of wine, it is the main Apulian viticultural area in terms of surface and production. It is also very important at a national level, since it normally occupies the fifth position among all the Italian provinces that produce musts and wines.Viticulture is one of the most ancient agricultural activities and has been practiced for thousands of years. The grapevine varieties presently grown derive from domestication, from crosses between cultivated varieties and from crosses between domesticated grapevines and cultivated varieties most of which now are disappeared. After many multiplications, any genotype is prone to produce and fix some genetic mutations, generating several “variants” of the initial genotype. Virgilio, in the
Georgiche wrote that it was not possible to know how many grapevine varieties exist, since they are
as numerous as the grains of sand raised by the Zephyrus wind in the Libya plain are. The grapevine names often derive from their morphology (e.g. “Pinot” comes from the pine-cone form of the bunch), behavior (e.g. “Primitivo” comes from the early grape maturation period), presumed site of origin (e.g. “Uva di Troia” was thought to come from the mythical site of the Asia Minor) etc. With the commercial exchanges many genotypes have been naturalized in places different from the original ones where they have been often were called with a different name/s. Hence, presently, many genotypes have several synonyms and homonyms that make difficult their cataloging and identification (Zohary and Hopf, 2000; Silvestroni and Virgili, 2005; Storchi and Lelli, 2005).
6 As summarized by Storchi and Lelli (2005), approximately 2000 grapevine cultivars are estimated to be grown in Italy in the past. This richness of variety lasted about until the XIX century. This huge number of varieties, and related wines, although useful for helping to preserve the biodiversity within the grapevine species, created a great confusion and degenerated often into poor quality products; for this reason, it was seen as an obstacle to the development of a modern oenological industry. At the beginning of the XX century, many technicians suggested to reduce the number of cultivated varieties, maintaining just the best ones. Unfortunately, over the years, the reduction of the cultivar number was dramatic and caused the loss of a significant part of the previous grapevine germplasm accumulated over the centuries. Presently just over 350 varieties are enrolled in the Italian Catalogue of Grapevine Varieties, and, according to the national statistics, just ten varieties occupy more than 44% of the Italian vineyard surface. This tendency involved all the Italian regions, Apulia included, leading to a certain leveling of the enological products, fact that has a negative effects on both the internal and the foreign wine markets.
Today there is an agreement on the opinion that the local varieties have a multiple importance within the Italian grapevine germplasm. This is due to their ability to determine typical sensory and hedonistic characteristics of wine, as well as to evocate historical and cultural values. For these reasons, the regional varieties attract the interest of producers, operators, consumers and researchers. In facts, in the recent years, either scientific Institutions or grapevine producers have focused their attention on the recovery of old grapevine germplasm, typical of any growing area, and on the valorization of these genotypes by evaluating their enological potential.
Generally speaking, the recovery and valorization of genetic resources typical of a specific growing area, maintaining the genotype diversity of cultivated crops, is fundamental to preserve the species genetic pool that certainly includes several under-utilized but potential useful characters, and presently it is thought as a strategy to promote the territorial identity and the diversification of the local food products. This approach contrasts the tendency that, in the past decades, privileged the growing of few very efficient genotypes, resulting in a diffuse genetic erosion (FAO, 2011). As
7 concerns grapevine, limiting the loss of varieties is thought as a strategy to defend the national wine production, given the strong competition of the world markets and the wide diffusion of “international” varieties, and their wines, common to all the viticultural Countries.
The local germplasm includes well-known “major” varieties, the so called “minor” varieties, and genotypes still unknown. The major varieties, represent a solid reference for the traditional and famous wine production, although new knowledge may derive from investigating them by using the newest technologies. As concerns the minor varieties, the knowledge about their true identity, morphology, viticultural performance oenological potential is still limited and fragmentary; as for the unknown genotypes, they are still not coded and characterized.
The Apulia region is one of the ancient grapevine-growing areas, thus, it should have a rich heritage of grapevine varieties. Nevertheless, this region is thought to have one less “specialized” variety assortment among the Italian regions (http://www.inumeridelvino.it/2013/11/puglia-principali-vitigni-aggiornamento-istat-2010.html).
In order to contribute at refraining the trend toward the impoverishment of the grapevine germplasm, the University of Foggia undertaken a surveys aimed at individuating old grapevine accessions in Apulia, with particular attention to the Daunia area (de Palma et al., 2011). Within this research, a dozen accessions were identified in the “Alto Tavoliere Dauno” and twenty in the “Gargano” promontory (de Palma et al., 2013).
Generally speaking, after the individuation of the old accessions it is necessary to ascertain if they are not already known with another name/names in other growing areas; if not, each of them may be indicated as an “unique genotypes”.
1.2. Identification and characterization of the grapevine genotypes
The characterization and identification of grapevine varieties is obtained by “ampelographic” studies. The world “ampelography” comes from the Greek ampelos (grape) and grafo (to describe) and
8 literally means “description of grapevine”. Ampelographic studies combine several approaches, such as:
- ampelographic description, that utilizes morphological descriptors of grapevine organs in order to characterize their morphological traits at proper phenological stages;
- ampelometric measurements, that consist in measuring the main parameters of the vine organs such as leaves, bunches, berries, seeds, in order to obtain a “profile” to utilize for the variety identification;
- biochemical and biomolecular analysis, based on the study of some metabolite or of some DNA specific regions giving “objective” information for genotype characterization and identification.
Using more than one method allows the obtaining of most accurate and significant results.
The ampelographic study is a fast and quite inexpensive method for variety characterization, based on the observation of morphological descriptors of the phenotype. However, it is not absolutely probative since the morphological traits are influenced by several agro-environmental factors. Moreover, their assessment and interpretation is quite subjective, thus a reliable discriminations based only on vine morphology is often difficult to realize. This source of error frequently leads to mislabeling of individuals and rise of homonyms and/or synonyms for a same accession. Furthermore, genotypes related to each other may have similar traits, thus it is difficult to distinguish among them using only a morphological approach (Aradhya et al., 2003).
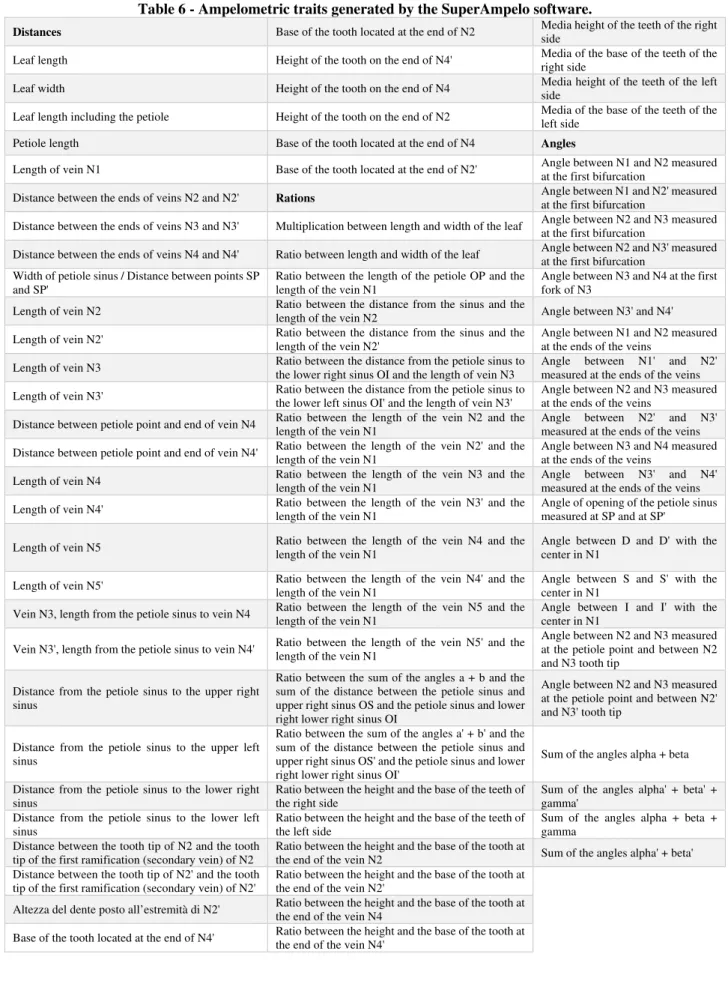
The ampelometric study may be also not expensive, but is time consuming, since it requires to take a huge number of measurements and elaborate mathematically the results. This is why, a specific informatics programs have been created. These programs allow also to obtain a graphic representation of the studied vine organs of any varieties. Leaves are the most studied organs since they are easy to take, store, analyze and compare. The mathematical elaboration of the basic measurements aimed to obtain some numerical indices that are not influenced by the agro-environmental factors. However, the discriminant power of this method is not very high.
9 The study of molecular DNA markers is expensive, but the interpretation of their results is more objective. Among them, Random Amplified Polymorphic DNA (RAPD), Restriction Fragment Length Polyphorphism (RFLP), Amplified Fragment Length Polymorphism (AFLP) and Simple Sequence Repeat (SSR) are used. These markers, being direct expression of genotype, are not affected by the effect of environmental factors (soil, climate, methods of cultivation, diseases, etc.).
Presently, SSRs are the favorite type of DNA markers because their properties make them suitable for a wide range of applications, from phylogenetic, parentage testing and pedigree reconstruction, to cultivar discrimination and identification and management of germplasm collections (Thomas et al., 1993; Bowers et al., 1996; Thomas et al., 1998; Bowers et al., 1999; Sefc et al., 2000). SSRs (microsatellites) are arrays of short motifs that consist of 1 to 4 pairs of DNA bases. This locus-specific type of marker is characterized by abundance, hypervariability, high reproducibility, Mendelian inheritance and codominant nature. Microsatellite are suitable for discriminating between homozygosis and heterozygosis, and among closely related taxa (Scott et al., 2000; Meredith, 2001). Due to all these positive traits, SSRs are widely used for cultivar identification and genetic diversity studies on grapevine. The massive use of this type of marker since 1990s allowed to get a wide range of information as concerns also many “synonym and homonym ambiguities” that were still unknown or that had been only hypothesized by the ampelographers, but non demonstrated. However, it is known that SSRs are not useful to distinguish among clones of a same variety (Crespan, 2010). About 300 microsatellites have been developed, mainly by the Vitis Microsatellite Consortium, and adopted at international level for grapevine genotyping. They are typically based on di-nucleotide repeats. Standardization and exchange of information concerning grapevine genetic resources using di-nucleotide repeats reference microsatellite markers were also proposed (This et al., 2004). However, in order to avoid allele miscalling, these markers require a very accurate and reliable protocols for allele separation and identification. Weeks and coll. (2002) reported that 83% of discrepancies between laboratories in scoring di-nucleotide alleles are due to arbitrary decisions in
10 binning, the process that converts raw allele lengths into allele classes and express the size as an integer.
In order to study the grapevine germplasm of the Italian regions, the Fondazione in Rete per la
Ricerca Agroalimentare-AGER supported the national research project “An Italian Vitis database with
multidisciplinary approach, for exploitation and valorization of the regional genotypes” (2011-2014). To study and characterize a wide range of the accessions individuated in all the Italian regions, a large set of characters were chosen among those coded by the Organisation Internationale de la Vigne et
du Vin (OIV) to describe the grapevine varieties; moreover, the results of the European research
projects that selected the most representative and discriminant descriptors were considered. The most important selected characters were the following: a) 48 morphological traits concerning shoot, young leaf, flower sexual organs, fertility, mature leaf, bunch and berry at maturity, all analyzed under the guidance of ampelographic record cards; b) 18 ampelometric traits, to measure and elaborate by means of a specific software (Superampelo 2.0); c) 9 vegetative and productive traits, to assess by visual inspection or by measuring or weighing; d) 14 microsatellite loci, that is, 9 loci selected by the European research projects GenRes081 and GrapeGen06 (VVS2, VVMD5, VVMD7, VVMD27, ZAG62, ZAG79, VVMD25, VVMD27), plus other 5 loci (VVMD6, VVMD17, VVMD21, VVMD24, VMC1b11) that are recognized as reliable and polymorphic ones.
1.3. The evaluation of grape oenological potential
It is recognized that the composition of grape at harvest is fundamental for determining the future quality of the wine (Carrara et al., 2008), hence the assessment of grape characteristics is a basic step requirement in any process aimed to evaluate the oenological potential of grapevine accessions. Chemical parameters that define the grape technological maturity (sugars and organic acids) (Liu et
al., 2006; Munoz-Robredo et al., 2011), together with the grape phenolic compounds, are well-known
11 Sugars and organic acids are known to be the primary compounds involved in the taste and in the quality assessment of fleshy fruit, included grapes; due to their direct impact on the wine-making process, sugar, acidity and pH levels are often defined as grape “technological parameters”. It is well-known hat leaves are specialized organs for producing sugars that, after migration, accumulate in other organs included fruits. The main grape sugars are glucose (8% fresh weight) and fructose (7% f.w.); sucrose is mainly important for transportation (Tucker, 1993). In the berry juice, glucose and fructose account for at least 99% of carbohydrates (Kanellis and Roubelakis-Angelakis, 1993). In wine grapes, the total sugar concentration indicates the potential alcohol level after fermentation. As the grape ripening begins, after veraison, the sugar level increases rapidly reaching an appropriate state of ripeness for a district. Grapes characterized by a very high sugar concentration give wines having a high alcohol level, which may mask the effect of other quality components; it happens especially with some genotypes, but also in districts with warm summers and very low rainfalls (Jackson and Lombard, 1993). Sugar accumulation is considered as the main process of fruit maturation. Sugars are also known as the starting point for obtaining many other fundamental berry compounds, including phenols and aromas; some aromatic compounds are not accumulated in the berry until sugars o not overcome 15 degree. The sugar accumulation, under given growing and environmental conditions, changes according to the grape variety and their typical maturation period: in facts, it is normally easier for early ripening varieties, since the sugar accumulation escapes from unfavourable climatic conditions that may characterize the late season. Sugar accumulation changes from 1-2% in green berries to 16-25% in ripen berry (Fregoni, 2005; Boluin and Guimberteau, 2004). The main berry acids are tartaric and malic acids, which account for at least 90% of the titratable acidity. Total acidity declines during the ripening, mainly due the acid utilization as respiratory substrate that involves especially the malic acid (Ulrich, 1970). In wine grapes, the acidity is an important quality factor since it influences the perception of the freshness and savouriness of the wine. Cultivars characterized by a higher tartrate/malate ratio give best wines. Nevertheless, a high tartaric content is often related to a low sugar content and gives low quality wines, while a low acidity
12 may be accompanied by both low or high sugar concentration: in any case, wine result “unbalanced” (Lavee and Nir, 1986; Kanellis and Roubelakis-Angelakis, 1993). As summarized by (Fregoni, 2005), the malic acid is quite easily oxidized during the grape maturation, since it is intensively respired at temperature about 30°C, while the tartaric acid is more stable, since its intense respiration occurs at about 37°C. In the must, the malic acid concentration rages from 3 to 7 g/L, while the tartaric acid concentration ranges from 7 to 10 g/L. The warm climate reduces juice total acidity. Genotypes characterized by “more” tartaric acid have a greater resistance to the lowering of total acidity during grape ripening. A satisfying malic acidity gives freshness to the wine; however, a too high malic acidity gives sour taste: high malic acidity is commonly related to non-well ripen grapes. Aridity is known to reduce the sum of malic and tartaric acids, while rains during grape maturation are known to increase it. Must acidity regulates must pH. The pH is a measure of the “true” free must acidity; it is very important for the evolution of malic-lactic fermentation during the winemaking process, for the final wine taste and color, for the wine biological stability, for the protein and metal stability. In the Potassium rich soils, such as those of Apulia, the root uptake of this element is high and, at cell level, increases the acid salification and hence the pH. As a result, pH tends to have higher values, such as in many growing areas of Southern Italy compared to the Northern ones.
Phenol compounds are considered as the main contributors for important wine organoleptic traits
such as color, astringency, and bitterness; moreover, due to their antioxidant and free radical-scavenging proprieties (López-Vélez et al., 2003; Ladete, 2012), increasing interest is presently devoted to their support in health benefits.
Although wine phenolics may have origin from microbial and wood sources, most of them originate in grape. They include the nonflavonoid and flavonoid compounds. The former consist of stilbens and phenolic acids. As for grape stilbens, the resveratrol produced by berry skins is the most important compound. It is a powerful antioxidant considered very useful for human health. Its concentration varies according to the variety (red grapes are more provided) but also to the grape exposure to
13 nevertheless, UV radiation is also a resveratrol elicitor. Trans-resveratrol is the most represented form (maximum 20 µg/g) (Fregoni, 2005). Phenolic acids, present in berry skin and pulp, consist of hydroxybenzoic and hydroxycinnamic acids esterified with tartaric acid. Flavonoids include anthocyanins, flavan-3-ols and flavonols. Anthocyanins gives the color to the skin of the black-berry varieties (varieties having pink, red, purple-violet, blue or almost black berry skin). Flavan-3-ols (tannins) are present, in berry skins and seeds, as monomeric forms (catechins), small oligomeric forms or large proanthocyanidin polymers also known as condensed tannins. Flavonols (glycosides of quercetin, myricetine, campferol) are accumulated in the berry skin throughout the fruit development and protect it from dangerous effects of ultraviolet radiation; they are also very important at healthy level (Glories 1988; Downey et al., 2006).
In the white wines, hydroxycinnamic acids and, at a lesser extent, flavan-3-ol monomers, are the most important phenolics: they act on the visual attribute of these wines. In the red wines, anthocyanins and tannins, especially the proanthocyanidins, are the most important compounds. Tannins are responsible for the bitter and the astringent component of the mouthfeel of a wine; condensed tannins are the most involved in the astringency. Moreover, tannins are necessary for the co-pigmentation reaction that stabilize the anthocyanins and the color of the wine during aging (Timberlake and Bridle 1976; Kennedy, 2008). Anthocyanin-flavonol copigments are also formed: although they are less stable than the anthocyani-tannin ones, they may be also important for the wine color stability in the early stages of the winemaking (Boulton, 2001).
As summarized by Kennedy (2008) and by Downey and coll. (2006), the concentration of grape phenolics changes throughout berry development. From the fruit set to berry veraison, hydroxycinnamic acids and tannins, especially seed tannins, increase, when expressed on a berry weight basis. Most of skin and seed tannins are present as proanthocyanidins. Proanthocyanidin composition differs between seeds and skin: seeds have shorter polymers with a similar amounts of catechin and epicatechin units; skin proanthocyanidin polymers are generally longer and epicatechin units prevail in their composition. Moreover, tannins produced by skins seem generally more “ripen”
14 than those produced by seeds, thus, if it is desired a more developed wine, more skin tannins are needed. The level of extractable tannins decrease, in both seeds and skins, between veraison and harvest: from an evolutionary point of view, this decreasing corresponds to a reduction of the overall bitterness and astringency of the grape and is part of a “seed dispersal strategy”, that involves also sugar accumulation in the juice and anthocyanin accumulation in the skin. In facts, form veraison to ripening, anthocyanins concentration increase in the skin and the berry color intensifies becoming more attractive; they decline late in berry development.
As summarized by Fregoni (2005), the hydroxycinnamic acid concentration ranges between 50 and 200 mg/kg of grape in the skin and between 20 and 170 mg/kg of grape in the pulp. Among varieties, these compounds vary about from 80 mg/kg (Claiette) to 367 mg/kg (Muscadet); for example, in grapes of Chardonnay, Pinot noire and Syrah were found about 189, 167 and 108 mg/kg of grape. As concerns flavonols, their concentration ranges between 10 and 100 mg/kg of grape. Anthocyanin concentration ranges from 500 to 3000 mg/kg of grapes; for example, they were found >1200 mg/kg in Cabernet Franc, >1500 in Merlot and Sangiovese and >1800 in Cabernet Sauvignon. At the beginning of their formation (veraison), only cyanidin and peonidin (glucosides of the dihydroxylated anthocyanins) accumulate, followed, during the time, by delphinidin, petunidin, and malvidin (trihydroxylated anthocyanins). Tannins (flavan-3-ols) concentration in the seeds varies in the range 1000-6000 mg/kg of grape.
Within a wide germplasm collection of white-berry accessions (seven varieties, three of which with two biotypes), skin proanthocynidins have been found ranging from 300 mg/kg of grape (Moscato di Terracina, pre-clone 657) to 2400 mg/kg of grape (Procanico, pre-clone 437) (Moretti et al., 2007). As summarized by de Palma and coll. (2010), within some of the most important black-berry varieties grown in Apulia, skin proanthocynidins reached 1890 mg/kg of grape in Nero di Troia; further analyses showed values as high as 2.449 mg/kg of grape in Bombino Nero and 2.893 mg/kg of grape in Negroamaro (not published data).
15 Nevertheless, it is well-known that during the winemaking process, more than half of the amount of phenol accumulated in grapes are lost, due to incomplete extraction and to phenomena of adsorption and precipitation; as a consequence less than half of grape phenols are recovered in wine (Singleton and Trousdale 1992). Hence, in order to produce high quality wine, it is important starting from grapes having a high phenol concentration.
As it has been reported by Fregoni (2005), anthocyanin extractability may vary from 20% to 50%; it is considered low when is 20-35%, intermediate when is 35-45%, and high when is >45%. The extractability depends on skin ability to diffuse the pigment: this trait is influenced by several agro-environmental factors, such as grape maturity level, plant water status etc., but, under same conditions, the variety makes the difference: for example Merlot exhibits higher extractability than Cabernet Sauvignon. Thus, as summarized by Moio and coll. (2007), the amount of extracted phenols depend on phenol concentration in grapes and on the composition of the skin cell wall and of seed cuticle, apart from the winemaking techniques. The anthocyanin extractability and their relationship with the cell wall, particularly with the cellulose and pectic compounds that are about 30-40% of total cell wall polysaccharides, have been largely studied: pectins of cell wall and middle lamella need be largely degraded in order to allow phenols to diffuse easily from the grape into the must. Differences in skin polysaccharide content and in degree of pectin methylation, that is specific of any variety, are highly responsible for different anthocyanin extractabilities.
On the whole, type and quantity of grape and wine phenolics are influenced by the growing conditions, harvesting time and winemaking techniques, but the first variable is the grape variety (Lachman et al., 2009). The indices of skin and seen phenol content are considered useful to evaluate the oenological attitude of the grapevine variety. The extraction in an alcoholic solvent at low pH, that is almost drastic, is suitable to assess the variety basic phenol accumulation habit, while the extraction in aqueous solvent, at must pH, is suitable to evaluate the final suitability to produce phenol-rich wines (Di Stefano and Cravero, 1991).
16
References Chapter 1
• Aradhya M.K., Dangl G.S., Prins B.H., Boursiquot J.M., Walker A.M., Meredith C.P., Simon C.J., 2003. Genetic structure and differentiation in cultivated grape Vitis vinifera L. Genet Res (Camb), 81:179–192.
• Boluin J., Guimberteau G., 2004. Maurazione e Maturità dell’uva Eno-one, Reggio Emila • Boulton R., 2001. The copigmentation of anthocyanins and its role in the colour of red wine:
a critical review. American Journal of Enology and Viticulture, 52: 67–87.
• Bowers J.E., Dangl G.S., Meredith C.P., 1999. Development and characterization of additional microsatellite DNA markers for grape. Amer. J. Enol. Vitic., 50(30): 243-246. • Bowers J.E., Dangl G.S., Vignani R., Meredith C.P., 1996. Isolation and characterization of
new polymorphic simple sequence repeat loci in grape (Vitis vinifera L.). Genome, 39: 628-633.
• Carrara, M., P. Catania, M. Vallone, and S. Piraino. 2008. Mechanical harvest of grapes: Assessment of the physical‐mechanical characteristics of the berry in order to improve the quality of wines. In Proc. Intl. Conf. on Agricultural Engineering: Agricultural and Biosystems Engineering for a Sustainable World (AgEng 2008). Hersonissos, Crete - Greece. • Crespan M., 2010. Exploration and evaluation of grapevine biodiversity using molecular
markers. Mitteilungen Klosterneuburg, 60: 310-315.
• de Palma L., Biscotti N., De Michele M., Limosani P., Sacco L., Tomaiuolo A., 2013. Conoscenza e valorizzazione dei genotipi viticoli regionali: progetto “AGER” per l’implementazione dello “Italian Vitis Database”. La ricerca nel promontorio del Gargano. Riassunto dei Lavori X Giornate Scientifiche della Società di Ortoflorofrutticoltura Italiana (SOI). Padova, 25-27 giugno 2013 (abstract). Acta Italus Hortus, (12): 111 (ISBN 978-88-905628-3-9).
• de Palma L., Limosani P., De Michele M., Tamborra P., Tarricone L., Novello V., 2011. Evaluation of experimental wines obtained from “new old” white-berry genotypes of the northern province of the Apulia region (Daunia, Italy). Le Progrès Agricole et Viticole, 128: 477-484.
• de Palma L., Tarricone L., Novello V., 2010. Caratteristiche distintive dei vitigni coltivati in Puglia per la produzione dei vini rosari. Convegno Internazionale sui Rosati di Puglia. Otranto (LE), 6 marzo 2010. http://www.aivv.it/index.php/effettuate?chronoform=frmAtti& tornata= 29.
• Di Stefano R., Cravero M.C., 1991. Metodi per lo studio dei polifenoli dell’uva. Riv. Vitic. Enol., 44 (2): 37-45.
• Downey M.O., Dokoozlian N.K., Krstic M.P., 2006. Cultural practice and environmental impacts on the flavonoid composition of grapes and wine: A review of recent research. Am. J. Enol. Vitic., 57(3): 257-268.
• FAO, 2011. Biodiversity and food for agriculture. Outcomes of an Expert Workshop held by FAO and the Platform on Agrobiodiversity Research. Rome (Italy) 14-16 April 2010 (ISBN 978-92-5-106748-2).
• Fregoni M., 2005. Viticoltura di qualità. Ppytoline, Affi (VR).
• Glories, Y., 1988. Anthocyanins and tannins from wine: organoleptic properties. In: Cody, V., Middleton,E. and Harborne, J. B. (Eds) “Plant Flavonoids in Biology and Medicine II: Biochemical, Cellular, and Medicinal Properties”. Alan R. Liss, Inc. New York, pp.123–134.
17 • Jackson D.I., Lombard, 1993. Environmental and Management Practices Affecting Grape
Composition and Wine Quality-A Review. Am. J. Enol. Vitic., 44(4): 409-430.
• Kanellis A. K., Roubelakis-Angelakis K.A., 1993. Grape. In: Semyour G.B., Taylor J.E., Tucker G.A. eds.” Biochemistry of fruit ripening”. Chapman & Hall.
• Kennedy J.A., 2008. Grape and wine phenolics: Observations and recent findings. Cien. Inv. Agr. 35(2): 107-120.
• Lachman J., Šulc M., Faitová K., Pivec V., 2009. Major factors influencing antioxidant contents and antioxidant activity in grapes and wines. Int. J. Wine Res., 1: 101–121.
• Landete J.M., 2012. Updated knowledge about polyphenols: functions, bioavailability, metabolism, and health. Crit. Rev. Food Sci., 52: 936–948.
• Lavee S., Nir G., 1986. Grape. In: Monselise S.P. ed “CRC Handbook of fruit set and development. CRC Press, Boca Raton, FL.
• Liu H.F., Wu B.H., Fan P.G., Li S.H., Li L.S., 2006. Sugar and acid concentrations in 98 grape cultivars analyzed by principal component analysis. Journal of the Science of Food and Agriculture, 86: 1526–1536.
• López-Vélez M., Martínez-Martínez F., Valle-Ribes C.D., 2003. The study of phenolic compounds as natural antioxidants in wine. Crit. Rev. Food Sci., 43: 233–244.
• Meredith C.P., 2001. Grapevine Genetics: Probing the Past and Facing the Future. Agriculturae Conspectus Scientificus, 66(1): 21-25.
• Moretti S., Cedroni A., Pietromarchi D.T., 2007. Analisi del contenuto polifenolico delle uve da precloni appartenenti a varietà di interesse vivaistico del Lazio. Vendemmia 2006 e 2007. http://www.agricoltura.regione.lazio.it/agriweb/schede_informative_dettaglio.php?id=144. • Munoz-Robredo P., Robledo P., Manriquez D., Molina R., Defilippi B.G., 2011.
Characterization of sugars and organic acids in commercial varieties of table grapes. Chilean Journal of Agricultural Research, 71: 452–458.
• Ribéreau-Gayon, P. and Glories, Y.,1986. Phenolics in grapes and wines. In: Proceedings of the 6th Australian Wine Industry Technical Conference. (Australian Wine Industry Technical Conference Inc.: Adelaide) pp. 247–256.
• Scott K.D., Eggler P., Seaton G., Rossetto M., Ablett E.M., Lee L.S., Henry R.J., 2000. Analysis of SSRs derived from grape ESTs. Theor. Appl. Genet., 100, 723-726.
• Sefc K.M., Lopes M.S., Lefort F., Botta R., Roubelakis-Angelakis K.A., Ibáñez J., Pejic I., Wagner H.W., Glössl J., Steinkellner H., 2000. Microsatellite variability in grapevine cultivars from different European regions and evaluation of assignment testing to assess the geographic origin of cultivars. Theor. Appl. Genet., 100, 498-505.
• Silvestroni O., Virgili, S., 2005. I vitigni. In: Ricci A., Polidori E. eds. “La vite e il vino nelle Marche”. Bolis Edizioni, Azzano San Paolo (BG), pp. 96-113.
• Singleton V.L.. Trousdale E.K., 1992. Anthocyanin-tannin interactions explaining differences in polymeric phenols between white and red wines. American Journal of Enology and Viticulture 43: 63–70.
• Storchi P., Lelli L., 2005. Recupero, descrizione e conservazione del germoplasma viticolo toscno. In: Turchi R. (ed.) “Il germoplasma viticolo della Toscana. Vol. 1, ARSIA Regione Toscana, pp.13-40.
• Timberlake C.F., Bridle P., 1976. The effect of processing and other factors on the colour characteristics of some red wines. Vitis, 15:37-49.
• This P., Jung A., Boccacci .P, Borrego J., Botta R., Costantini L., Crespan M., Dangl G.S., Eisenheld C., Ferreira-Monteiro F., Grando S., Ibáñez J., Lacombe T., Laucou V., Magalhães
18 R., Meredith C.P., Milani N., Peterlunger E., Regner F., Zulini L., Maul E., 2004. Development of a standard set of microsatellite reference alleles for identification of grape cultivars. Theor Appl Genet, 109:1448-1458.
• Thomas M.R., Scott N.S., Microsatellite repeats in grapevine reveal DNA polymorphisms when analysed as sequence-tagged sites (STSs), Theor. Appl. Genet., 86, 985 - 990 (1993). • Thomas M.R., Scott N.S., Botta R., Kijas M.H., 1998. Sequence-tagged site markers in
grapevine and citrus. Journal of the Japanese Society for Horticultural Science, 67: 1189-1192.
• Tucker G.A., 1993. Introduction. In: Semyour G.B., Taylor J.E., Tucker G.A. eds. “Biochemistry of fruit ripening”, Chapman & Hall.
• Ulrich 1970. Organic Acids. In: Hulme A. ed “The Biochemistry of fruit and their products” Vol. 1. Academic Press.
• Weeks D.E., Conley Y.P., Ferrell R.E., Mah T.S., Gorin M.B., 2002. A tale of two genotypes: consistency between two high-throughput genotyping centres. Genome Res, 12:430-435. • Zohary D., Hopf M., 2000. The domestication of the plants in the old world: the origin and
spread of cultivated plants in West Asia, Europe and Nile Valley, 3rd ed. Oxford University Press, Oxford.
19
2. CHARTER: RESEARCH OBJECTIVES AND
METHODOLOGIES
2.1. Research objectives
This study is aimed to the characterization of several old grapevine genotypes found in the Daunia province, according two types of approaches:
• using SSR markers to identify the genetic profiles (genetic fingerprinting) and to compare them with those of genotypes already known at a national and international level;
• assessing the main qualitative characteristics of the grapes from a technological and phenolic point of view, in order to evaluate the potential interest of these genotypes for a further oenological use.
In Italy, such as in other Countries of ancient viticultural tradition, a huge number of variety names coexist due to several causes, such as, the movement of plant material from one place to another, the loss of the original name and the arbitrary substitution with a new one often deriving from the farmer, or the growing area, or a particular morphological trait of the vine or of the grape. These facts give rise to a huge number of cases of synonymy and/or homonymy. Genetic characterization and varietal identification are essential to resolve these cases and bring order in the vast ampelographic heritage. The present PhD study is part of a national research project called: AGER- "An Italian Vitis database with multidisciplinary approach, for exploitation and valorization of the regional genotypes" to which the University of Foggia participates. The main objective of this project is to identify and characterize in terms of morphological, physiological, bio-molecular and technological traits the regional genotypes. The results of this PhD work, together with other information already available, has been used to implement the first Italian Vitis Database (IVD). For major and minor genotypes found in the Apulia region, many data have been entered in the IVD as concerns selected characters (and relative
20 descriptors) referred to genetic, morphological, phenological, vegetative-productive and qualitative traits.
2.1.1. The search path
The starting point of this research project was the recovery of grapevine accessions in very old vineyards by now "forgotten". Since 2004, some professors and researchers at the University of Foggia in collaboration with agronomists and growers of the place have identified a group of 35 accessions in the Alto Tavoliere, Gargano and Monti Dauni areas. The accessions were highlighted by local residents (elderly, old farmers, etc.) and nominated with dialect names and typical names of the recovery area. The studied accessions were identified in ancient vineyards, however, while the accessions found in the Gargano and in the Monti Dauni areas were studied in situ, those of the Alto Tavoliere area were collected in a field collection at the Cantine Fortore, Torremaggiore (FG) to study the behavior of all the plants in a homogeneou environmental conditions.
Because of the limited information on the identity, the diffusion and confusion of the variety names recovered in each area, the study continued with the genetic characterization for all accessions identified using SSR molecular markers. Then, the genetic profiles were compared with that of other genotypes enrolled in national and international databases in order to identify eventual synonyms and to clarify their identity. Finally, we have studied the qualitative characteristics of the grapes, which are important for the evaluation of their oenological potential.
2.2. Material and methods
2.2.1. Plant materialThe 35 accessions analyzed (Table 1) include 13 accessions found in the “Alto Tavoliere” area, 1 from the “Monti Dauni” area and 21 from the “Gargano” area. In order to obtain a correct allele sizing and share information among labs, the cv Sangiovese was included as reference variety.
21
Table 1 - List studied accessions.
“Alto Tavoliere” area white berry varieties (13)
Anonimo, Biancoreale, Bombino Bianco (2 accessions), Ciucciuitto, Lunardobello, Malvasia Bastarda, Selvaggio, Squaccianosa (2 accessions), Tuccanese Moscio, Uvarilla, Uva Palomma.
“Monti Dauni” area black berry varieties (1)
Tuccanese
“Gargano” area black berry varieties (9)
Bombino Nero falso, Malvagia Nera, Moscatiddone Nero, Moscato Tamburro, Sanguinella, Somarello Rosso, Tinturino, Uva della Macchia, Uva Nera Tosta.
white berry varieties (12)
Bell’Italia, Chiapparone, Lugliese, Moscatello del Vasto, Moscatello di Vico, Moscatiddone Bianco, Moscato Saraceno, Nardobello, Scannapecora, Uva Pane, Uva Sagra, Zibibbo.
DNA was extracted from young leaves in good health status (to minimize contamination) by two methodology: CetylTrimethyl Ammonium Bromide (CTAB) method (Mulcahy et al. (1993) modified by Vignani et al. (2002)) and DNeasy Plant mini kit (Qiagen S.r.l., Milano), because in each have been found critical points and consequent difficulty of performing. The vegetal material was transported in cool bag at Arboriculture Laboratory of Department of Sciences Agricultural, Food and Environmental, University of Foggia. The samples were stored at -80 °C in order to maintain the integrity of the tissues until DNA extraction.
2.2.2. Analysis of genetic profile
Genetic analysis provides a preliminary step that consists in the DNA extraction from young leaves and in the extracted DNA purification. Obtaining DNA in sufficient quantity and good quality is fundamental for the result, because the DNA is the substrate of all reactions necessary for genetic analysis. The following step was the genetic fingerprinting performed using the “microsatellite” technique based on amplifying, by an enzymatic reaction called PCR, some genome regions of Vitis
vinifera containing specific microsatellite loci DNA (SSR, Simple Sequence Repeats) constituted by
1 to 6 nucleotide repeated at a tandem of 5 to 100 times. This step involves several stages: SSR choice, PCR analysis, electrophoretic analysis of the amplified products, allele sizing. The last step was the genetic profile comparison.
22
2.2.2.1. DNA extraction
The DNA extraction with CTAB method allows to obtain a good DNA yield, but not always a good purity, so for some accessions characterized by high concentration of carbohydrates, polyphenols and proteins, it was necessary to use the DNeasy Plant mini kit.
The DNA extraction with DNeasy Plant mini kit has the advantage of a great speed of application, allows us to obtain more DNA pure and it is safer for the health of the operator that is not in contact with hazardou reagents. By contrast, the disadvantages were the low DNA yield and the high cost. For the DNA extraction, the glassware and plastic material used were sterilized by autoclaving at 120 ° C for 20 minutes and the reagents used were free of DNase, RNase and protease.
CTAB method
Frozen tissue (0.2-0.3 g) was ground in a mortar and pestle in liquid nitrogen. The tissue powder was transferred in 15 ml falcon tube and homogenized in 3 ml of pre-worm (60 °C) CTAB buffer containing: 1.4 M NaCl (pH 8.0); 100 mM Tris-HCl (pH 8.0); CTAB 2% (w/v); 2-Mercaptoethanol 0.4% (w/v). The mixture was incubated for 1 hour in water-bath at 65 °C and mixed 2-3 times. Samples were cooled at room temperature, homogenized in an equal volume of chloroform/octanol (24/1; v/v) and centrifuged at 4500 rpm (Rotor SX4250, Beckman Coulter, Milano) and 4 °C for 15 minutes. The upper (aqueous) phase was transferred in new 15 ml falcon tube, homogenized in an equal volume of cold iso-propanol (-20 °C), incubated at -80 °C for 30 minutes and centrifuged at 4500 rpm (Rotor SX4250, Beckman Coulter, Milano) and 4 °C for 30 minutes. Then, the aqueous phase was discarded; the pellet was rinsed with 1.5 ml of 76% EtOH/0.2M NaAc (sodium acetate) in 1.5 ml tube, incubated in ice for 30 minutes and centrifuged at 11600 rpm (Rotor n. 75003424, Thermo Fisher Scientific Milano Srl) and 4 °C for 10 minutes. The aqueous phase was discarded again, the pellet was rinsed in 1.5 ml of 76% EtOH/0.01M NH4Ac (ammonium acetate), incubated in ice for 30 min, centrifuged at 11600 rpm (Rotor n. 75003424, Thermo Fisher Scientific Milano Srl) and 4 °C for 10 minutes, after the aqueous phase discarded, and the pellet was dried on lab bench.
23 Dry pellet was dissolved in TE 500 µl containing 10 mM Tris-HCL (pH 8.0) and 1 mM Na2EDTA (pH 8.0), then 5.5 µl of RNase (10 mg/ml) was added and it was incubated at 37 °C for 30 minutes mixing the tube 2-3 times. After, an equal volume of phenol/chloroform (1:1) were added, and it was mixed and centrifuged at 11600 rpm (Rotor n. 75003424, Thermo Fisher Scientific Milano Srl) and 4 °C for 10 minutes. The upper (aqueous) phase was transferred in new 1.5 ml tube, then 1/10 volume of 3 M NaCl and 2 volume of absolute cold EtOH (-20 °C) were added; it was incubated at -80 °C for 30 minutes, centrifuged at 11600 rpm (Rotor n. 75003424, Thermo Fisher Scientific Milano Srl) and 4 °C for 10 minutes and finally it was discarded. The pellet was dried on lab bench and dissolved in 150-200 µl of ultrapure water and sterile.
DNA extraction with DNeasy Plant mini kit
Frozen vegetal tissue (0.1 g) was ground to a fine powder under liquid nitrogen using a mortar and pestle. The tissue powder was transferred in a 1.5 ml tube; it was homogenized in 400 µl of pre-worm (37 °C) AP1 buffer and incubated for 10 minutes in water-bath at 65 °C. After, 2 µl of RNase (10 mg/ml) were added and it was incubated at 37 °C for 30 minutes. The mixture was homogenized with 130 µl of P3 buffer, and then it was incubated for 5 minutes on ice and centrifuged for 5 minutes at 14400 rpm (Rotor n. 75003424, Thermo Fisher Scientific Milano Srl). The supernatant was transferred into the QIAshredder Mini spin column (lilac) placed in a 2 ml collection tube, and then it was centrifuged for 2 minutes at 14800 rpm (Rotor n. 75003424, Thermo Fisher Scientific Milano Srl). The flow-through fraction, without pellet, was transferred into a new tube and 1.5 volumes of AW1 buffer was added. The mixture was transferred into the DNeasy Mini spin column placed in a 2 ml collection tube; it was centrifuged for 1 min at 8200 rpm (Rotor n. 75003424, Thermo Fisher Scientific Milano Srl) and finally, the flow-through was discarded. After, the DNeasy Mini spin column was washed two times with 500 µl of AW2 Buffer:
- the first time, it was centrifuged at 8200 rpm (Rotor n. 75003424, Thermo Fisher Scientific Milano Srl) for 1 minute;
24 - the second time, it was centrifuged at 14400 rpm (Rotor n. 75003424, Thermo Fisher Scientific
Milano Srl) for 2 minutes and it was placed on lab bench for dry the membrane.
Finally, 50 µl of ultrapure water and sterile were added directly into the DNeasy membrane, it was incubated for 10 minutes at room temperature (15–25°C), and then it was centrifuged for 1 minute at 8000 rpm (Rotor n. 75003424, Thermo Fisher Scientific Milano Srl). This step was repeated two or three times to obtain the maximum DNA yield.
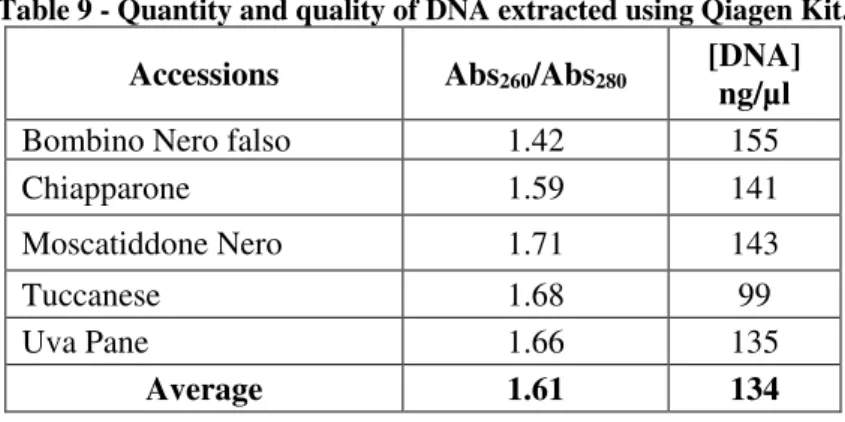
For some accessions, that is, “Tuccanese” of Monti Dauni area, “Bombino Nero falso”, “Moscatiddone Nero”, “Uva Pane” and “Chiapparone” of the Gargano area, it was necessary to use the Qiagen kit for DNA extraction because the absorbance ratio Abs260/Abs280 was very low (about 1.3). For these accessions, the DNA yield was very low.
For all the other accessions, DNA was extracted using the CTAB method. Much more DNA yield was obtained by these samples. It was sufficient to perform several washes the extracted DNA with ethanol (DNA purification) to obtain a DNA samples free from phenol and protein compounds. More purification cycles were needed by the Gargano accessions.
2.2.2.2. DNA quantification
The quality and quantity of extracted DNA were measured by UV spectrophotometry. Each sample was scanned at a wavelength between 220 nm and 320 nm against a blank containing ultrapure water by spectrophometer Smart Spec Plus (Bio-Rad Laboratories S.R.L., Milano), obtaining a graph which trend has allowed us to detect the presence of proteins and other contaminants. Five microliters of DNA dissolved in ultrapure water were diluted in 145 µL of ultrapure and sterile water. The DNA yield was measured at 260 nm: the absorbance of 1 at 260 nm (A260) corresponds approximately to 50 g/ml of DNA, therefore the DNA concentration in the cuvette was calculated according to the formula:
25 At the same time, a second measurement was performed at 280 nm to verify the absorption of proteins. DNA purity was determined by calculating the absorbance ratio A260/280. This ratio was considered valid index of DNA purity (quality). In fact, while the measurement of absorbance at 260 indicates the nucleic acid presence, the measurement of absorbance at 280 indicates the impurity presence (particularly protein). A value between 1.8 and 2 indicates good purity DNA.
After the quantification, the DNA concentration of each sample was brought to 2.5 ng/µl with ultrapure and sterile water. Finally, the samples were stored at -20 °C until the analysis.
2.2.2.3. DNA purification
For some Gargano accessions, which DNA was extracted by the method of CTAB, the A260/280 was very low and the graph obtained by spectrophotometer showed the contaminant presence. In this case the DNA was purified by repeating the following steps: the total volume of the DNA extracted was brought to 500 µl using TE, and 1/10 volume of 3 M NaCl and 2 volumes of absolute EtOH at -20 °C were added. It was incubated at -80 °C for 30 minutes and, finally it was centrifuged at 11600 rpm (Rotor n. 75003424, Thermo Fisher Scientific Milano Srl) at 4 °C for 10 minutes. The aqueous phase was discarded and the pellet was suspended in 1 ml of 70% EtOH, and it was centrifuged at 11600 rpm (Rotor n. 75003424, Thermo Fisher Scientific Milano Srl) at 4 °C for 10 minutes. The aqueous phase was discarded one more time and the pellet was dried on lab bench and, then it was dissolved in 150-200 µl of ultrapure water and sterile.
2.2.2.4. SSR analyses SSR choice
The variety identification of accessions studied was performed using fourteen SSR molecular markers: VVS2 (Thomas and Scott, 1993), VVMD5, VVMD6, VVMD7 (Bowers et al., 1996), VrZAG62, VrZag79 (Sefc el al., 1999), VVMD17, VVMD21, VVMD24, VVMD25, VVMD27, VVMD28, VVMD32 (Bowers et al., 1999), VMC1b11 (Zyprian et al., 2005). They were chosen partly upon the proposal of the European project GENRES081 (This and Dettweiler, 2003) and
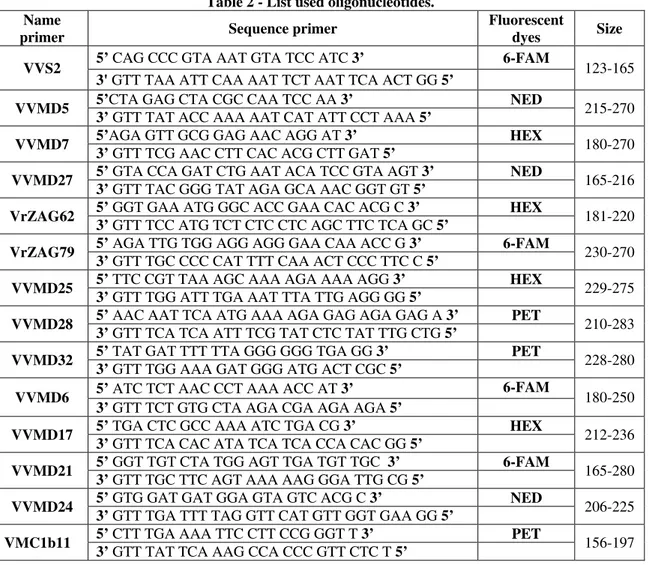
26 GrapeGen06 (VVS2, VVMD5, VVMD7, VVMD27, VrZAG62, VrZAG79, VVMD25, VVMD28, VVMD32) and partly because considered highly polymorphic (VVMD6, VVMD17, VVMD21, VVMD24, VMC1b11). One of each pair of the primers was labeled at the 5’ end whit a fluorescent dyes. The fluorescent dyes used are 6-FAM, HEX, NED and PET, which respectively emit blue, green, yellow and orange light. The use of different marking types allows the simultaneous analysis with the sequencer of more amplification products obtained with different primers. The SSR molecular markers were supplied by Life Technologies Italia, Monza (Fil. Life Technologies Europe BV) and Eurofins Genomics S.r.l, Milano (Fil. Eurofins MWG Operon). The table 2 shows the sequence of primer each pair.
Table 2 - List used oligonucleotides. Name
primer Sequence primer
Fluorescent
dyes Size
VVS2 5’ CAG CCC GTA AAT GTA TCC ATC 3’ 6-FAM 123-165
3' GTT TAA ATT CAA AAT TCT AAT TCA ACT GG 5’
VVMD5 5’CTA GAG CTA CGC CAA TCC AA 3’ 3’ GTT TAT ACC AAA AAT CAT ATT CCT AAA 5’ NED 215-270
VVMD7 5’AGA GTT GCG GAG AAC AGG AT 3’ 3’ GTT TCG AAC CTT CAC ACG CTT GAT 5’ HEX 180-270
VVMD27 5’ GTA CCA GAT CTG AAT ACA TCC GTA AGT 3’ 3’ GTT TAC GGG TAT AGA GCA AAC GGT GT 5’ NED 165-216
VrZAG62 5’ GGT GAA ATG GGC ACC GAA CAC ACG C 3’ 3’ GTT TCC ATG TCT CTC CTC AGC TTC TCA GC 5’ HEX 181-220
VrZAG79 5’ AGA TTG TGG AGG AGG GAA CAA ACC G 3’ 3’ GTT TGC CCC CAT TTT CAA ACT CCC TTC C 5’ 6-FAM 230-270
VVMD25 5’ TTC CGT TAA AGC AAA AGA AAA AGG 3’ 3’ GTT TGG ATT TGA AAT TTA TTG AGG GG 5’ HEX 229-275
VVMD28 5’ AAC AAT TCA ATG AAA AGA GAG AGA GAG A 3’ 3’ GTT TCA TCA ATT TCG TAT CTC TAT TTG CTG 5’ PET 210-283
VVMD32 5’ TAT GAT TTT TTA GGG GGG TGA GG 3’ 3’ GTT TGG AAA GAT GGG ATG ACT CGC 5’ PET 228-280
VVMD6 5’ ATC TCT AAC CCT AAA ACC AT 3’ 3’ GTT TCT GTG CTA AGA CGA AGA AGA 5’ 6-FAM 180-250
VVMD17 5’ TGA CTC GCC AAA ATC TGA CG 3’ 3’ GTT TCA CAC ATA TCA TCA CCA CAC GG 5’ HEX 212-236
VVMD21 5’ GGT TGT CTA TGG AGT TGA TGT TGC 3’ 3’ GTT TGC TTC AGT AAA AAG GGA TTG CG 5’ 6-FAM 165-280
VVMD24 5’ GTG GAT GAT GGA GTA GTC ACG C 3’ 3’ GTT TGA TTT TAG GTT CAT GTT GGT GAA GG 5’ NED 206-225
VMC1b11 5’ CTT TGA AAA TTC CTT CCG GGT T 3’ 3’ GTT TAT TCA AAG CCA CCC GTT CTC T 5’ PET 156-197
27 PCR analysis
In order to eliminate or minimize the presence of multiple bands and PCR byproducts, different concentrations of the extracted DNA, Mg++ and primer were tried for several loci, as listed below.
1) Loci VVS2, VVMD7, VVMD27, VrZAG62, VrZAG79, VVMD6, VVMD25, VVMD32, VMC1b11, VVMD17, VVMD21 and VVMD24: the amplification mixture was prepared with 10 ng DNA, 0.5 µM of each primer, 200 µM for each dNTP (EuroClone S.p.A., Milano), 4 µL of GoTaq Polymerase reaction buffer 5X (Promega Italia S.R.L., Milano), 1.875 mM of MgCl2 (Promega Italia S.R.L., Milano) and 0.5 units of GoTaq DNA polymerase (Promega Italia S.R.L., Milano) and deionized H2O.
2) Locus VVMD5: the amplification mixture was prepared with 4 µl the extracted DNA diluted 1:10, 1 µM of each primer, 200 µM for each dNTP (EuroClone S.p.A., Milano), 4 µL of GoTaq Polymerase reaction buffer 5X (Promega Italia S.R.L., Milano), 3.75 mM of MgCl2 (Promega Italia S.R.L., Milano) and 0.5 units of GoTaq DNA polymerase (Promega Italia S.R.L., Milano) and deionized H2O.
3) Locus VVMD28: the amplification mixture was prepared with 4 µl the extracted DNA diluted 1:10, 0.5 µM of each primer, 200 µM for each dNTP (EuroClone S.p.A., Milano), 4 µL of GoTaq Polymerase reaction buffer 5X (Promega Italia S.R.L., Milano), 1.875 mM of MgCl2 (Promega Italia S.R.L., Milano) and 0.5 units of GoTaq DNA polymerase (Promega Italia S.R.L., Milano) and deionized H2O.
Amplifications were performed in a final reaction volume of 20 µl in a thermocycler (My Cycler, Bio-Rad Laboratories S.R.L., Milano) using an amplification program for all PCR consisted of an initial denaturation of 2 minutes at 95 °C, followed by 30 cycles of 30 seconds at 92 °C, annealing for 30 seconds at 52 °C and 1 minute at 72 °C and a final extension stage of 5 minutes at 72 °C.
28 Electrophoretic analysis of amplified products
Aliquots of the amplified products were checked in 2% agarose gel stained with ethidium bromide (10 mg/ml) in TAE buffer 1X containing 40 mM Tris-Acetate and 1 mM Na2EDTA (pH 8.0). On the gel, 6 µl of each amplified mixed with 2 µl of loading buffer containing 25 mM Na2EDTA, 60% sucrose and Orange G were loaded. To evaluate the amplified quantity was used a molecular marker (Sharpmass™ 100 Plus, EuroClone S.p.A., Milano) consists of 12 DNA fragments ranging from 100 bp to 3 kb. The electrophoretic run was set at 85 V for about 25-30 minutes. The agarose gels were visualized on UV transilluminator (Gel Doc XR System, Bio-Rad Laboratories S.R.L., Milano) and the bands obtained was compared with the molecular marker.
The remaining PCR products were diluted with ultrapure and sterile water for the analysis to the sequencer.
For each accession, the amplified products were grouped by locus, and divided into two groups (group “A” and group “B”):
• group A, containing the amplified loci VVS2, VrZAG79, VrZAG62, VVMD7, VVMD27, VVMD5 and VMC1b11;
• group B, containing the amplified loci VVMD6, VVMD21, VVMD17, VVMD25, VVMD24, VVMD32 and VVMD28.
Hence, for each accession, two tubes containing the PCR products, diluted basing on the intensity of the bands visualized by the Gel Doc, were prepared. This separation was necessary to minimize the overlapping of the electrophorogram peaks obtained by the locus sequencing.
Allele sizing
The microsatellite fragment separation was performed, using capillary electrophoresis, by the Centro Interdipartimentale di Servizi per le Biotecnologie di Interesse Agrario, Chimico, Industriale (CIBIACI), University of Firenze.
29 Amplified alleles are represented by peaks on electropherograms; for each peak, the fragment length is expressed as number basis. The sequence of these numbers identify the genetic profile. The electropherograms was processed by the GeneScan v 3.7 software (Applied Biosystems Inc.). The alleles of each locus were represented on electropherograms with one or two peaks, depending on whether it is a locus homozygous or heterozygous. Furthermore, depending on the compound with which the primers were labeled, the peaks have been represented by different colors:
• blue, those marked with 6-FAM; • green, those labeled with HEX; • black, those marked with NED; • red, those marked with PET.
The GeneScan software, for each peak, calculate the molecular weight expressed as number of base pairs comparing them with a reference standard (GeneScan 500 LIZ Size Standard). The sequence of these numbers identify the genetic profile. After obtaining the genetic profile of each sample, it was included in the Database Viticolo Italiano (DVI, Italian Vitis Database) and the standardization was performed, using the variety Sangiovese as a reference. The standardization allows to uniform the data obtained by different laboratories, thus reducing or eliminating the discrepancies due to the shift in the number of base pairs.
2.2.2.5. Genetic profile comparison
SSR profiles were compared with those detected by other scientific Institution and with those included in the national and international databases for cultivar identification:
• The European Vitis Database: http://www.eu-vitis.de. • Italian Vitis Database: http://www.vitisdb.it.
30 2.2.3. Qualitative characteristics of the grapes
The grapes quality was assessed from a technological and phenolic point of view in order to evaluate the potential interest of these genotypes for the oenologic use. The measurements were performed in the year 2012 for the accessions of the Alto Tavoliere area, in the year 2013 for the accession of Monti Dauni area and in the year 2014 for those of Gargano area.
2.2.3.1. Technological parameters
The technological parameters (total soluble solids, titratable acidity, pH) were assessed whit common techniques. For each accession, about 300 berries were sampled from bunches, picking them from different parts of the plant. These berries were divided into three groups of about 100 berries and crushed manually. The resulting juice was poured through a strainer, centrifuged and separated from the solid residues, in order to obtain clear juice.
Soluble solid content was determined on the clear juice using digital refractometer (Atago WM7). The value, expressed in °Brix, is read directly on the display by placing a clear juice drop upon the prism-cell, after calibrating the instrument with deionized water.
Titratable acidity and pH were determined on the juice by automatic titration (Titralyser, Laboratoires Dujardin-Salleron, France). The titratable acidity was determined by the titration with NaOH (0.1 N) up to pH 7.0 of 10 ml of clear juice diluted 5 times with deionized water. It was expressed as tartaric acid multiplying the milliliters of used NaOH by 0.75 that is the equivalent weigh of tartaric acid divided by the juice milliliters used and by the NaOH normality.
The pH was determined immersing directly the electrode on clear juice and displaying the result on the display of the titration. Before of the measurement, the instrument was calibrated by a buffer at pH 4.0 and a buffer at pH 7.0.
2.2.3.2 Indices of phenol compound content
Grape phenol compounds will be analyzed, at grape maturity, by determining the total content in polyphenols, flavonoids, anthocyanins (red grapes), proanthocyanidins, flavans reacting with vanillin
31 of the skins and seeds, as well as hydroxycinnamic acid content of the pulp. For the different classes of phenol compounds, the content was determined by phenol extraction, using proper solutions and techniques and then by analyzing their total content at the proper wavelength range by using the spectrophotometric techniques. All the analysis can be conducted according to Di Stefano and Cravero (1991).
For each accession, about 100 berries were harvested from every part of the plant and divided randomly into groups of 10 berries. The extraction of phenol compounds was performed with two extraction solutions consisting of:
• ethyl alcohol, deionized water and concentrated hydrochloric acid in the proportion 70:30:1 (extraction solution based on hydrochloric ethanol);
• 5 g of tartaric acid, 22 ml of 1 N NaOH, 40 mg of potassium metabisulfite, 500 ml of deionized water, 120 ml of 95% ethanol and deionized water to 1 liter (tartaric buffer at pH 3.2).
For each extraction solution, three groups of 10 berries (repetitions) were formed, except the Gargano accessions for which it was possible to form a single group of 10 berries for each extraction solution because the heavy rain and hail occurred before harvest destroyed most of grapes.
The 10 berries of each repetition were weighed and prepared for analysis. We proceeded to separate the skins, pulp and seeds with the help of a scalpel. The skins were dried with absorbent paper, removing any residual pulp and it was weighed. The seeds were washed under running water and they were passed with deionized water, and finally they were counted and weighed. The pulp was poured in a beaker containing 50 mg of potassium metabisulfite (K2S2O5), it was pressed to make them as homogeneous as possible, and then it was centrifuged and separated from the liquid (juice); finally, the latter was diluted 10 times with 10N sulfuric acid (H2SO4) to prevent tartaric precipitation. The skins obtained by the first three groups of 10 berries were immersed in 25 ml of extraction solution based on hydrochloric ethanol for 24 hours at room temperature and in dark and the seeds were immersed in a same amount of extraction solution, however, left for 72 hours always at room temperature and in dark. The skins and seeds obtained from the other three groups were immersed in
32 50 ml of tartaric buffer at pH 3.2 and left under the same conditions of the first three groups. At the end, skins and seeds were separated from the extraction solution and the extracts were stored at -20 °C until analysis.
Acid hydroxicinnamiltartaric assay
The acids hydroxicinnamiltartaric content was determined by reading spectrophotometric at the wavelength of 320-325 nm on the juice obtained after centrifugation of the pulp and dilution with sulfuric acid. The absorption spectrum was recorded at the wavelength between 230 and 400 nm using quartz cells whit 1 centimeter optical path length against sulfuric acid considering how absorbance value the peak between 320 and 325 nm. The acids hydroxicinnamiltartaric content expressed as caffeic acid (mg/ L of the juice) was determined with the following relationship:
E • (10/0.9) • d
where E is the value of the absorbance; d is the dilution factor of the juice (10 in our case) and 0.9 is the absorbance of a caffeic acid solution to 10 mg/L.
Total polyphenol assay
The content of total polyphenols was determined by an oxidation reaction using the Folin-Ciocalteu reagent. A volume of 100 µl of extract was placed into a 20 ml flask. Then, 5 ml of distilled water, 1 ml of Folin-Ciocalteu reagent and after 3-5 minutes 4 ml of sodium carbonate solution (Na2CO3) to concentration 10% were added. Finally, the mixture was brought to volume with distilled water and left at room temperature and in the dark for 90 minutes. After, the absorbance reading was performed in the spectrophotometer UV-1700 (Shimadzu Europa GmbH, Germany) at the wavelength of 750 nm using quartz cells whit 1 centimeter optical path length against a blank prepared in the same way as samples, replacing only the extract with distilled water. The index of total polyphenols expressed as (+)catechin (mg/kg of grapes) was calculated with the following formula:
33 where 186.5 is the correlation coefficient between absorbance and concentration obtained using the (+) catechin as standard; E750 is the value of the absorbance; V is the volume of extract used (in our case 100 µl); X is the volume of the extraction solution; P is the 10 berries weight.
Total anthocyanin and flavonoid assay
The content of anthocyanins and flavonoids was determined by dilution the extract from 10 to 100 times with the hydrochloric ethanol solution for grape skins extracts and distilled water for grape seeds extracts. Then, the absorbance was read using quartz cells whit 1 centimeter optical path length against a blank containing the solution used for the dilution.
For total flavonoids, that have an absorption peak at the wavelength of 280 nm, an absorption spectrum was registered at the wavelength ranged between 230 and 400 nm. The absorbance E’280 ranged between the maximum at the wavelength of 280 nm and the tangent plotting to the spectrum conduct for the minimum point in the ultraviolet (graphic method). The total flavonoids index expressed as (+) catechin (mg/kg of grapes) was calculated with the following formula:
E’280 • 82.4 • d • X/P
where E’280 is the absorbance calculated using the graphical method; 82.4 is the molar extinction coefficient of (+)catechin; d is the dilution; X is the volume of the extraction solution; P is the weight 10 berries.
For total anthocyanins, that are present only in the red grape skins, the absorbance reading was performed at the wavelength of 540 nm and their content was expressed as malvidin-3-glucoside (mg/kg of grapes) using the following equation:
E540 • 16.17 • d • X/P
where E540 is the value of absorbance; 16.17 is the molar extinction coefficient of malvidin-3-glucoside; d is the dilution; X is the volume of the extraction solution; P is the weight 10 berries.
34 Total proantocyanidin assay
The proanthocyanidin content was determined by Bate-Smith reaction based on heating in acidic conditions. In these conditions, the proanthocyanidins are transformed into cyanidins and catechins that have an absorption peak at the wavelength of 532 nm. An extract aliquot (200 µl), 12.3 ml of ethanol and 12.5 ml of concentrated hydrochloric acid containing 300 mg L-1 of ferrous sulfate (FeSO4 • 7H2O) were placed in a 50 ml flask immersed in ice water and incased with aluminum film. The flasks were immersed in hot water bath equipped with a refrigerant for 50 minutes at 90 °C. For red grape skin extracts were recorded the absorption spectrum at the wavelength between 360 and 700 nm using quartz cells whit 1 centimeter optical path length against air, before that the flasks were immersed in hot water bath and the absorbance at wavelength of 532 nm (E°532) was calculated by the method graphic described above. After 50 minutes, the flasks were cooled in ice and water and the absorption spectrum at the wavelength between 360 and 700 nm was recorded using quartz cells whit 1 centimeter optical path length against air. The absorbance at 532 nm (E’532) wavelength was calculated by the graphic method. The content in proanthocyanidins expressed as cyanidin chloride (mg/kg of grapes) was determined with the following relationship:
1162.5 • ∆E/V • X/P
where 1162.5 is a coefficient obtained with the following relation, considering the 25 ml of the reaction mixture, a yield of 20%, the molecular weight of cyanidin chloride (MW = 322.7 g mol-1) and the molar extinction coefficient at a wavelength of 535 nm of cyanidin in 95% ethanol + 0.1 ml of HCl (ε = 34700): 1162.5 = 25 • MW/ε • (1/0.2) • 1000; ∆E = E’532 - E°532 in the case of red grapes and ∆E = E’532 in the case of white grapes; V is the volume of extract used (in our case 200 uL); X is the volume of the extracting solution; P is the weight of 10 berries.
Flavan reacting with vanillin assay
Vanillin is an aromatic aldehyde that it reacts in an acid condition with the positions 6 e 8 free of the proanthocyanidins giving red compounds: the intensity of red colorization lowers, as the