© Author(s) 2015. This work is distributed under the Creative Commons Attribution 3.0 License.
A
A
tm
spheric
P
P
ollution
R
R
esearch
www.atmospolres.com
The composition of PM
1
and PM
2.5
samples, metals and their water
soluble fractions in the Bologna area (Italy)
Elena Sarti
1, Luisa Pasti
1, Mauro Rossi
2, Monica Ascanelli
3, Antonella Pagnoni
1, Monica Trombini
3,
Maurizio Remelli
11 Department of Chemistry and Pharmaceutical Science, University of Ferrara, Via L. Borsari 46, Ferrara, 44121, Italy 2 Regional Agency for Prevention and Environment ARPA–Emilia–Romagna, Rimini, 47923, Italy
3 Regional Agency for Prevention and Environment ARPA–Emilia–Romagna, Ferrara, 44123, Italy
ABSTRACT
In this study the metal composition of PM1 and PM2.5 samples collected in the surroundings of a municipal incinerator
located in a suburban–farming area, less than 10 km away from Northeast of Bologna (Italy) was investigated. Seven out of eight monitoring stations were installed in a domain of 8x9 km2 around the incinerator plant; the eighth station was
placed inside the urban area of Bologna. The coordinates of four monitoring stations were selected on the basis of a preliminary study by using a dispersion model. Eleven metals (Al, Sb, As, Cd, Fe, Mn, Ni, Pb, Cu, V, Zn) were quantified in both the filter acid–digests and in the water extracts. The PM2.5 collected in all the sites of the domain were highly
correlated with exception of the urban site. The daily average metal concentrations in summer were 1.84% and 1.14% for PM2.5 and PM1 respectively, indicating that fine particles are less enriched in metals. Fe, Al and Zn were the most
abundant elements, and they represented about the 80% of the total amount of the analyzed ones. The average water soluble metal compositions were 0.71% and 0.41% for PM2.5 and PM1 respectively. In the sites of the suburban–farming
studied area the Principal Component Analysis (PCA) and Cluster Analysis revealed differences between water soluble metal compositions in PM1 and PM2.5. The urban sites were characterized by lower total and soluble metals contents
than the other PM2.5 stations installed around the incinerator plant. However, no noticeable difference in the
concentrations of metals in the particulate matter between the sites chosen as maxima of incinerator emissions and the control sites was observed. Keywords: PM2.5, PM1, water soluble metals, air quality, waste incinerator Corresponding Author:
Luisa Pasti
: +39‐0532‐455346 : +39‐0532‐240709 : [email protected] Article History: Received: 12 November 2014 Revised: 02 February 2015 Accepted: 02 February 2015 doi: 10.5094/APR.2015.0791. Introduction
In recent decades, due to the demographic growth and industrialization of advanced societies, waste production has consequentially increased. At present, various technologies including landfills, resource recycling and incineration processes have been applied to manage waste disposal. Among them incineration is one of most widespread. Nevertheless, during incineration treatment, a small amount of pollutants can be emitted in atmosphere and this can represent a threat to living organisms including humans. It is well known that incineration, like every combustion process, can generate fine particles and, for a given particle composition, the finest ones are the most harmful. In particular PM1, that is particulate with an aerodynamic diameter of less than 1 µm, is able to penetrate into the human respiratory and circulatory systems, resulting in adverse health effects (Chow et al., 2006; Pope III and Dockery, 2006). From the point of view of particles chemical composition, the exhaust gases of incinerators may contain many potentially harmful substances (Besombes et al., 2001), including metals (Chang et al., 2000; NRC, 2000; Hu et al., 2003). Furthermore, the presence of transition metals in PM can induce pro–inflammatory responses in human airways through their ability to form reactive oxygen species via Fenton or Fenton–like reactions (Prophete et al., 2006; Verma et al., 2010). In particular, water–soluble metals have been shown to be the key drivers of oxidants generation (Knaapen et al., 2002; Cheung et al., 2012).
These aspects cause a high perception of health risk related to the presence of incinerators, especially for local communities living nearby these plants. Although, it has been proved that nowadays Municipal Waste Incinerators (MWIs) represent a minor source of anthropogenic aerosol emissions compared to fossil fuel power plants and vehicle emissions (U.S. EPA, 2000; Cheng et al., 2009). This is especially true for efficient plants since the number and the chemical composition of the particles generated from MWIs are strongly affected by various operating parameters of the plant such as the combustion temperatures, the composition of the waste feed, the kind of filters installed. In such a contest, to assess the impact of incinerator (Donnelly, 1992), it is important to frame the emission of the plant with respect to the other possible sources (Ntziachristos et al., 2007).
The present work deals with the composition of PM1 and
PM2.5 collected near a MWI located in the Emilia–Romagna (ER)
region and exactly in the Bologna area. It should be mentioned that, in this geographical area, high levels of ambient particulate matter, often exceeding air quality limits, are encountered. Consequently, a number of studies dealing with Po Valley air monitoring have already been reported (Lonati et al., 2005; Vecchi et al., 2007). However, despite the number and quality of chemical data, most of these studies focused on the pollution properties and source apportionment of PM10 and the effects due to incinerator
have only been investigated pertly. To acquire new knowledge about the air quality in the proximity of incinerators, the local ER Administration promoted a wide research project called MONITER
(http://www.moniter.it). In this work, which is a part of the MONITER project, the daily evolution of the metal content of aerosol particulate as a function of particle size and seasonal conditions is reported, with the aim of differentiating patterns of aerosol composition driven by local meteorology or local sources. Specifically, this study includes the following four aspects: (1) a comparative analysis of the temporal variation of the PM1 and
PM2.5 in different functional areas in Bologna; (2) a comparative
analysis of levels of 11 elements in PM1 and PM2.5, focusing on the
pollutant properties of heavy metals; (3) the seasonal composition of PM1 and PM2.5; (4) the comparison of the levels of the water
soluble metals in different locations of the domain.
2. Experimental
2.1. Sampling locations The plant under study is located in a suburban–farming area, less than 10 km away from northeast of Bologna (Italy), in the Po Valley, which is a well–known polluted critical area. The incinerator plant has the following main features: 600 tons day–1 ofincinerating capacity, two 80–m–high stacks and BAT (Best Available Technique) purification devices.
Seven out of eight monitoring stations were installed in a domain of 8x9 km2 around the plant; the eighth station (MGA) was
placed inside the urban area of Bologna, in a site used for urban background measurements by ARPA–ER (Emilia–Romagna Regional Agency for Prevention and Environment).
A preliminary study with ADMS–Urban (Cerc, Cambridge, UK) dispersion model was performed to select monitoring station coordinates, using PM10 emissions as the pollutant tracer. The
details of the simulation are described elsewhere (Bonafe and Rossi, 2011). A first station (MXW) representative of maximum deposition of plant emissions, in the averaged meteorological winter conditions, was placed in the east side, not too far from the incinerator, along the wind main–direction axis. A second station (CTW), used as a “control” of the first one, was chosen in a position representing both the minimum deposition of plant emission and whole extra–incinerator emissions, according to the PM10
simulation. A second maximum (MXS) was placed on the west side of the plant on the same wind axis, in the averaged meteorological summer conditions and a second control (CTS) was chosen to represent both the minimum deposition of plant emission and whole extra–incinerator emissions, according to the PM10
simulation in summer. The other stations were placed to represent different air conditions in the domain:
MXD: The site is in a position of high traffic, it receives emissions from nearby freeways and railroad. Due anthropic emission sources, like vehicular traffic, domestic heating, railways and industrial activities it was also indicated as the most polluted site in the preliminary simulation study. MND: The site is surrounded by agricultural land. There are no
major roadways in the vicinity of the site and nearby traffic emissions are negligible. It represents the minimum of the domain of the pollution due to industrial and traffic sources, as evidenced by the preliminary simulation study. CAS in a suburban area. It is close to CTS, but it is located in an inhabited area. It was chosen to compare the PM composition of the control site CTS to that of a suburban area characterized by anthropic emission sources. The location of the monitored sites is reported in Figure 1. 2.2. Sampling methods
The meteorological conditions of the Po Valley are characterized by weak circulation of air masses in the winter period, and alternation of hot–dry and humid days in summer
(Larsen et al., 2012). On the contrary, in spring and autumn, atmosphere with frequent unstable to neutral conditions is encountered. Consequently, extremely high PM concentrations are usually recorded in summer and winter, and especially during the cold season. Therefore, the domain was monitored in the seasons that can lead to acute episodes. In particular, the sampling campaign was conducted from the 3rd of June to the 24th of July
2008 (herein referred as summer and notated with S) and from the 14th of January to the 12th of March 2009 (herein referred as winter
and notated as W). In both seasons, samples were collected daily; sampling collection continued for about 8 weeks. During the moni‐ toring periods, some meteorologycal parameters were recorded, i.e. temperature, pressure, relative humidity, wind velocity and direction, mixing height (Hmix) (see Table S1 in the Supporting
Material, SM). Meteorological parameters (temperature, pressure, relative humidity, solar radiation, rainfall, wind speed and direction) were available from ARPA–ER meteorological station (ARPA–ER, 2008; ARPA–ER, 2009). The summer campaign was meteorologically characterized by light winds. The wind roses of the campaign periods are reported in Figure 2a.
The simulation of the incinerator impact in the studied domain was performed based on PM10 emitted in the recorded
meteorological conditions (see Figure 2b). The details of the simulation are reported elsewhere (Bonafe and Rossi, 2011).
Identical units, each consisting of a Skypost PM TRC Tecora (Tecora, Paris, France) were set up in the sampling sites to collect daily PM2.5 and PM1 on quartz fiber filters 47 mm diameter
(Whatman, Maidstone, UK). The height of the sampler head was placed 2 m above to the ground level. PM1 samples were collected
solely in MXW, MXD and CTW (herein notated as MXW–1, MXD–1 and CTW–1, respectively) whereas PM2.5 samples in these three
sites were notated as MXW–2.5, MXD–2.5 and CTW–2.5, respectively. The data referring to the other sites, where solely the PM2.5 was monitored, were notated with the site label. After
gravimetry, chemical analysis was carried out on a sampling periods of 48 h, by joining filters of two subsequent days, for all sites. The analyses were carried out on a 24 h basis for the MXW site. The frequency of the analysis of this site was increased since the simulation indicated MXW as representative of maximum deposition of plant emissions, in the averaged meteorological conditions (see Figure 2b). For all the other sites, each daily filter was cut in 4 portions: two quarters of two subsequent days were pooled together to be used for chemical analysis of water soluble constituents, while the others to be used for analytes that are not water soluble.
The total number of samples was 309 for the summer campaign and 345 for the winter and eleven metals (Al, Sb, As, Cd, Fe, Mn, Ni, Pb, Cu, V, Zn) were quantified on every sample.
2.3. Chemical analysis
PM1 and PM2.5 mass concentrations were determined by
weighing the filters before and after the ambient sampling under controlled temperature (21±2 °C) and relative humidity (30±5%), using a microbalance Mettler (Mettler–Toledo, Columbus, OH, USA) with a resolution of 0.01 mg.
The total metal content was determined on samples mineralized through microwave digestion, using nitric acid and hydrogen peroxide, according to UNI EN 14902 2005 method (European Standard, 2005). The solutions obtained were analyzed through inductively coupled plasma–mass spectrometry technique (ICP–MS) with an Agilent 7700 (Agilent Technologies, Santa Clara, CA, USA) instrument.
For the determination of water soluble elements, the filters were extracted in 11 mL of deionized water (DI, Milli–Q, >18 MΩ, Millipore, Bedford, MA, USA) via sonication in a water bath for
20 min. These extracts were then filtered using 0.2 µm PTFE (polytetrafluoroethylene) filters (Puradisc, Whatman, USA). The filtered extracts for metals were acidified by adding nitric acid (high–purity trace metal grade, 2% w/v final solution), consistent with current protocols (Henshaw et al., 1989). The levels of water soluble metals were quantified using Graphite Furnace Atomic Absorption Spectroscopy (GF–AAS) with a PerkinElmer Analyst 800 (PerkinElmer, Waltham, MA, USA) instrument equipped with Zeeman background correction.
Blank concentrations for the filters, including the contribution from filter handling during sampling, were measured and used to correct the concentrations measured in the dissolved filters. The blank contribution to the total concentration was regularly under 20% for all the elements. In some sites, Zn concentrations in the acid digest were below the detection limit (LOD) in some days, whereas they were above the LOD in the water extracted, due to different detection limits of the two methods. Figure 1. Monitoring station locations.
Figure 2. (a) Wind roses; (b) simulation of the incinerator impact based on PM10falling–out (S: Summer, W: Winter). (a) (b)
The detection limits were calculated from the calibration curves and their values fell in the range 1.9x10⁻⁵–3.6x10⁻² μg m–3
for ICP–MS and 1x10⁻⁵–3.2x10⁻³ μg m–3 for GF–AAS. In the
computation, the average values were calculated assuming the concentration equal to 1/2 of LOD if the concentration was below the instrument detection limit (Lampa et al., 2012). Accuracy and precision (repeatability) were measured using Standard Urban Dust Reference Material (NIST, SRM–1648).
3. Results and Discussion
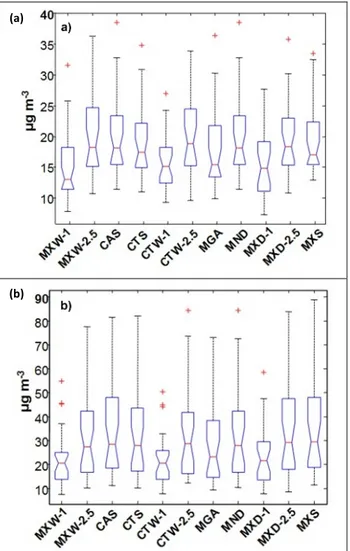
3.1. Particle mass concentrationsSeasonal differences were observed in the particle matter concentrations, with PM1 and PM2.5 highest concentrations during
winter (see Figure 3) The average concentrations were 15.52± 0.31 μg m–3 and 19.68±0.78 μg m–3 for PM
1 and PM2.5 respectively,
during the summer period (June–July), 22.38±0.59 μg m–3 and
33.7±1.9 μg m–3 and for PM
1 and PM2.5 respectively, during the
winter period (January–March). These data agree well with other studies previously reported in this area (Bigi and Ghermandi, 2014). In a recent publication (Bernetti et al., 2010) it has been reported that the SNAP (Selected Nomenclature for Air Pollution) sectors responsible for particulate matter are few, with road transport (SNAP sector 7) and commercial, institutional and residential combustion plants (SNAP sector 2) being the main sources of PM2.5.
The PM2.5 data measured during week–days were not
significantly different from those of weekends, only a moderate decrease in PM2.5 concentrations (about 10%) was observed during
the weekends. PM2.5 in the Po Valley has been shown to have a
fraction of secondary aerosol in the range of 32 and 47% in Bologna (Matta et al., 2003). The contribution from re–suspended dust to PM2.5 is expected to be smaller in comparison to larger PM
fraction (Amato et al., 2009). For these reasons a weekly cycle in PM2.5 is generally not observed.
The PM2.5 concentrations measured in the eight sites during
both the campaigns were highly correlated (see Table 1). In particular, a correlation coefficient higher than 0.887 was calculated for the winter PM2.5 data, whereas the correlation was
generally lower for the summer data, with a minimum value of 0.713. Furthermore, PM1 and PM2.5 in co–located measurements
were highly correlated with a minimum value of 0.779 in summer and 0.922 in winter.
It could be supposed that when the meteorological conditions favor the mixing of the lower atmosphere, the concentration levels are quite uniform in the whole domain, regardless of the PM sources: usually in winter, atmospheric dilution was lower due to stagnation conditions, resulting in the accumulation of air pollutants. In fact, the mixing height in winter was significantly lower than during the summer campaign (see the SM, Table S1).
A good correlation was also observed between PM2.5 collected
in the high traffic site (MXD) and in the rural site (MND). Since these sites are located at the opposite ends of the domain, this finding indicates that the sources of the major constituents of PM2.5 were similar. Spatial homogeneity, in the particulate matter
amount in the Po valley, has been found also for sampling sites located in proximity of an industrial area (Canepari et al., 2014).
3.2. Total metal concentrations
The sum of all elements constitutes a small fraction of particulate matter (about 1.8% of PM2.5 in summer). It was similar
to those found in Toronto (Celo and Dabek–Zlotorzynska, 2010) and in Milan (Marcazzan et al., 2001) equal to 1.2 and 1.4%, respectively.
Figure 3. Box plot of the particulate matter (PM2.5 and PM1) collected in
(a) summer and (b) winter. PM1 samples were collected solely in MXW, MXD and CTW sites and are notated as MXW–1, MXD–1 and CTW–1, respectively. At some sites (e.g., CAS, CTS, MGA, MND, and MXS), data are only for PM2.5. The main metal components of PM2.5 were Al and Fe, in fact,
they accounted for about 60–80% of the metal concentrations in summer. A significant contribution of these elements to the particulate collected in Phoenix, Arizona, USA, was evidenced previously (Kegler et al., 2001). Moreover, the mean concentra‐ tions of As, Cd, Cu, Fe, Mn, Ni, Pb, Sb and V in PM2.5 were in good
agreement (see the SM, Table S2), with those recently found in the Po Valley (Canepari et al., 2014). The winter data showed a similar trend. Zn was abundant in both the fractions of the particulate matter, and its concentration was in agreement (see the SM, Table S2) with that reported for Po Valley aerosol (about 20 and 30 ng m–3 in PM
1 and PM2.5 respectively) as reported by Perrone et
al. (2010).
The concentrations of elements in the PM2.5 collected at
different locations of the domain were similar. This finding suggests a reasonable uniformity in the contribution of the different metal sources to PM2.5. To investigate this hypothesis, the
correlation between the metal content of PM2.5 collected at MXD
and MND sites (see Sampling Locations) was considered. A good correlation for a major constituents like Fe was observed (R2=0.849, p=2x10⁻⁸, n=28), on the contrary, for a trace element
like As, the correlation was less significant (R2=0.443, p=0.023,
n=28).
(a)
Table 1. Matrix of correlation coefficients of PM at different sites in summer and winter MXW–1 MXW–2.5 CAS CTS CTW–1 CTW–2.5 MGA MND MXD–1 MXD–2.5 MXS Summer 1.0000 0.8763 0.8152 0.7904 0.6962 0.7637 0.8513 0.7599 0.7931 0.7279 0.6917 1.0000 0.7760 0.7820 0.5633 0.7192 0.8253 0.7807 0.6626 0.7853 0.6666 1.0000 0.8835 0.7660 0.7803 0.9235 0.8218 0.8175 0.8207 0.8262 1.0000 0.7054 0.8780 0.9021 0.9238 0.7668 0.8554 0.7767 1.0000 0.7783 0.7647 0.6656 0.8691 0.7429 0.7471 1.0000 0.8525 0.8853 0.8209 0.8728 0.7129 1.0000 0.8660 0.8506 0.8378 0.7686 1.0000 0.7788 0.8654 0.7510 1.0000 0.7795 0.7198 1.0000 0.8003 1.0000 Winter 1.0000 0.9367 0.9055 0.9398 0.9649 0.9405 0.8427 0.9379 0.9520 0.8886 0.9420 1.0000 0.9869 0.9883 0.9062 0.9879 0.9643 0.9835 0.9463 0.9799 0.9911 1.0000 0.9864 0.8715 0.9752 0.9726 0.9774 0.9170 0.9777 0.9853 1.0000 0.9113 0.9880 0.9548 0.9857 0.9499 0.9717 0.9921 1.0000 0.9224 0.8123 0.9145 0.9378 0.8596 0.9138 1.0000 0.9481 0.9812 0.9471 0.9691 0.9884 1.0000 0.9462 0.8842 0.9823 0.9550 1.0000 0.9429 0.9640 0.9855 1.0000 0.9332 0.9633 1.0000 0.9787 1.0000 The metal contents in both the PM modes were compared for the three sites where both PM2.5 and PM1 were monitored (i.e.
MXW, MXD and CTW). In Figure S1 (see the SM) the concentrations of the metals normalized by PM are reported. Some elements such as As and Al showed a preferential partition into the PM1 fraction,
whereas Fe, Mn and Cu tend to accumulate in the coarse mode. The other elements studied showed a similar distribution between the two size fractions. It has been reported that the elements associated to road traffic abrasion products (mainly from tires and brakes) such as Cu, Mn, and Fe (Schauer et al., 2006; Wahlin et al., 2006) are preferentially distributed in the coarse mode (68–95% in the fraction PM10–1). These elements possibly derive from topsoil
erosion and dust resuspension (Perrino et al., 2014). On the contrary, for trace elements, it has been reported that elements associated with fossil fuel combustion (V and Ni) or other high temperature industrial processes (As, Cd and Pb) mostly occur in fine particles (50–82% in the PM1 fraction).
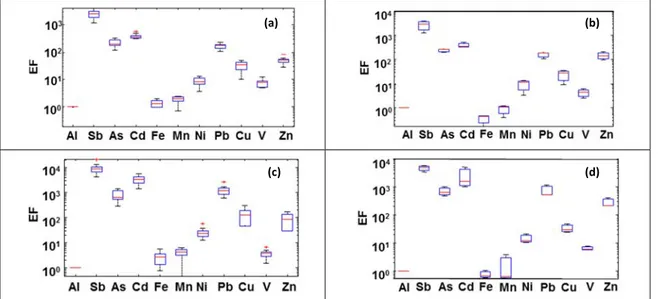
To investigate the extent of the contribution of anthropogenic emissions to atmospheric elemental levels, the enrichment factor (EF) was estimated as the ratio of each element’s abundance in PM samples to its average abundance in the upper continental crust (UCC), by selecting Al as the reference element. The EF for any element X relative to crustal material is defined by:
(1)
where, EFX is the enrichment factor of X, Y is a reference element
for crustal material (Al, see above), (X/Y)air is the concentration
ratio of X to Y in the aerosol sample, and (X/Y)crust is the average
concentration ratio of X to Y in the crust.
The UCC composition was retrieved from Mason (1966). Typically, elements with an EF greater than 10 are considered to derive mostly from anthropogenic sources, whereas elements with
an EF approaching 1 are considered mainly of crustal origin (Birmili et al., 2006). In Figures 4a and 4b, it can be seen a remarkable enrichment for Cu, Zn, Pb and Sb in PM2.5 indicating their possible
anthropogenic origin. A similar trend was observed also for PM1
(see Figures 4c and 4d). Incinerator plants are potential sources of these elements. However these metals can be originated also by other combustion sources and in particular from vehicular emissions and fossil combustion (Lough et al., 2005; Schauer et al., 2006). Similarly, Ni was enriched in both PM modes, but to a lesser extent, suggesting its mainly anthropogenic sources such as oil combustion, vehicular emissions and industrial activities (Marcazzan et al., 2001; Lough et al., 2005).
3.3. Water solubility of individual metals
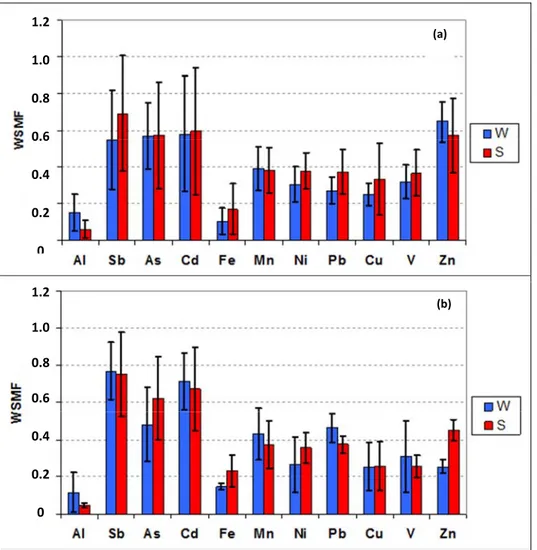
The water soluble metal (WSM) components of particles have been shown to be one of the main responsible for PM–induced toxicity (Knaapen et al., 2002; Cheung et al., 2012). The averaged WSM concentration of the studied elements, calculated on all sampling sites, constitutes solely the 0.71% of the total PM2.5 mass
in summer and it decreases in winter (0.41%).
The most soluble metals in the PM2.5 fraction were Zn, Cd, As
and Sb, the least soluble were Al and Fe, while elements with medium solubility (10–40%) were Mn, Cu and Pb (see Figure 5a). For some elements (Cd, Sb and Pb) a size–dependent solubility was detected: in particular, solubility was higher in the fine size range (see Figure 5b).
This behavior can be due to diverse sources of metal compounds characterized by different solubilities. Moreover, the chemical and dimension fractionation of the aerosol can increase the selectivity of elements as source tracers (Canepari et al., 2014). In general, anthropogenic sources give rise to particulate matter containing a higher proportion of WSM. This is especially true for
the particulate generated from high–temperature combustion processes. On the contrary, metals from crustal sources, such as from alumino–silicate samples, are generally weakly soluble (Desboeufs et al., 2005). It can also be noticed that the elements having high water solubility were also characterized by a large EF values (see Figures 4 and 5), thus confirming the contribution of anthropic sources for these elements. The water soluble fractions determined for PM2.5 (see Figure 5a) were in good agreement with
those reported in a previous study carried out in Birmingham, UK, particularly for Fe, Mn, Cu, Ni (<0.1, 0.3, 0.25, 0.25, respec‐ tively) (Birmili et al., 2006). Principal component analysis (PCA) was performed on the data of metal concentrations and their soluble fractions (see Sections 3.4 and 3.5).
3.4. Seasonal variation
The concentration (μg m–3) data of the two campaigns were
divided by the particulate matter concentration in μg m–3 to obtain
data in μg μg–1 unit. These transformed data were analyzed by PCA
and the corresponding 3D plots are shown in Figures S2 and S3 (see the SM). The scores of the total metals (see Figure S2) are clearly separated into two clusters along PC1 corresponding to winter (W) and summer (S) data respectively. A similar trend was also observed for the metal soluble fraction (see the SM, Figure S3). The sum of the metal concentrations in μg m–3 in summer and
winter were similar to each other, but, at the same time the quantity of particulate matter increases in the cold season, the result of combining these two effects was a reduction of the metal concentrations (in μg μg–1), in the suspended solid collected in
winter. The increase of particle concentration in winter was attributed to the frequent and persistent thermal inversions at ground level during the cold season in the Po Valley (Marcazzan et al., 2001; Daher et al., 2012). Possibly, it was also due to increased accumulation of particles of the nucleation mode due to the high relative humidity of the atmosphere, as well as to the less efficient removal of particles of the finest size fraction by rains. The loadings of PC1 with respect to the PM composition indicated that the concentrations of trace elements for unit PM weight in winter was lower than in summer with exception of Cd and Pb. Vehicles emissions, industrial processes and resuspended road dust could be ascribed as Pb sources whereas Cd mainly originates from metal smelting and combustion processes (Vecchi et al., 2004; Schauer et al., 2006). A higher concentration of anthropogenic elements in the cold season has already been reported (Marcazzan et al., 2001; Bell et al., 2007). Cold/warm concentration ratios higher than 1 were observed in the 0.8–1.3 μm size fraction for some metals such Cd (3.6), Cu (3.7), Pb (2.8) On the contrary, concentration ratios below
1 were observed for Fe, Cu and Mn suggesting preferable air intake of these metals during the dry period of the year, probably from road resuspended dust (Samara and Voutsa, 2005). The different chemical composition of the two size classes (i.e. PM1 and PM2.5)
are discussed in the following section.
3.5. Multivariate data analysis
PCA and cluster analysis (CA) were performed on average chemical compositional data obtained from the two campaigns separately (expressed as μg μg–1, see above), in order to minimize
the effects due to seasonal variation. In this work, solely the PCA of the WSM concentrations in PM1 and PM2.5 were considered.
Figure 6 shows the scores of WSM for the PM collected during summer and the variable loadings in the space of the first three principal components, which explain for more than 70% of the total variance. The first principal component (PC1) differentiates the PM1 from PM2.5. Since almost all variables have similar weights
on the first PC, it can be hypothesized that this PC is related to the elemental concentration and not to the concentration of some specific metals; indeed, the two PM fractions (i.e. PM1 and PM2.5)
differed in almost all metal concentrations, independently of the sampled site. Generally, the metal concentration for unit weight of particle matter was lower for the finest fraction as indicated from the low PC1 scores of PM1. Among the PM2.5, PC1 discriminates
urban and suburban sites (MGA and CAS, respectively) from all the other ones, thus revealing that the content of soluble metals (especially Fe, Mn, Cu, Sb) in these two sites was lower than the average. The compositional differences of the urban sites are more evident in the PC2/PC3 scores and are related to a higher content of Zn and V than the average. This finding agrees well with the fact that MGA and CAS seem to be more influenced by traffic. In fact, MGA represents the urban background, so it is reasonable to suppose that traffic markers were found there, whereas the contributions due to industrial activities or fossil combustion processes were scarce. A previous study carried out in the same geographical area (Morselli et al., 2003) indicated fuel burning as a possible source of Zn and V, although it was mentioned that these metals could also derive from metallurgical activities, in particular those involving alloy steels. Finally, MGA is characterized by high PC3 loading, with a Ni water soluble content higher than the average. Ni has also been classified as a metal associated to vehicular traffic (Manoli et al., 2002). The sites of the suburban area around the incinerator have similar PC1 scores. This finding indicates that these sites showed a similar composition in water soluble metals.
Figure 4. Enrichment factors (EF) for the metals in PM2.5in (a) summer and (b) winter and in PM1in (c) summer and (d) winter.
(a) (b)
Figure 5. Water solubility mass fraction (WSMF) in summer (red) and in winter (blue), with the respective standard deviations: (a) PM2.5 and (b) PM1.
Figure 7 shows the scores and loading plots obtained by PCA for the samples collected during the cold season. The sites can be grouped into four clusters. Similarly to the data collected in summer, also in winter the PM1 composition differed from that of
PM2.5. This difference is conditioned by the variables which mainly
contribute to PC1, characterized by high positive loadings of Fe, Mn, Cu and high negative loadings of Ni and Pb. Therefore, in winter the fine particulate was enriched in elements which are characteristic of anthropic sources (Ni and Pb). This behavior is more evident for MXD–1 which differs from the others PM1 in Cd
and Zn concentrations (high positive loadings on PC3), indicating the presence of a variety of anthropic combustion sources impacting on this site. It can also be observed that the WSM in PM2.5 had quite similar concentrations for all the sites, in fact they
have similar weights on PC1.
However, the PM2.5 can be divided into two clusters by PC2,
which is characterized by high negative loadings for As, V, Cd and positive loading for Sb. Along PC2 the urban (MGA), the suburban (CAS), the summer falling–out maximum and its control (MXS and CTS respectively) sites are located in the positive semi–axis. The high traffic and the rural sites (MXD and MND respectively), the winter falling–out maximum and its control (MXW and CTW respectively) sites are located in the negative semi–axis. Therefore, in these last four sites, As, V and Cd concentrations higher than average have been found, possibly coming from industrial activities or combustion processes. To discriminate between the possible
sources, it should be considered that Morselli et al. (2003) ascribed Ni, Cd and V to industrial and manufacturing activities, which are widespread in the Bologna area. Among combustion processes, waste incinerator doesn’t seem to be the main source of these soluble metals in the particles, since their contents in stack emissions were generally very low, in particular the As concentrations were below the detection limit (see Tables S4 and S5 in the SM). Therefore, it could be inferred that these elements mostly derived from industrial activities. In Figure 7, it can also be noticed that the scores of the sites of the maximum falling–out are close to those of their control sites. Therefore, it could be assessed that these two classes of sites exhibit compositional homogeneity of PM2.5.
4. Conclusions
In this study the concentrations of 11 metals were measured in airborne PM2.5 and PM1 collected at 8 sampling sites around amunicipal incinerator. The mass concentrations revealed greater PM amount collected in winter than in summer. A high correlation between the particulate matter in different sites of the domain and also between PM1 and PM2.5 in co–located sampling sites was
observed. In winter, the correlation was higher than in summer, probably due to atmospheric stagnation conditions. Al and Fe were the most abundant metals while Zn, Cd and As were the elements with higher solubility in water. (a) (b)
1.2
1.0
0.8
0.6
0.4
0.2
0
1.2
1.0
0.8
0.6
0.4
0.2
0
The enrichment factor confirmed that Al and Fe were partially of crustal origin, while the most soluble elements were attributed to anthropogenic sources.
PCA was performed on metals concentrations normalized by the PM amount. Both total content and the water–soluble fraction in PM collected in winter is statistically different from summer, especially for Cd and Pb concentrations. The PCA performed on the data obtained from the two campaigns separately showed that the chemical composition of PM1 is different from that of PM2.5.
Generally, the metal concentration for unit weight of particle matter is lower in the fine fraction. For what concerns the coarser dimensional mode, no differences between the sites chosen as maxima of falling–out and their respective controls was observed.
The urban MGA and the suburban sites CAS generally were characterized by lower total and soluble metals content than other PM2.5 stations.
Acknowledgements
This work was conducted as part of the “MONITER” project, which was supported and financed by Emilia–Romagna Region and the Regional Agency for Prevention and Environment. The authors wish to thank all the members of the MONITER project and in particular dott. Vanes Poluzzi, dott. Linda Passoni, Ing. Arianna Trentini, dott. Fabiana Scotto, dott. Claudio Maccone, dott. Silvia Ferrari, dott. Isabella Ricciardelli. Figure 6. Score and loading plots of water soluble metals for the summer campaign.
Figure 7. Score and loading plots of water soluble metals for the winter campaign.
Supporting Material Available
Stack emissions (S1), Averaged meteorological data recorded at MXW site during the monitoring program (Table S1), Total metal concentrations (ng m–3) in all sampling stations (Table S2), Stack
emissions gravimetric data (Table S3), Stack emissions total metal concentrations (μg m–3) in particulate matter, condensed phase
and after each of the three bubblers (Table S4), Stack emissions of water soluble metal concentrations (µg m–3) in the 3 aliquots of
particulate matter (Table S5), Average metal concentrations in PM2.5 and PM1 monitored in winter (Figure S1), Scores plot and
loadings plots of total metals during the whole sampling period (Figure S2), Scores plot and loadings plots of soluble metals during the whole sampling period (Figure S3). This information is available free of charge via the Internet at http://www.atmospolres.com.
References
Amato, F., Pandolfi, M., Escrig, A., Querol, X., Alastuey, A., Pey, J., Perez, N., Hopke, P.K., 2009. Quantifying road dust resuspension in urban environment by Multilinear Engine: A comparison with PMF2.Atmospheric Environment 43, 2770–2780.
ARPA‐ER (Emilia–Romagna Regional Agency for Prevention and Environment), 2009. Air quality monitoring network‐ overview report 2009, http://www.arpa.emr.it/cms3/documenti/_cerca_doc/aria/ bologna/sintesi_aria_2009.pdf, accessed in February 2015 (in Italian). ARPA‐ER (Emilia–Romagna Regional Agency for Prevention and
Environment), 2008. Air quality monitoring network‐ overview report 2008, http://www.arpa.emr.it/cms3/documenti/_cerca_doc/aria/ bologna/sintesi_aria_2008.pdf, accessed in February 2015 (in Italian).
Bell, M.L., Dominici, F., Ebisu, K., Zeger, S.L., Samet, J.M., 2007. Spatial and temporal variation in PM2.5 chemical composition in the United States
for health effects studies. Environmental Health Perspectives 115, 989– 995.
Bernetti, A., De Lauretis, R., Iarocci, G., Lena, F., Marra Campanale, R., Taurino, E., 2010. Road Transport. National Emission Inventory and Provincial Disaggregation, Technical Report 124, ISPRA: National Institute for Environmental Protection and Research, Rome, Italy (in Italian).
Besombes, J.L., Maitre, A., Patissier, O., Marchand, N., Chevron, N., Stoklov, M., Masclet, P., 2001. Particulate PAHs observed in the surrounding of a municipal incinerator. Atmospheric Environment 35, 6093–6104. Bigi, A., Ghermandi, G., 2014. Long–term trend and variability of
atmospheric PM10 concentration in the Po Valley. Atmospheric
Chemistry and Physics 14, 4895–4907.
Birmili, W., Allen, A.G., Bary, F., Harrison, R.M., 2006. Trace metal concentrations and water solubility in size–fractionated atmospheric particles and influence of road traffic. Environmental Science &
Technology 40, 1144–1153.
Bonafe, G., Rossi, M., 2011. H14–119 where monitoring meets modeling: Application of a dispersion model in the design of a monitoring campaign. Proceedings of the 14th International Conference on
Harmonization within Atmospheric Dispersion Modelling for Regulatory Purposes, October 2–6, 2011, Kos, Greece, pp. 192–195. Canepari, S., Astolfi, M.L., Farao, C., Maretto, M., Frasca, D., Marcoccia, M.,
Perrino, C., 2014. Seasonal variations in the chemical composition of particulate matter: A case study in the Po Valley. Part II: Concentration and solubility of micro– and trace–elements. Environmental Science
and Pollution Research 21, 4010–4022.
Celo, V., Dabek–Zlotorzynska, E., 2010. Concentration and source origin of trace metals in PM2.5 collected at selected Canadian sites within the
Canadian National Air Pollution Surveillance Program, in Urban
Airborne Particulate Matter, Environmental Science and Engineering,
edited by Zereini F., Wiseman C. L. S., Springer–Verlag Berlin Heidelberg.
Chang, M.B., Huang, C.K., Wu, H.T., Lin, J.J., Chang, S.H., 2000. Characteristics of heavy metals on particles with different sizes from municipal solid waste incineration. Journal of Hazardous Materials 79, 229–239.
Cheng, Y., Lee, S.C., Cao, J.J., Ho, K.F., Chow, J.C., Watson, J.G., Ao, C.H., 2009. Elemental composition of airborne aerosols at a traffic site and a suburban site in Hong Kong. International Journal of Environment and
Pollution 36, 166–179.
Cheung, K., Shafer, M.M., Schauer, J.J., Sioutas, C., 2012. Diurnal trends in oxidative potential of coarse particulate matter in the Los Angeles Basin and their relation to sources and chemical composition.
Environmental Science & Technology 46, 3779–3787.
Chow, J.C., Watson, J.G., Mauderly, J.L., Costa, D.L., Wyzga, R.E., Vedal, S., Hidy, G.M., Altshuler, S.L., Marrack, D., Heuss, J.M., Wolff, G.T., Pope, C.A., Dockery, D.W., 2006. Health effects of fine particulate air pollution: Lines that connect. Journal of the Air & Waste Management
Association 56, 1368–1380.
Daher, N., Ruprecht, A., Invernizzi, G., De Marco, C., Miller–Schulze, J., Heo, J.B., Shafer, M.M., Shelton, B.R., Schauer, J.J., Sioutas, C., 2012. Characterization, sources and redox activity of fine and coarse particulate matter in Milan, Italy. Atmospheric Environment 49, 130– 141.
Desboeufs, K.V., Sofikitis, A., Losno, R., Colin, J.L., Ausset, P., 2005. Dissolution and solubility of trace metals from natural and anthropogenic aerosol particulate matter. Chemosphere 58, 195–203. Donnelly, J.R., 1992. Metal emissions control technologies for waste
incineration, in Clean Energy from Waste and Coal, edited by Khan, M.R., American Chemical Society, pp 174–188.
European Standard EN 14902, 2005. Ambient air quality‐Standard method for the measurement of Pb, Cd, as and Ni in the PM10 fraction of
suspended particulate matter, Brussels.
Henshaw, J.M., Heithmar, E.M., Hinners, T.A., 1989. Inductively coupled plasma mass–spectrometric determination of trace–elements in surface waters subject to acidic deposition. Analytical Chemistry 61, 335–342.
Hu, C.W., Chao, M.R., Wu, K.Y., Chang–Chien, G.P., Lee, W.J., Chang, L.W., Lee, W.S., 2003. Characterization of multiple airborne particulate metals in the surroundings of a municipal waste incinerator in Taiwan.
Atmospheric Environment 37, 2845–2852.
Kegler, S.R., Wilson, W.E., Marcus, A.H., 2001. PM1, intermodal (PM2.5–1)
mass, and the soil component of PM2.5 in Phoenix, AZ, 1995–1996.
Aerosol Science and Technology 35, 914–920.
Knaapen, A.M., Shi, T.M., Borm, P.J.A., Schins, R.P.F., 2002. Soluble metals as well as the insoluble particle fraction are involved in cellular DNA damage induced by particulate matter. Molecular and Cellular
Biochemistry 234, 317–326.
Lampa, E., Lind, L., Hermansson, A.B., Salihovic, S., van Bavel, B., Lind, P.M., 2012. An investigation of the co–variation in circulating levels of a large number of environmental contaminants. Journal of Exposure Science
and Environmental Epidemiology 22, 476–482.
Larsen, B.R., Gilardoni, S., Stenstrom, K., Niedzialek, J., Jimenez, J., Belis, C.A., 2012. Sources for PM air pollution in the Po Plain, Italy: II. Probabilistic uncertainty characterization and sensitivity analysis of secondary and primary sources. Atmospheric Environment 50, 203– 213.
Lonati, G., Giugliano, M., Butelli, P., Romele, L., Tardivo, R., 2005. Major chemical components of PM2.5 in Milan (Italy). Atmospheric
Environment 39, 1925–1934.
Lough, G.C., Schauer, J.J., Park, J.S., Shafer, M.M., Deminter, J.T., Weinstein, J.P., 2005. Emissions of metals associated with motor vehicle roadways. Environmental Science & Technology 39, 826–836. Manoli, E., Voutsa, D., Samara, C., 2002. Chemical characterization and
source identification/apportionment of fine and coarse air particles in Thessaloniki, Greece. Atmospheric Environment 36, 949–961. Marcazzan, G.M., Vaccaro, S., Valli, G., Vecchi, R., 2001. Characterisation of
PM10 and PM2.5 particulate matter in the ambient air of Milan (Italy).
Atmospheric Environment 35, 4639–4650.
Mason, B., 1966. Principles of Geochemistry, 3rd edition, Wiley, New York,
pp. 46–47.
Matta, E., Facchini, M.C., Decesari, S., Mircea, M., Cavalli, F., Fuzzi, S., Putaud, J.P., Dell'Acqua, A., 2003. Mass closure on the chemical species in size–segregated atmospheric aerosol collected in an urban area of the Po Valley, Italy. Atmospheric Chemistry and Physics 3, 623–637. Morselli, L., Olivieri, P., Brusori, B., Passarini, F., 2003. Soluble and insoluble
fractions of heavy metals in wet and dry atmospheric depositions in Bologna, Italy. Environmental Pollution 124, 457–469.
NRC (National Research Council), 2000. Waste Incineration and Public Health, National Academy, Washington, DC, pp. 140–155.
Ntziachristos, L., Ning, Z., Geller, M.D., Sheesley, R.J., Schauer, J.J., Sioutas, C., 2007. Fine, ultrafine and nanoparticle trace element compositions near a major freeway with a high heavy–duty diesel fraction.
Atmospheric Environment 41, 5684–5696.
Perrino, C., Catrambone, M., Dalla Torre, S., Rantica, E., Sargolini, T., Canepari, S., 2014. Seasonal variations in the chemical composition of particulate matter: A case study in the Po Valley. Part I: Macro– components and mass closure. Environmental Science and Pollution
Research 21, 3999–4009.
Perrone, M.G., Gualtieri, M., Ferrero, L., Lo Porto, C., Udisti, R., Bolzacchini, E., Camatini, M., 2010. Seasonal variations in chemical composition and in vitro biological effects of fine PM from Milan. Chemosphere 78, 1368–1377.
Pope III, C.A., Dockery, D.W., 2006. Health effects of fine particulate air pollution: lines that connect. Journal of Air and Waste Management
Association 56, 709–742.
Prophete, C., Maciejczyk, P., Salnikow, K., Gould, T., Larson, T., Koenig, J., Jaques, P., Sioutas, C., Lippmann, M., Cohen, M., 2006. Effects of select PM–associated metals on alveolar macrophage phosphorylated ERK1 and–2 and INOS expression during ongoing alteration in iron homeostasis. Journal of Toxicology and Environmental Health–Part A–
Current Issues 69, 935–951.
Samara, C., Voutsa, D., 2005. Size distribution of airborne particulate matter and associated heavy metals in the roadside environment.
Chemosphere 59, 1197–1206.
Schauer, J.J., Lough, G.C., Shafer, M.M., Christensen, W.F., Arndt, M.F., DeMinter, J.T., Park, J.S., 2006. Characterization of metals emitted from motor vehicles. Research Report Health Effects Institute 113, 1– 98.
U.S. EPA (U.S. Environmental Protection Agency), 2000. National Air Pollutant Emission Trends 1900–1998, http://www.epa.gov/ttnchie1/ trends/trends98/trends98.pdf, accessed in February 2015.
Vecchi, R., Marcazzan, G., Valli, G., 2007. A study on nighttime–daytime PM10 concentration and elemental composition in relation to
atmospheric dispersion in the urban area of Milan (Italy). Atmospheric
Environment 41, 2136–2144.
Vecchi, R., Marcazzan, G., Valli, G., Ceriani, M., Antoniazzi, C., 2004. The role of atmospheric dispersion in the seasonal variation of PM1 and
PM2.5 concentration and composition in the urban area of Milan (Italy).
Atmospheric Environment 38, 4437–4446.
Verma, V., Shafer, M.M., Schauer, J.J., Sioutas, C., 2010. Contribution of transition metals in the reactive oxygen species activity of PM emissions from retrofitted heavy–duty vehicles. Atmospheric
Environment 44, 5165–5173.
Wahlin, P., Berkowicz, R., Palmgren, F., 2006. Characterisation of traffic– generated particulate matter in Copenhagen. Atmospheric Environment 40, 2151–2159.