Original Paper
Ophthalmologica 2014;232:163–169 DOI: 10.1159/000362177
Reproducibility and Repeatability of
Ganglion Cell-Inner Plexiform Layer
Thickness Measurements in Healthy Subjects
Paolo Carpineto Agbeanda Aharrh-Gnama Vincenzo Ciciarelli
Alessandra Mastropasqua Luca Di Antonio Lisa Toto
Ophthalmology Clinic, University ‘G. d’Annunzio’ Chieti-Pescara, Chieti , Italy
Introduction
High-definition optical coherence tomography (HD-OCT) is a widely used imaging method for assessing the peripapillary retinal nerve fiber layer (RNFL) thickness, optic nerve head and macula. HD-OCT can be used to obtain images of the retina and its various anatomical layers with a high resolution and a good reproducibility [1, 2] .
Recent advances in segmentation algorithms have in-creased the ability of separating and demarcating indi-vidual retinal layers [2] . The retinal ganglion cell layer (GCL) was reported to be the early site of glaucomatous damage, as shown in experimental models [3, 4] . Recent studies also showed that the segregated ganglion cell complex (GCC), which in the macular regions is the sum of RNFL, GCL and inner plexiform layer (IPL), has a sim-ilar capacity of discriminating glaucoma compared with RNFL thickness [5] . In addition, in nonarteritic ischemic optic neuropathy, hemispheric GCC loss correlated with altitudinal visual field loss [6] , and in patients with mini-mal diabetic retinopathy, the GCL in the pericentral area of the macula was thinner than in normal control subjects [7, 8] .
The latest HD-OCT ganglion cell analysis (GCA) algo-rithm (Cirrus version 6.0; Carl Zeiss Meditec, Dublin, Ca-lif., USA) can successfully demarcate the macular gan-glion cell-IPL (GC-IPL) while excluding the RNFL.
Key Words
Glaucoma diagnostics · Macula · Optical coherence tomography
Abstract
Purpose: To assess the reproducibility and repeatability of macular ganglion cell-inner plexiform layer (GC-IPL) thick-ness measurements in healthy subjects. Procedures: In this observational study, 60 healthy eyes were subjected to mac-ular GC-IPL thickness measurements by means of Cirrus TM
high-definition optical coherence tomography (Cirrus ver-sion 6.0; Carl Zeiss Meditec, Dublin, Calif., USA) by two exam-iners in two sessions. Average, minimum and 6 sectoral GC-IPL thicknesses were measured. Inter- and intraobserver re-producibility was tested and analyzed by means of the concordance correlation coefficient (CCC). The repeatability of measurements was assessed by the coefficient of repeat-ability (CR). Results: Mean age (±SD) was 29.63 (±5.1) years. The CRs for average GC-IPL thickness were 2.1 and 2.2 μm for the first and the second operator, respectively. Inter- and in-traobserver CCCs ranged from 0.91 (95% CI: 0.89–0.93) to 0.98 (95% CI: 0.96–0.99) and from 0.92 (95% CI: 0.88–0.94) to 0.98 (95% CI: 0.97–0.99), respectively. Conclusions: GC-IPL thickness measurements in young healthy subjects showed excellent reproducibility and repeatability, especially for av-erage and sectoral GC-IPL thickness measurements.
© 2014 S. Karger AG, Basel
Received: November 18, 2013 Accepted after revision: March 7, 2014 Published online: August 8, 2014
Reproducibility and repeatability are two of the main principles upon which scientific method are based and are an indicator of the applicability of any instrument as a diagnostic tool in clinical practice. They refer to the de-gree of ade-greement between independent measurements obtained with the same method/instrument on identical test material under different conditions (i.e., different op-erators) and under the same condition (i.e., same opera-tor in consecutive measurements), respectively.
Recent studies [2, 9, 10] reported excellent intersession and intervisit reproducibility of macular GC-IPL mea-surement performed by a single operator both for healthy and glaucomatous eyes.
The aim of this study was to evaluate both the intra- and intersession reproducibility and the repeatability of macu-lar GC-IPL thickness measurements performed by two operators using Cirrus TM HD-OCT in healthy subjects.
Patients and Methods
The study was performed at the Ophthalmology Clinic of the University of Chieti-Pescara, Italy. A total of 60 healthy volunteers aged between 19 and 49 years were enrolled in the study. The study adhered to the tenets of the Declaration of Helsinki and was ap-proved by the local Ethics Committee. Informed consent was ob-tained prior to the session.
Each subject underwent a comprehensive ophthalmic exami-nation, including a review of the medical history, best-corrected visual acuity (using an Early Treatment Diabetic Retinopathy Study chart), slit-lamp biomicroscopy, intraocular pressure mea-surement with Goldmann applanation tonometry, central corneal pachymetry, gonioscopy, dilated funduscopic examination using a 78-dpt lens and visual field testing. Humphrey 30-2 Swedish inter-active thresholding algorithm (Carl Zeiss Meditec) visual field test-ing was used.
To be included, subjects had to have the following: (1) a best-corrected visual acuity of 20/25 or better, (2) spherical refraction within ±3.0 dpt, (3) cylinder correction within ±2.0 dpt, (4) open angles on gonioscopy (Shaffer classification), (5) intraocular pres-sure of 21 mm Hg or less, (6) no conditions that increase the risk for secondary glaucoma (pigment dispersion syndrome or pseudo-exfoliation) and (7) a healthy appearance of the macula lutea, the optic disc and the RNFL (no diffuse or focal rim thinning, cupping, optic disc hemorrhage, or RNFL defects), as evaluated by fundu-scopic examination. Subjects were declared healthy if visual field mean deviation, pattern standard deviation (SD) and the glaucoma hemifield test were all within normal limits for at least 2 consecu-tive reliable visual field tests obtained within 3 months from the OCT examination. Visual fields were considered reliable if fixation loss and false-negative and false-positive results were less than 30%. Subjects were excluded for the following reasons: (1) if they had any previous history of ocular disease, surgery, laser or medical treat-ments, or any systemic disease with ocular involvement, (2) if vi-sual field mean deviation or pattern SD was below 5% cutoffs or (3) if the glaucoma hemifield test was outside normal limits in at least
2 reliable visual field tests. If the glaucoma hemifield test was bor-derline, mean and pattern SD were <10% but >5% or defects were inconsistent between visual fields, the subject was categorized as ‘glaucoma suspect’ and was removed from the data set.
Eyes with optical medium opacity, maculopathy, retinal dis-ease, uveitis, or glaucomatous or nonglaucomatous optic neuropa-thy were excluded from the investigation.
Imaging with Cirrus HD-OCT
The Cirrus HD-OCT used in this study is a commercially avail-able device with a scan speed of 27,000 axial scans per second and an axial resolution of 5 μm [11] . After pupil dilation using tropicamide 1% and phenylephrine hydrochloride 2.5%, Cirrus HD-OCT was used to acquire 1 macular scan using the macular cube 512 × 128 scan protocol in each study eye. The GCA algorithm, incorporated in Cir-rus HD-OCT software version 6.5, was used to process and measure the thickness of macular GC-IPL within a 14.13-mm 2 elliptical
an-nulus area centered on the fovea. The GCA algorithm automatically segmented the GC-IPL based on the three-dimensional data gener-ated from the macular cube 512 × 128 scan protocol. The outer boundary of the RNFL and the outer boundary of the IPL at the macular region were segmented by the algorithm; the segmented layer thus yielded a measurement of the GC-IPL thickness. The aver-age, minimum and 6 sectoral GC-IPL thicknesses (superotemporal, superior, superonasal, inferonasal, inferior, and inferotemporal) were measured from the elliptical annulus centered on the fovea. The elliptical annulus has the following dimensions: vertical inner and outer radius of 0.5 and 2.0 mm, respectively, and horizontal inner and outer radius of 0.6 and 2.4 mm, respectively. This size and shape of elliptical annulus were chosen as they conform closely to the real macular anatomy, and the annulus corresponds to the area where the retinal GCL is thickest in normal eyes [2, 12] .
The minimum GC-IPL measurement was determined by sam-pling 360 spokes of measurements extending from the center of the fovea to the edge of the elliptical annulus in 1-degree intervals and selecting the spoke with the lowest average.
A detailed description of the GCA scanning was reported else-where [2] . In brief, during image acquisition, the subject’s pupil was first centered and focused in the iris viewport and the line-scanning ophthalmoscope with ‘‘auto focus’’ mode was then used to optimize the view of the retina. The ‘‘center’’ and ‘‘enhance’’ modes were used to optimize the Z-offset and scan polarization, respectively, for the OCT scan in order to maximize the OCT sig-nal. After each capture, motion artifacts were checked with the line-scanning ophthalmoscope image with an en face OCT over-lay. Rescanning was performed if a motion artifact (indicated by blood vessel discontinuity) was detected. The HD-OCT scans were excluded if the retinal layer algorithm segmentation failed. All HD-OCT scans included in the study had a signal strength of at least 6, and we selected 1 eye from each participant randomly for final analysis.
Two different sessions of measurements were performed in 1 randomly selected eye of each subject at time 0 and after 30 days; the randomization was generated by using the Random Number Generator Pro 1.89, a free software available online.
In the first session 2 measurements of GC-IPL thickness were made using the Cirrus HD-OCT unit, each by two different exam-iners who had been trained in the use of the device. After 1 h, mea-surements were repeated in the same fashion but inverting the or-der of the examiners.
At the end of the first session, each eye had received 2 macular scans by each examiner. At the second session, the scans were re-peated by the same two examiners using the same Cirrus HD-OCT unit. To minimize systematic bias, both examiners were masked with respect to subjects. After each scan acquisition, the examiners had no information on measurements at their disposal. GC-IPL thickness measurements were calculated only at the end of the sec-ond session.
An internal fixation light was used to center the scanning area on the fovea. Only scans with no interfering noise or artifacts were included in the study, and each individual scan was reviewed for aberrant placement of the inner and outer GC-IPL borders.
Scans with low quality and a failing GC-IPL thickness algo-rithm were excluded, and measurements were repeated until good quality was achieved. The quality score had to be higher than 6 out of 10. In addition, scans with blinks during the scanning process were excluded and repeated.
Statistical Analysis
The D’Agostino-Pearson test that computes a single p value for the combination of the coefficients of skewness and kurtosis was used to study the sample distribution. Intra- and intersession re-producibility was evaluated by means of the concordance correla-tion coefficient (CCC). The CCC evaluates the degree to which pairs of observations fall on the 45-degree line through the origin [13] . It contains a measurement of precision ρ (the Pearson cor-relation coefficient, which measures how far each observation de-viates from the best-fit line) and accuracy C b (a bias correction
factor that measures how far the best-fit line deviates from the 45-degree line through the origin): ρ c = ρ C b .
The Bland-Altman plot was used to assess the repeatability of the method by comparing repeated measurements for each single examiner [14] . Since the same method is used for the repeated measurements, the mean difference should be zero. The coefficient of repeatability (CR) was calculated as 1.96 (approx. 2) times the SD of the differences between the measurements.
Results
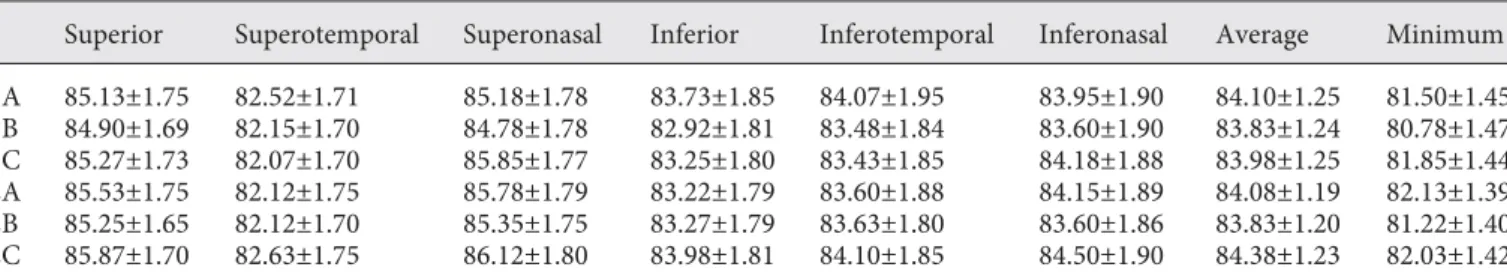
A total of 60 eyes of 60 subjects (21 males and 39 fe-males) underwent GC-IPL thickness measurements with the previous described protocol. All the eyes that provid-ed high-quality scans were prospectively includprovid-ed in the study. The sample age ranged from 19 to 49 years (mean 29.63 years, SD ±5.1 years). Additional demographic and clinical characteristics of the enrolled subjects are report-ed in table 1 . GC-IPL thickness measurements are shown in table 2 .
Average GC-IPL thickness data showed normal distri-bution, ranging from 83.83 to 84.10 μm for the first op-erator and from 83.83 to 84.38 μm for the second opop-erator. As calculated by means of Bland-Altman plots ( fig. 1 , 2 ), CRs for average GC-IPL thickness were 2.1 and 2.2 μm for the first and the second operator, respectively ( ta-ble 3 ).
Interobserver intrasession CCCs for the GC-IPL aver-age were 0.98 (95% CI: 0.96–0.99) for the first session and 0.96 (95% CI: 0.94–0.97) for the second session ( table 4 ).
Intraobserver intersession CCCs for the GC-IPL aver-age were 0.98 (95% CI: 0.97–0.99) for the first session and 0.97 (95% CI: 0.94–0.98) for the second session ( table 5 ).
Minimum GC-IPL thickness data showed normal dis-tribution, ranging from 80.78 to 81.85 μm for the first operator and from 81.22 to 82.13 μm for the second op-erator.
As calculated by means of Bland-Altman plots, CRs for minimum GC-IPL thickness were 9.0 and 6.3 μm for the first and the second operator, respectively ( table 3 ).
For the 6 sectoral measurements, CRs ranged from 3.3 (superotemporal sector) to 7.5 μm (inferior sector) and from 1.7 (inferotemporal sector) to 4.5 μm (inferonasal sector) for the first and the second operator, respectively ( table 3 ).
Interobserver intrasession and intraobserver interses-sion CCCs are shown in tables 4 and 5 , respectively.
Discussion
HD-OCT has been widely used to image the retina and its various anatomic layers with high resolution and good reproducibility [1, 2, 15–17] . Recent advances in segmen-tation algorithms have further allowed detailed separa-tion and demarcasepara-tion of individual retinal layers [2] . The study of retinal GCL by means of OCT has gained in-creasing interest as the GCL has been hypothesized to be the early site of neurodegeneration in glaucoma, diabetic retinopathy and demyelinating diseases [2, 5, 7, 8, 18–24] . The GCC, which is the sum of RNFL, GCL and IPL at macular regions, has similar glaucoma-discriminating performance compared with RNFL thickness [5] .
Table 1. Patient demographics and characteristics
Age, years 29.63±5.1
Gender, M/F 21/39
Eye, R/L 31/29
Intraocular pressure, mm Hg 14.1±2.5
Visual field mean deviation, dB +0.5±0.9
Central corneal thickness, μm 537.3±22.5
OCT foveal thickness, μm 252.34±7.23
Data are presented as means ± SD or ratios. M = Male; F = fe-male; R = right; L = left.
Table 3. Coefficients of repeatability of GC-IPL thickness measurements (μm)
Average Minimum Superior Superotemporal Superonasal Inferior Inferotemporal Inferonasal
CR (1A vs. 1B) 2.1 9.0 3.7 3.3 5.1 7.5 4.8 6.7
CR (2A vs. 2B) 2.2 6.3 4.1 2.5 4.4 3.3 1.7 4.5
1A: measurements of observer 1 at the first reading of the first session. 1B: measurements of observer 1 at the second reading of the first session. 2A: measurements of observer 2 at the first reading of the first session. 2B: measurements of observer 2 at the second read-ing of the first session.
Table 2. Mean of GC-IPL thickness measurements (μm)
Superior Superotemporal Superonasal Inferior Inferotemporal Inferonasal Average Minimum
1A 85.13±1.75 82.52±1.71 85.18±1.78 83.73±1.85 84.07±1.95 83.95±1.90 84.10±1.25 81.50±1.45 1B 84.90±1.69 82.15±1.70 84.78±1.78 82.92±1.81 83.48±1.84 83.60±1.90 83.83±1.24 80.78±1.47 1C 85.27±1.73 82.07±1.70 85.85±1.77 83.25±1.80 83.43±1.85 84.18±1.88 83.98±1.25 81.85±1.44 2A 85.53±1.75 82.12±1.75 85.78±1.79 83.22±1.79 83.60±1.88 84.15±1.89 84.08±1.19 82.13±1.39 2B 85.25±1.65 82.12±1.70 85.35±1.75 83.27±1.79 83.63±1.80 83.60±1.86 83.83±1.20 81.22±1.40 2C 85.87±1.70 82.63±1.75 86.12±1.80 83.98±1.81 84.10±1.85 84.50±1.90 84.38±1.23 82.03±1.42
Data are presented as means ± SD. 1A: measurements by observer 1 at the first session. 1B: repeated measurements by observer 1 at the same session. 1C: measurements by observer 1 at second session. 2A: measurements by observer 2 at the first session. 2B: repeated measurements by observer 2 at the same session. 2C: measurements by observer 2 at the second session.
Fig. 1. Bland-Altman plot showing intraobserver (observer 1) CRs for average RNFL thickness. 1A represents measurements by ob-server 1 during the first session; 1B represents repeated measure-ments by the same observer during the same session.
Fig. 2. Bland-Altman plot showing intraobserver (observer 2) CRs for average RNFL thickness. 2A represents measurements by ob-server 2 during the first session; 2B represents repeated measure-ments by the same observer during the same session.
Color version available online
Color version available online
–3 –2 –1 70 75 80 85 90 95 100 0 1 2 3 4 1A – 1B (μm) Average of 1A and 1B (μm) +1.96 SD 2.4 –1.96 SD –1.8 Mean 0.3 –3 –2 –1 70 75 80 85 90 95 100 0 1 2 3 6 4 5 2A – 2B (μm) Average of 2A and 2B (μm) +1.96 SD 2.3 –1.96 SD –2.1 Mean 0.1
theless, it was questioned whether the inclusion of RNFL thickness in the GCC thickness measurement (from OCT devices such as Fourier-domain RTVue OCT; Optovue Corp., Fremont, Calif., USA) may have falsely elevated the diagnostic performance of the GCC [2, 12] . In con-trast with this GCC measurement, the latest HD-OCT GCA algorithm (Cirrus HD-OCT software version 6.5; Carl Zeiss Meditec) can successfully demarcate the macu-lar GC-IPL while excluding the RNFL.
Macular GC-IPL topography has been reported to be less variable among normal individuals than other diagnosti-cally important structures such as the optic disc and RNFL [18] , which may make the features of normal macular GC-IPL easier to identify and deviations from normal easier to detect. Recently, the ability of macular GC-IPL parameters to discriminate normal eyes and eyes with early glaucoma was found to be high and comparable to that of the best peri-papillary RNFL and optic nerve head parameters [21] .
van Dijk et al. [7, 8] reported a GCL thickness decrease in the macula as an early neurodegenerative effect on the retina of both types 1 and 2 diabetic patients with mini-mal diabetic retinopathy.
Macular GC-IPL thinning also occurs in multiple scle-rosis eyes with and without optic neuropathy history, and GC-IPL thickness measurements may have better
repro-ducibility and superior structure-function correlations with vision than RNFL thickness measurements [20, 22, 23] .
Ratchford et al. [24] demonstrated that multiple scle-rosis patients with clinical and/or radiological nonocular disease activity, particularly early in the disease course, exhibit accelerated GC-IPL thinning.
The introduction into routine clinical use of new diag-nostic technologies generates a question of the reproduc-ibility and repeatability of measurements. Reproducibil-ity refers to the closeness of agreement between indepen-dent results obtained with the same method on iindepen-dentical test material but under different conditions (different op-erators, apparatus, laboratories and time intervals). Re-peatability is the variability of the measurements obtained by one person while measuring the same item repeatedly under the same condition.
Obviously, as with any new diagnostic technique, the reproducibility and repeatability of GC-IPL thickness measurements obtained with the Cirrus HD-OCT GCA algorithm is of prime clinical importance, being used for monitoring changes in neuroretinal damage indepen-dently from the underlying pathology.
In one of the first reports on the feasibility of thickness measurements of the RGC layer in glaucomatous eyes with
Table 4. Interobserver intrasession reproducibility of GC-IPL thickness measurements
Average Minimum Superior Superotemporal Superonasal Inferior Inferotemporal Inferonasal
CCC (1A vs. 2A) 0.98 0.92 0.93 0.96 0.95 0.95 0.93 0.95
95% CI 0.96–0.99 0.89–0.95 0.88–0.95 0.93–0.97 0.92–0.96 0.92–0.97 0.89–0.95 0.93–0.97
CCC (1C vs. 2C) 0.96 0.91 0.93 0.96 0.93 0.93 0.97 0.95
95% CI 0.94–0.97 0.89–0.93 0.88–0.95 0.93–0.97 0.89–0.96 0.89–0.95 0.96–0.98 0.92–0.97
1A and 2A: measurements at the first session by observer 1 and 2, respectively. 1C and 2C: repeat measurements at the second ses-sion (30 days later) by observer 1 and 2, respectively.
Table 5. Intraobserver intersession reproducibility of GC-IPL thickness measurements
Average Minimum Superior Superotemporal Superonasal Inferior Inferotemporal Inferonasal
CCC (1A vs. 1C) 0.98 0.93 0.94 0.95 0.96 0.94 0.97 0.97
95% CI 0.97–0.99 0.90–0.95 0.91–0.96 0.91–0.96 0.93–0.97 0.91–0.96 0.95–0.98 0.96–0.98
CCC (2A vs. 2C) 0.97 0.92 0.95 0.94 0.96 0.95 0.97 0.96
95% CI 0.94–0.98 0.88–0.94 0.92–0.96 0.89–0.96 0.93–0.97 0.92–0.96 0.95–0.98 0.94–0.97
1A and 1C: measurements by observer 1 at the first session and at the second session (30 days later), respectively. 2A and 2C: mea-surements by observer 2 at the first session and at the second session (30 days later), respectively.
an SD-OCT device (3D-OCT 1000; Topcon Inc., Tokyo, Japan), Wang et al. [19] manually performed their segmen-tation. This may lead to a higher intra- and interobserver variability than that obtainable from an automated system.
DeBuc et al. [1] developed an OCT retinal image anal-ysis software (OCTRIMA) to be used with Stratus OCT and were able to detect and measure intraretinal layers, including the GC-IPL, in normal eyes.
Chiu et al. [25] tested an algorithm that accurately seg-mented the GC-IPL and 7 other retinal layers in normal eyes using a Bioptigen SD-OCT system (Bioptigen Inc., Research Triangle Park, N.C., USA), with a good agree-ment between observers and between manual and auto-matic segmentations.
Compared with the algorithms used by DeBuc et al. [1] , Wang et al. [19] and Chiu et al. [25] , the automated Cirrus HD-OCT GCA algorithm can segment the layers and measure 8 different parameters rather than just the average GC-IPL. This may facilitate objective compari-son and selection of the most appropriate parameters.
In their study of automated detection and thickness reproducibility of GC-IPL with SD-OCT in glaucoma-tous patients, Mwanza et al. [2] used the macular cube 200 × 200 scan protocol and a prototype algorithm (pre-release version), subsequently incorporated in the Cirrus 6.0 software, in 51 eyes of 51 glaucomatous patients. They used 5 scans per eye obtained on 5 days within 2 months and calculated the intervisit reproducibility of GC-IPL measurements using intraclass correlation coefficients (ICCs), coefficients of variation (CV), and test-retest SD (TRTSD). The highest reproducibility values were ob-tained for average GC-IPL and for superior parameters.
Takayama et al. [9] tested the glaucoma-discriminating ability of GC-IPL measurements using Cirrus HD-OCT and, contemporaneously, the intersession variability and reproducibility were assessed by means of ICC, CV and pooled within-subject TRTSD calculation. In normal eyes the best variability and reproducibility results were ob-tained for the average GC-IPL parameter (TRTSDS: 0.77 μm, CV: 0.98%, ICC: 96%). Minimum and inferotemporal GC-IPL were less reproducible parameters.
In a recent study [10] assessing the reproducibility of thickness measurements of macular inner retinal layers using SD-OCT with or without correction of ocular rota-tion, an SD-OCT device (3D OCT-1000, version 2.13; Topcon, Inc.) was used to evaluate the intervisit repro-ducibility of several parameters, including GC-IPL, using the CV, reproducibility coefficient and ICC. The authors reported better and excellent reproducibility of the macu-lar GC-IPL and GCC thickness compared with that of the
RNFL measurement in the macular and circumpapillary areas. In normal eyes, the CVs of the average GC-IPL thickness measurements ranged from 0.46 to 0.56%, while the reproducibility coefficients ranged from 1.35 to 1.64 μm; ICCs ranged from 0.993 to 0.997.
In this observational case series study evaluating re-producibility and repeatability of GC-IPL thickness mea-surements using the most recent commercially available software version (6.5) of Cirrus HD-OCT in young healthy subjects, two experienced examiners indepen-dently performed 2 measurements in the first session and repeated the measurements in the second session 30 days later. Our results showed that the CR of average GC-IPL thickness measurements was excellent, resulting in 2.1 μm for the first operator and 2.2 μm for the second op-erator. Both interobserver intrasession and intraobserver intersession reproducibilities had very high results, with CCC values ranging from 0.91 to 0.99.
Our intersession results were as excellent as in previous studies [2, 9, 10] . However, none of these studies had as-sessed interobserver intrasession reproducibility, which may be of some interest when comparing clinical trials data. High interobserver intrasession reproducibility demonstrates the operator’s ability to carry out a good ex-amination, which depends not only on their own person-al skill but person-also on their ability to use the instrument.
Technically, the high reproducibility may be due to the automatic detection and registration of the center of the macula using the algorithm included in the Cirrus soft-ware before placing the analysis annulus. Repeatability over extensive periods of time plays a particularly impor-tant role in the follow-up of patients with pathologies that have a slow evolution.
In our study, repeatability and reproducibility were slightly lower for minimum GC-IPL compared with aver-age and sectoral GC-IPL.
A possible explanation of these results is the method of measurement of minimum GC-IPL. In fact, minimum GC-IPL is determined by sampling 360 spokes of mea-surements extending from the center of the fovea to the edge of the elliptical annulus in 1-degree intervals and selecting the spoke with the lowest average. Measuring GC-IPL on spokes may lead to lower reproducibility compared with measuring average and sectoral GC-IPL on a cube. In fact, minimum GC-IPL is calculated from only 50–60 sampling points in each B-scan compared with 7,500 sampling points in the macular elliptical an-nulus and 1,100–1,300 sampling points in the 6 sectors.
A limit to the present study is that the study population included only healthy young subjects. In our sample
ex-amination, time may be shorter than in older patients with neurodegenerative diseases. Further studies may be neces-sary to confirm this supposition and to test reproducibility and repeatability in older diseased patients.
In conclusion, the results presented in this study showed excellent reproducibility and repeatability of all 8 parameters in normal eyes, especially for average and sectoral, making the GC-IPL thickness an additional po-tential diagnostic marker for disease detection and
pro-gression in many pathologies involving the GCL. Further investigation will be needed to determine how the GC-IPL performs compared with both GCC and RNFL thick-nesses.
Disclosure Statement
The authors state that they have no financial interest in any of the products mentioned in the study.
References
1 DeBuc DC, Somfai GM, Ranganathan S, Tat-rai E, Ferencz M, Puliafito CA: Reliability and reproducibility of macular segmentation us-ing a custom-built optical coherence tomog-raphy retinal image analysis software. J Biomed Opt 2009; 14: 064023.
2 Mwanza JC, Oakley JD, Budenz DL, Chang RT, Knight OJ, Feuer WJ: Macular ganglion cell-inner plexiform layer: automated detec-tion and thickness reproducibility with spec-tral domain-optical coherence tomography in glaucoma. Invest Ophthalmol Vis Sci 2011; 52: 8323–8329.
3 Desatnik H, Quigley HA, Glovinsky Y: Study of central retinal ganglion cell loss in experi-mental glaucoma in monkey eyes. J Glaucoma 1996; 5: 46–53.
4 Frishman LJ, Shen FF, Du L, Robson JG, Har-werth RS, Smith EL 3rd, Carter-Dawson L, Crawford M: The scotopic electroretinogram of macaque after retinal ganglion cell loss from experimental glaucoma. Invest Oph-thalmol Vis Sci 1996; 37: 125–141.
5 Tan O, Chopra V, Lu AT, Schuman JS, Ishika-wa H, Wollstein G, Varma R, Huang D: Detec-tion of macular ganglion cell loss in glaucoma by Fourier-domain optical coherence tomog-raphy. Ophthalmology 2009; 116: 2305–2314. 6 Aggarwal D, Tan O, Huang D, Sadun AA:
Patterns of ganglion cell complex and nerve fiber layer loss in nonarteritic ischemic optic neuropathy by Fourier-domain optical coher-ence tomography. Invest Ophthalmol Vis Sci 2012; 53: 4539–4545.
7 van Dijk HW, Verbraak FD, Kok PH, Garvin MK, Sonka M, Lee K, Devries JH, Michels RP, van Velthoven ME, Schlingemann RO, Abrà-moff MD: Decreased retinal ganglion cell layer thickness in patients with type 1 diabetes. In-vest Ophthalmol Vis Sci 2010; 51: 3660–3665. 8 van Dijk HW, Verbraak FD, Kok PH,
Stehou-wer M, Garvin MK, Sonka M, DeVries JH, Schlingemann RO, Abràmoff MD: Early neu-rodegeneration in the retina of type 2 diabetic patients. Invest Ophthalmol Vis Sci 2012; 53: 2715–2719.
9 Takayama K, Hangai M, Durbin M, Nakano N, Morooka S, Akagi T, Ohashi Ikeda T, Yo-shimura N: A novel method to detect local
gan-glion cell loss in early glaucoma using spectral-domain optical coherence tomography. Invest Ophthalmol Vis Sci 2012; 53: 6904–6913. 10 Hirasawa H, Araie M, Tomidokoro A, Saito
H, Iwase A, Ohkubo S, Sugiyama K, Ootani T, Kishi S, Matsushita K, Maeda N, Hangai M, Yoshimura N: Reproducibility of thickness measurements of macular inner retinal layers using SD-OCT with or without correction of ocular rotation. Invest Ophthalmol Vis Sci 2013; 54: 2562–2570.
11 Leung CK, Cheung CY, Weinreb RN, Qiu Q, Liu S, Li H, Xu G, Fan N, Huang L, Pang CP, Lam DS: Retinal nerve fiber layer imaging with spectral-domain optical coherence to-mography: a variability and diagnostic per-formance study. Ophthalmology 2009; 116: 1257–1263.
12 Bendschneider D, Tornow RP, Horn FK, Laemmer R, Roessler CW, Juenemann AG, Kruse FE, Mardin CY: Retinal nerve fiber lay-er thickness in normals measured by spectral domain OCT. J Glaucoma 2010; 19: 475–482. 13 Lin LI: A concordance correlation coefficient
to evaluate reproducibility. Biometrics 1989; 45: 255–268.
14 Bland JM, Altman DG: Statistical methods for assessing agreement between two methods of clinical measurement. Lancet 1986; 1: 307–310. 15 Pierro L, Giatsidis SM, Mantovani E, Gagliar-di M: Macular thickness interoperator and in-traoperator reproducibility in healthy eyes us-ing 7 optical coherence tomography instru-ments. Am J Ophthalmol 2010; 150: 199–204. 16 Pierro L, Gagliardi M, Iuliano L, Ambrosi A,
Bandello F: Retinal nerve fiber layer thickness reproducibility using seven different OCT in-struments. Invest Ophthalmol Vis Sci 2012; 53: 5912–5920.
17 Carpineto P, Nubile M, Agnifili L, Toto L, Aharrh-Gnama A, Mastropasqua R, Di Anto-nio L, Fasanella V, Mastropasqua A: Repro-ducibility and repeatability of Cirrus TM HD-OCT peripapillary retinal nerve fibre layer thickness measurements in young normal subjects. Ophthalmologica 2012; 227: 139–145. 18 Curcio CA, Allen KA: Topography of gangli-on cells in human retina. J Comp Neurol 1990; 300: 5–25.
19 Wang M, Hood DC, Cho JS, Ghadiali Q, De Moraes CG, Zhang X, Ritch R, Liebmann JM: Measurement of local retinal ganglion cell lay-er thickness in patients with glaucoma using frequency-domain optical coherence tomog-raphy. Arch Ophthalmol 2009; 127: 875–881. 20 Saidha S, Syc SB, Durbin MK, Eckstein C,
Oakley JD, Meyer SA, Conger A, Frohman TC, Newsome S, Ratchford JN, Frohman EM, Calabresi PA: Visual dysfunction in multiple sclerosis correlates better with optical coher-ence tomography derived estimates of macu-lar ganglion cell layer thickness than peripap-illary retinal nerve fiber layer thickness. Mult Scler 2011; 17: 1449–1463.
21 Mwanza JC, Durbin MK, Budenz DL, Sayyad FE, Chang RT, Neelakantan A, Godfrey DG, Carter R, Crandall AS: Glaucoma diagnostic accuracy of ganglion cell-inner plexiform er thickness: comparison with nerve fiber lay-er and optic nlay-erve head. Ophthalmology 2012; 119: 1151–1158.
22 Seigo MA, Sotirchos ES, Newsome S, Babiarz A, Eckstein C, Ford E, Oakley JD, Syc SB, Frohman TC, Ratchford JN, Balcer LJ, Frohman EM, Calabresi PA, Saidha S: In vivo assessment of retinal neuronal layers in mul-tiple sclerosis with manual and automated op-tical coherence tomography segmentation techniques. J Neurol 2012; 259: 2119–2130. 23 Syc SB, Saidha S, Newsome SD, Ratchford JN,
Levy M, Ford E, Crainiceanu CM, Durbin MK, Oakley JD, Meyer SA, Frohman EM, Ca-labresi PA: Optical coherence tomography segmentation reveals ganglion cell layer pa-thology after optic neuritis. Brain 2012; 135: 521–533.
24 Ratchford JN, Saidha S, Sotirchos ES, Oh JA, Seigo MA, Eckstein C, Durbin MK, Oakley JD, Meyer SA, Conger A, Frohman TC, New-some SD, Balcer LJ, Frohman EM, Calabresi PA: Active MS is associated with accelerated retinal ganglion cell/inner plexiform layer thinning. Neurology 2013; 80: 47–54.
25 Chiu SJ, Li XT, Nicholas P, Toth CA, Izatt JA, Farsiu S: Automatic segmentation of seven retinal layers in SD-OCT images congruent with expert manual segmentation. Opt Ex-press 2010; 18: 19413–19428.