R
esearch
A
rticle
EVALUATION OF AUTOMATED ANALYZERS OF PAHS AND BLACK CARBON IN A COKE
OVEN PLANT
*
Livia Trizio, Lorenzo Angiuli, Roberto Giua, Alessia Digilio, Maria Tutino, Paolo Dambruoso,
Fiorella Mazzone, Claudia Marcella Placentino
Arpa Puglia, C.so Trieste 27, 70126 Bari, Italy
ARTICLE INFO ABSTRACT
In the winter of 2014 a series of measurements were performed to evaluate the behavior of real-time PAHs and black carbon analyzers in a coke oven plant located in Taranto, a city of Southern Italy. Data were collected both inside than outside the plant, at air quality monitoring sites. Contemporary measures of PM2.5 and PM1 were performed.Particle-bound PAHs were measured by two methods: (1) aerosol photoionization using an Ecochem PAS 2000 analyzer, (2) PM2.5 and PM1 quartz filter collection and analysis by gas chromatography/mass spectrometry (GC/MS). Black carbon was determined both in real-time by Magee Aethalometer AE22 analyzerthan by semi-continuous Sunset Lab EC/OC instrument. Detected PM2.5 and PM1 levels were higher inside than outside the plant, while PAHs real-time values were higher outside than inside. As regards PAHs, inside the plant Ecochem PAS 2000 revealed concentrations not significantly different from those determined on filter during low polluted days, but at increasing concentrations the automated instrument underestimated PAHs levels. At external site, Ecochem PAS 2000 real-time concentrations were steadily higher than those on filter. In the same way, real-timeblack carbon values were constantly lower than EC concentrations obtained by Sunset EC/OC in the inner site, while outside the plantreal-time values were comparable to Sunset EC values. Results showed that in a coke plant real-timeanalyzersof PAHs and black carbon in the factory configuration provide qualitative information, with no accuracy and leading to the underestimation of theconcentration. A site specific calibration is needed for these instruments before their installation in high polluted sites.
Copyright © 2016, Livia Trizio et al. This is an open access article distributed under the Creative Commons Attribution License, which permits unrestricted use,
distribution, and reproduction in any medium, provided the original work is properly cited.
INTRODUCTION
Policiclycaromatic hydrocarbons (PAHs) are a class of semi-volatile, organic compounds made by fused benzene rings and formed by incomplete combustion of organic matter. Many PAHs are potent mutagens and carcinogens and they account for the majority of mutagenic potency attributable to specific compounds in ambient particulate matter (Hannighan et al., 1998). Benzo ``(a)pyrene (B(a)P) is referred to as one ofthe most potent carcinogens known. IARC has classified B(a)P as carcinogenic to humans (Group 1) and the major part of the other PAHs as probably (Group 2A) or possibly carcinogenic to humans (Group 2B). Airborne PAHs with less than three aromatic rings are gaseous, whereas PAHs with five or more rings are merely bound to airborne particulates. In particular, 80–100% of these latter PAHs are associated with fine particulate matter with aerodynamic diameter of 2.5 µm (PM2.5) (Venkataraman and Friedlander, 1994).
*Corresponding author: Livia Trizio,
Arpa Puglia, C.so Trieste 27, 70126 Bari, Italy.
Carbon is one of the most abundant constituents of ambient particulate matter. It is present either as organic carbon (OC), which is mainly volatile, or as elemental carbon (EC), which is non-volatile and non-reactive, or as carbonate (CC). Often EC is referred as black carbon (BC) and these terms are used as interchangeably even ifthey are not measures of the same properties of PM. EC or BC are essentially primary pollutant, emitted directly during the incomplete combustion of fossil and biomass carbonaceous fuels in the submicron range. In details, EC is the thermally-refractory pure carbon and BC has a graphitic structure that efficiently absorbs light over a broad region of the visible spectrum (Chow et al., 2009). Based on these characteristics, EC and BC are operationally defined by the measurement method applied: thermal and optical method for EC and BC, respectively (Plaza et al., 2006).Black carbon has been the subject of extensive scientific health studies during the past several decades. It is classified by the International Agency for Research on Cancer (IARC) as a Group 2B carcinogen (possibly carcinogenic to humans). In recent years a growing interest has been directed to measure these two parameters in urban areas due to their toxicity and potential
International Journal of Information Research and Review
Vol. 03, Issue, 04, pp. 2124-2131, April,2016
Article History:
Received 26th, January 2016
Received in revised form 25th, February 2016
Accepted 20th, March 2016
Published online 27, April 2016
International Journal of Information Research and Review, April, 2016
Keywords: Black Carbon, Coke Oven Plant, PAH,
PAS, Aethalometer.
effects for human health.The Italian Legislative Decree 155/2010 sets an annual target value of 1 ng/m3 for benzo(a)pyrene in ambient air. The target value for B
used as a marker for the carcinogenic risk of polycyclic aromatic hydrocarbons. Moreover, the Decree prescribes the reference methodology for the measurement of B(a)P in ambient air. The method comprises sampling of B(a)P as part of the PM10 particles by using high or low volume sampler a period of 24 hours (CEN, 2014), sample extraction and analysis (CEN, 2008).
Average value over 24 hours often does not allow to highlight short-term critical events and to characterize emission sources. These information can be obtained using automated instrumentation at high time-resolution. The same is true for other pollutants as BC. For this purpose, several analyzershave been developed to meet that need. Since the late eighties of the last century photoelectric aerosol sensors (PAS) are used for the real-time detection of PAHs (Arnott et al., 2005)
real-time monitors are based on Beer–Lambert’s law: they perform BC detection measuring the light absorption of carbon particles at fixed wavelengths. A massive PAHs source is represented by coke-oven batteries, the section of the steelmaking integrated plants where coal is pyrolysed to produce coke and pyrolytic gas (Remus et al., 2013).
Fig. 1
2125 Livia Trizio et al.Evaluation of automated analyzers of pahs and black carbon in a coke oven plant
effects for human health.The Italian Legislative Decree 155/2010 sets an annual target value of 1 ng/m3 for benzo(a)pyrene in ambient air. The target value for B (a)P is genic risk of polycyclic aromatic hydrocarbons. Moreover, the Decree prescribes the reference methodology for the measurement of B(a)P in ambient air. The method comprises sampling of B(a)P as part of the PM10 particles by using high or low volume sampler on a period of 24 hours (CEN, 2014), sample extraction and
Average value over 24 hours often does not allow to highlight term critical events and to characterize emission sources. These information can be obtained using automated resolution. The same is true for For this purpose, several analyzershave been developed to meet that need. Since the late eighties of the last century photoelectric aerosol sensors (PAS) are used for the ., 2005).Black carbon Lambert’s law: they perform BC detection measuring the light absorption of carbon A massive PAHs source is oven batteries, the section of the l is pyrolysed to ., 2013).
Emissions are predominantly diffuse and originate from oven leakages, as well as from cyclic
coke unloading. ILVA,one of the largest steel plants in Europe, is hosted in Taranto, a heavily industrialized city in southern Italy.In the last yearsthis site has become the most striking example of air pollution at the nat
the ILVA pollution impact on Taranto, an air quality monitoring network (five air quality sites along the external plant perimeter and one inside, near the coke oven) was installed in 2013 (Fig. 1).
Monitoring sites were equipped, in addition to conventional analyzers, with photoelectric aerosol sensors (PAS) for PAHs and Black Carbon real-time monitors.
monitoring network, higher levels of PAHs and BC were measured at external site (Orsini) than inn
(Cokeria). In order to exclude instrumental malfunctions, additional Ecochem PAS 2000 instruments were installed in both monitoring sites for about two months: their data resulted comparable to those of the original instruments, confirming t good working of both instruments (R2 = 0.97 in both sites) (ARPA Puglia, 2013). At the aim of a deeper investigation of the phenomenon, from February 7
intensive field campaign was conducted at the two sites.
Fig. 1. ILVA Air Quality Monitoring network
Evaluation of automated analyzers of pahs and black carbon in a coke oven plant
Emissions are predominantly diffuse and originate from oven leakages, as well as from cyclic operations of coal loading and coke unloading. ILVA,one of the largest steel plants in Europe, is hosted in Taranto, a heavily industrialized city in southern Italy.In the last yearsthis site has become the most striking example of air pollution at the national level. In order to assess the ILVA pollution impact on Taranto, an air quality monitoring network (five air quality sites along the external plant perimeter and one inside, near the coke oven) was
uipped, in addition to conventional analyzers, with photoelectric aerosol sensors (PAS) for PAHs time monitors. Since the start of ILVA monitoring network, higher levels of PAHs and BC were measured at external site (Orsini) than inner plant site In order to exclude instrumental malfunctions, additional Ecochem PAS 2000 instruments were installed in both monitoring sites for about two months: their data resulted comparable to those of the original instruments, confirming the good working of both instruments (R2 = 0.97 in both sites) (ARPA Puglia, 2013). At the aim of a deeper investigation of
the phenomenon, from February 7th to March 30th 2014 an
intensive field campaign was conducted at the two sites. Evaluation of automated analyzers of pahs and black carbon in a coke oven plant
PM2.5 and PM1 were collected in each site and analyzed to quantify PAHs, EC and OC concentrations. The aims of this study are (1) to compare PAHs and BC real-time instruments with analytical methods, (2) to explain the different pattern of PAHs and BC in coke site respect to Orsini, (3) to investigate application limits of real-time instruments.
MATERIALS AND METHODS
Field campaign took place from February 7thto March 5th 2014. Table I reports sites’ features and monitoring dates:
Table 1. Monitoring sites and dates
Monitoring site Site location Monitoring start Monitoring end
COKERIA Inside ILVA plant 07.02.2014 05.03.2014
ORSINI Outside ILVA plant 17.02.2014 05.03.2014
Time-Integrated Sampling and Speciated Analysis
PM2.5 and PM1 daily samples were collected on quartz fiber filters (Whatman® QM-A, 47 mm diameter) by particle analyzers (FAI Instruments model SWAM Dual sampler) operating at a flow rate of 2.3m3/h. Collected filters were cut into 4 equal parts for chemical characterization. PAHs extraction was realized by a microwave assisted solvent extraction (Milestone s.r.l. model Ethos D, Sorisole (BG), Italy). Extracted samples were analyzed using an Agilent 6890 PLUS gas chromatograph (Agilent Technologies, Wilmington DE) equipped with a programmable temperature vaporization injection system (PTV) and interfaced to a mass selective spectrometer with an inert ion source (Agilent MS-5973 N). The attention was focused on benzo [a] anthracene (BaA),
Chrysene (Chr), benzo [b+j] fluoranthene (BbF), benzo [k]
fluoranthene(BkF),benzo [a] pyrene(BaP), indeno [1,2,3-cd]
pyrene (IP), benzo [g,h,i] perylene (BgP), and dibenzo [a,h] anthracene (DbA) (Amodio et al., 2008).
Rectangular punches (1.50 cm2) of filter deposit were analyzed for the detection of the organic and elemental carbon by a thermal optical method using NIOSH5040 thermal protocol. In this method speciation of organic carbon (OC) and elemental carbon (EC) is accomplished through temperature and atmosphere control. He-Ne laser light through the filter allows continuous monitoring of filter transmittance and an optical feature corrects for pirolitically generated OC. A flame ionization detector is used for quantification of evolved carbon and instrument calibration is achieved through injection of a known volume of methane into the sample oven (Birch and Cary, 1996).
PAHs Real-Time Monitoring
PAH real-time monitoring was performed by EcochemPAS 2000 (EcoChem Analytics, Texas, and EcoChemMesstechnik, Germany). This analyzerperformsreal-time measurements of PAHs adsorbed on the surface of the carbonaceous aerosol with an aerodynamic diameter between 0.01 and 1 micron. Ultraviolet light at 207 nmfrom an excimer lamp generate the ionization of carbon aerosols.An electric field removes the ejected electrons, and the positively charged particles are trapped on a filter, generating a current that is measured by an electrometer.
The selected wavelength allows ionization of PAHs having photoionization potential equal to or less than 5.6eV, while gaseous molecules and aerosols do not retain the carbonaceous neutral charge. The electrical current generated is proportional to the concentration of PAHs particle-bound. The instrument reports results as total particle-bound PAHs.
Black Carbon Real-Time Monitoring
Black Carbon real-time monitoring was performed by Magee Aethalometer AE22 (Magee Scientific Corporation, Berkeley USA). This instrument providesBC concentration by measuring the attenuation of optical radiation at 880nm caused by aerosols collected on the filter. The attenuation coefficient of the Aethalometer used in this study for the calculation of BCwas
16.6m2g-1 as recommended by the manufacturer. The
attenuation coefficient is the critical parameter to convert attenuation measurements (ATN) to BC mass using the relation: Thus, variability in the attenuation coefficient would result in errors in the estimated black carbon mass (Hansen et al., 1984; Jeonget al, 2004).
RESULTS
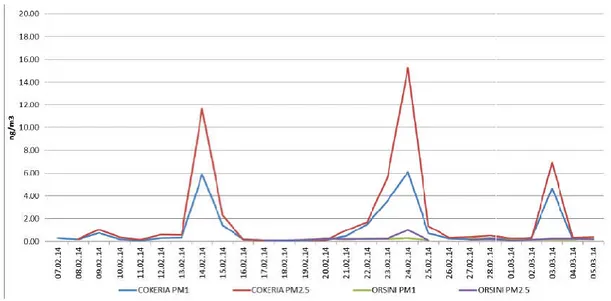
Fig.2 shows PM2.5 and PM1 concentrations recorded in the two monitoring sites. PM2.5 concentrations within steel plant were higher than in the external site, whilePM1 levels at two site were similar except in the event days. High concentrations of
the two PM fractions were observed on 14th, 23th, 24th, 25th,
27thFebruaryand March3rdin Cokeria site. These days were
characterized by northerly winds: consequently, the receptor site was downwind to coke batteries.A peak of concentration
was detected only for PM2.5 on the 1st March, with
South-Eastern wind. Orsinisite did not detect concentration peaks when downwind to the industrial area, showing a low correlation with Cokeriasite
(Fig. 3) andsuggesting the existence of partly different emission sources in the two sites. Fig. 4 shows Benzo (a) Pyrene concentrations in the two sites. In Cokeria site high concentrations of B(a)P bound to PM2.5 and to PM1 were
observed on 14th, 15th, 23th, 24th February and March 3rd when
the receptor site was downwind to coke oven batteries. At Orsini site, data about PAHs determined on filter are available
only from February 17th to March 5th. Throughout the sampling
period, BaP concentrations remained constant and low, never
exceeding the annual target value of 1ng/m3. OC and EC
concentrations in PM1 fraction were comparableat the two investigated sites. Instead, higher concentrations of OC and EC bound to PM2.5 were detected at Cokeria site during the monitoring campaign (Table II). According to Lee et al. (2006), EC emitted from vehicular traffic was mainly bound to PM1 fraction, and represented an EC background for both sites. Otherwise the carbon fraction bound to PM1-2.5 is a better indicator for industrial emissions at Taranto. The OC/EC ratio mean values, calculated for PM1fraction, were paragonable in the two sites. Lower mean ratio was found in PM2.5 fraction at Cokeria site suggesting the presence of a relevant primary emission source in industrial area of Taranto.
Table 2. OC, EC and OC/EC ratio values
PM2.5 PM1
OC EC OC/EC OC EC OC/EC
ORSINI 2.35 1.03 2.28 1.96 0.79 2.47
COKERIA 3.36 2.15 1.56 1.99 0.68 2.92
Fig. 3.
2127 Livia Trizio et al.Evaluation of automated analyzers of pahs and black carbon in a coke oven plant
Fig. 2. PM2.5 and PM1 concentrations
. PM2.5: Inner site (Cokeria)vs external site(Orsini)
Fig. 4. Benzo (a) Pyrene concentration
Evaluation of automated analyzers of pahs and black carbon in a coke oven plant Evaluation of automated analyzers of pahs and black carbon in a coke oven plant
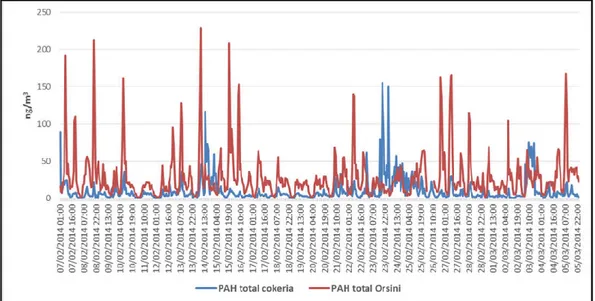
Fig. 5. Hourly concentration of total PAHs
Fig. 6. External site (Orsini): Real-timevs analytical PAH data
Fig. 7. Innersite (Cokeria): Real-timevs analytical PAH data
PAS vs Analytical Results
Figs.6 and 7 show the comparison between real
values measured by ECOCHEM PAS 2000 and the sum of the 8 PAHs analytically determined. The comparison was aimed at verifying the existence of a consistency between concentrations and not to verify the accuracy of ECOCHEM PAS 2000. At Orsini site (Fig. 6), real-time monitor Ecochem PAS 2000
logged consistently higher concentrations than those
determined by chemical analysis. Given that the instrument measures a greater number of analytes than the 8 determined by GC/MS, it can be considered an expected result. Moreover, highest hourly concentrations of total PAHs were r
during the traffic rush hours suggesting the relevance of traffic emission (Fig. 5). At Cokeria site (Fig. 7) a different behavior was observed. In windward days to coke oven batteries, the PAHs levels were relatively low and the real
comparable to those determined analytically. On the contrary, that is downwind of the coke oven, PAHs concentrations reached very high levels with Ecochem PAS 2000 concentrations lower than those analytically determined. In these conditions, the analyzer showed its unfitness to
respond properly generating a large concentration
underestimation. Furthermore, on days when PAHs determined on filter were comparable between inside and outside the plant, the Ecochem PAS 2000 installed in Cokeria site recorde concentrations of an order of magnitude lower than the one in Orsini site. This behavior can be attributed to the workingprinciple of photoelectric aerosol sensors (Kelly K. E.
et al., 2003).Ecochem PAS 2000 used in the campaign were
factory-calibrated by comparison with a Master instrument. Calibration is carried out burning a candle or an oil lamp in a small volume (contained room) and running the master side side with the customer instrument. This procedure ensures that all PAS instruments are consistent. Previous studies had shown a strong correlation between photoelectric charging and independently measured PAH concentrations for a variety of aerosols: oil burner exhaust, cigarette smoke, parking garage air, and ambient urban air in different cities (Siegmann, K. and Siegmann H, 2000).Nevertheless, since every source of PAHs has its own signature due to variations in chemical composition and particle size distribution, a site-specific calibration curve should be carried on.
This type of calibration can be performed by comparing the response of the analyzer with the concentration determined by analysis of the PAHs championships at the emitting source (US EPA, 2001). Moreover, it has to be considered that PAS is based on a surface technique, capable of detecting only the outermost coating layer of solid particles. This means that substances adsorbed on PAHs can reduce the energy absorbed by them and, consequently, the photoelectric signal generated from them. In a dirty environment such as the coking plant, it is reasonable that the PAHs are covered by other substances depleting their photoemission (Niessner et al
2006). Finally, the linearity of the photoelectric response in function of PAHs concentration can be expected only for PAH monolayers (Niessner, 1986). Layers overlapping, very likely in a site close to a massive PAHs source such as coke oven batteries, do not allow obtainingaccurate quantitative information.
2129 Livia Trizio et al.Evaluation of automated analyzers of pahs and black carbon in a coke oven plant
Figs.6 and 7 show the comparison between real-time PAHs values measured by ECOCHEM PAS 2000 and the sum of the analytically determined. The comparison was aimed at verifying the existence of a consistency between concentrations and not to verify the accuracy of ECOCHEM PAS 2000. At time monitor Ecochem PAS 2000
concentrations than those
determined by chemical analysis. Given that the instrument measures a greater number of analytes than the 8 determined by GC/MS, it can be considered an expected result. Moreover, highest hourly concentrations of total PAHs were recorded during the traffic rush hours suggesting the relevance of traffic At Cokeria site (Fig. 7) a different behavior was observed. In windward days to coke oven batteries, the PAHs levels were relatively low and the real-time values were comparable to those determined analytically. On the contrary, that is downwind of the coke oven, PAHs concentrations reached very high levels with Ecochem PAS 2000 concentrations lower than those analytically determined.
yzer showed its unfitness to
respond properly generating a large concentration
Furthermore, on days when PAHs determined on filter were comparable between inside and outside the plant, the Ecochem PAS 2000 installed in Cokeria site recorded concentrations of an order of magnitude lower than the one in This behavior can be attributed to the workingprinciple of photoelectric aerosol sensors (Kelly K. E. ., 2003).Ecochem PAS 2000 used in the campaign were y comparison with a Master instrument. Calibration is carried out burning a candle or an oil lamp in a small volume (contained room) and running the master side-by-side with the customer instrument. This procedure ensures that
stent. Previous studies had shown a strong correlation between photoelectric charging and independently measured PAH concentrations for a variety of aerosols: oil burner exhaust, cigarette smoke, parking garage s (Siegmann, K. and Siegmann H, 2000).Nevertheless, since every source of PAHs has its own signature due to variations in chemical composition specific calibration curve
This type of calibration can be performed by comparing the response of the analyzer with the concentration determined by analysis of the PAHs championships at the emitting source (US EPA, 2001). Moreover, it has to be considered that PAS is ace technique, capable of detecting only the outermost coating layer of solid particles. This means that substances adsorbed on PAHs can reduce the energy absorbed by them and, consequently, the photoelectric signal generated ent such as the coking plant, it is reasonable that the PAHs are covered by other substances
et al, 1990; Marr et al.,
2006). Finally, the linearity of the photoelectric response in be expected only for PAH monolayers (Niessner, 1986). Layers overlapping, very likely in a site close to a massive PAHs source such as coke oven batteries, do not allow obtainingaccurate quantitative
Aethalometervs. Analytical Results
The determination of the carbon component by means of thermo-optical measurements was conducted by an OC/EC Aerosol Analyzer (Sunset Laboratory Inc.). In fact, as said earlier, the elementary carbon EC determined in the laboratory can be identified with the rea
Aethalometer.In Orsinisite BC and EC concentrations were not significantly different (Fig.8), although there are few data available. On the other hand, in Cokeria site BC levels detected with real-time instrument were always lower tha determined experimentally (Fig.9).
Fig. 8. External site (Orsini): Real
Fig .9. Inner site(Cokeria): Real
Likewise to PAHs, even for BC this apparently
anomalousbehavior can be attributed
principle. The BC concentration measured by Aethalometer, in fact, is a function of the attenuation coefficient, a coefficient used to convert the attenuation of the radiation in BC concentration. This coefficient requires a site
calibration because it depends on the size distribution of the particles, the type of aerosol and the mass deposited per unit of time (Jeong et al., 2004; Weingartner at al., 2003; Hitzenberger
et al., 2006). In most studies it has been shown that pa
pollutedsites, such as a coke oven plant, require very different attenuation coefficients from the default one, because a wrong one would likely lead to a BC underestimation.
Conclusion
A field monitoring campaign was conducted in order to evaluate the behavior of PAHs and black carbon real
Evaluation of automated analyzers of pahs and black carbon in a coke oven plant
Aethalometervs. Analytical Results
etermination of the carbon component by means of optical measurements was conducted by an OC/EC Aerosol Analyzer (Sunset Laboratory Inc.). In fact, as said earlier, the elementary carbon EC determined in the laboratory can be identified with the real-time BC detected by Aethalometer.In Orsinisite BC and EC concentrations were not significantly different (Fig.8), although there are few data available. On the other hand, in Cokeria site BC levels detected time instrument were always lower than EC determined experimentally (Fig.9).
External site (Orsini): Real-timevs analytical BC data
Inner site(Cokeria): Real-timevs analytical BC data
Likewise to PAHs, even for BC this apparently
anomalousbehavior can be attributed to the analyzerworking principle. The BC concentration measured by Aethalometer, in fact, is a function of the attenuation coefficient, a coefficient used to convert the attenuation of the radiation in BC concentration. This coefficient requires a site-specific calibration because it depends on the size distribution of the particles, the type of aerosol and the mass deposited per unit of ., 2004; Weingartner at al., 2003; Hitzenberger In most studies it has been shown that particularly pollutedsites, such as a coke oven plant, require very different attenuation coefficients from the default one, because a wrong one would likely lead to a BC underestimation.
A field monitoring campaign was conducted in order to evaluate the behavior of PAHs and black carbon real-time analyzers in a Evaluation of automated analyzers of pahs and black carbon in a coke oven plant
coke oven plant. Data were collected both inside and outside the plant.Results showed PM2.5 and PM1 levels constantly higher inside than outside the plant. In the innersite concentration peaks were observed when the site was downwind to coke oven batteries. Otherwise, the external site didn’t show PM increase when downwind to the industrial area, showing no correlation with inner site and revealing the existence of different emission sources. On the contrary, PAHs real-time values were higher outside than inside the coke oven plant. At theinner
siteEcoChem PAS 2000 real-timeanalyzer measured
concentrations not significantly different from those determined on filterduring low polluted days. At increasing concentrations, the automatedanalyzershowed an underestimation of PAHs concentration.
At external site, real-time values were steadily higher than those determined on filter.In the same way, at theinner site black carbon real-time analyzer recorded values constantly lower than EC concentration obtained by Sunset EC/OC thermo-optical measurements. At externalsitethe values of real-time analyzer AethalometerAE22were comparable to Sunset EC values. This behavior can be attributed to the working principles of Ecochem PAS 2000 and Aethalometer AE22. The response of Ecochem PAS depends on source type, so a calibration curve should be developed for each source.
Moreover, the coating of particles containing PAHs by condensation of inorganic or organic aerosol or semi volatile compounds emitted at high temperature could shield the PAHs from photoionization.In the same way, optical analysis for black carbon requires a site-specific calibration since the response of this kind of analyzers depends on size distribution, type of aerosol, mixtures and deposited mass per unit time. Results showed that a site specific calibration is needed for Ecochem PAS 2000 and the Magee Aethalometerapplication in a coke oven plant. Without it, these analyzers underestimate concentrations and their data can be considered as a merely indication of concentration trends.
REFERENCES
Amodio, M., Caselli, M., Daresta, B. E., de Gennaro,G., Ielpo,P., Placentino,C. M., Tutino, M. 2008. “Air quality impact for industrial area of Taranto city (South Italy): a multivariate statistical analysis application”, Chemical Engineering Transcation, 16, 193-200.
Arnott, W. P., Zielinska, B., Rogers, C. F., Sagebiel J., Park K., Chow, J., Moosmüller H. and Watson, J.G. 2005. “Evaluation of 1047-nm Photoacoustic Instruments and Photoelectric Aerosol Sensors in Source-Sampling of Black Carbon Aerosol and Particle-Bound PAHs from Gasoline and Diesel Powered Vehicles”.Environ. Sci. Technol., 39 (14), 5398–5406. ARPA PUGLIA 2013. http://www.arpa.puglia.it/ web/guest/
rete_aria_ILVA
Birch, M. and Cary, R. 1996. “Elemental carbon based method for monitoring occupational exposures to particulate diesel exhaust”, Aerosol Sci Tech, 25, 221-241.
Chow, J.C., Watson J.G., Doraiswamy P., Chen, L.W. A. Sodeman, D.A., Lowenthal, D.H. Park, K., Arnott, W.P. and Motallebi, N. 2009. “Aerosol light absorption, black carbon,
and elemental carbon at the Fresno Supersite,
California”Atmos. Res., 93, 874-887.
European Committee for Standardization, 2008, EN
15549:2008 “Air quality -Standard method for the measurement of the concentration of benzo (a) pyrene in ambient air”.
European Committee for Standardization, 2014, EN
12341:2014 “Ambient air - Standard gravimetric measurement method for the determination of the PM10 or PM2, 5 mass concentration of suspended particulate matter”.
Hannigan, M. P., Cass, G. R., Penman, B. W., Crespi, C. L., Lafleur, A. L., Busby, W. F., Thilly, W. G. and Simoneit, B. 1998. “Bioassay-directed chemical analysis of Los Angeles air-borne particulate matter using a human cell mutagenicity assay”, Environ. Sci. Technol., 32, 3502–3514.
Hansen, A. D. A., Rosen, H. and Novakov, T. 1984. “The
Aethalometer—An Instrument for the Real-Time
Measurement of Optical Absorption by Aerosol Particles”.
Sci. Total Environ., 36, 191–196.
Hitzenberger R., Petzold, A., Bauer, H., Ctyroky, P., Pouresmaeil, P., Laskus, L. and Puxbaum, H. 2006. “Intercomparison of thermal and optical measurement methods for elemental carbon and black carbon at an urban location”, Environ. Sci. Technol., 40, 6377-6383.
Jeong, C., Hopk, P. K., Kima, E. and Doh-Won, L. 2004. “The comparison between thermal-optical transmittance elemental carbon and Aethalometer black carbon measured at multiple monitoring sites”Atmospheric Environment, 38 5193–5204. Kelly, K. E., Sarofim, A. F., Lighty, J., Arnott, W. P., Rogers,
C. F., Zielinska, B. and Prather, K. 2003. “A.User Guide for Characterizing Particulate Matter – Evaluation of several Real-Time Methods” University of Utah.
Lee, S. C., Cheng, Y, Ho, K. F, Cao, J.J., Louie P. K. K., Chow, J.C. and Watson J. G. 2006. ‘PM1. and PM2.5 Characteristics in the Roadside Environment of Hong Kong’,Aerosol Science and Technology, 40, 157–165.
Marr, L. C., Dzepina, K., Jimenez, J. L., Reisen, F., Bethel, H. L., Arey, J., Gaffney, J. S., Marley, N. A., Molina, L. T., and Molina, M. J. 2006. “Sources and transformations of particle-bound polycyclic aromatic hydrocarbons in Mexico City”, Atmos. Chem. Phys. 6, 1733-1745.
Niessner, R. 1986. “The chemical response of the photoelectric aerosol sensor (PAS) to different aerosol systems.”, J. Aersol
Sci., 17(4), 705-714.
Niessner, R., Hemmerich, B. and Wilbring, F. 1990. “Aerosol Photoemission for quantification of Polycyclic Aromatic Hydrocarbons in simple mixtures adsorbed on carbonaceous and sodium chloride aerosols”, Anal. Chem., 62, 2071-2074. Plaza, J., Gomez-Moreno, F.J., Nunez, L., Pujadas, M.,
Artınano, B. 2006. “Estimation of secondary organic aerosol formation from semicontinuous OC–EC measurements in a Madrid suburban area” Atmos. Envir., 40, 1134–1147. Rainer, R., Aguado-Monsonet, M.A., Roudier, S., Delgado
Sancho, L. 2013. “Best Available Techniques (BAT) Reference Document for Iron and Steel Production Industrial
Emissions Directive 2010/75/EU Integrated Pollution
Prevention and Control”.
Siegmann, K. and Siegmann, H. 2000.” Fast and reliable “in situ” evaluation of particles and their surfaces with special reference to diesel exhaust”SAE Technical Paper Series, 2000-01-1995, 1–7.
U.S: EPA. 2001. Environmental Technology Verification Report – Ecochem Analytics PAS 2000 Particulate PAH Monitor.
Venkataraman, C. and Friedlander, S.K. 1994. “Size distributions of polycyclic aromatic-hydrocarbons and elemental carbon. Ambient measurements and effects of atmospheric processes”. Environ. Sci. and Techn. 28 (4), 563– 572.
Weingartner, E., Sathoff, H., Schnaiter, M., Streit, N., Bitnar, B., Baltensperger, U. 2003. ”Absorption of light by soot particles: determination of the absorption coefficient by means of aethalometers” J. of Aerosl Science, 34, 1445-1465.