Laryngology
Comparison of electroglottographic variability index
in euphonic and pathological voice
Confronto dell’indice di variabilità EGG nella voce eufonica e patologica
A. NACCI1, S.O. ROMEO1, M.D. CAVALIERE1, A. MACERATA2, L. BASTIANI3, G. PALUDETTI4, J. GALLI4, M.R. MARCHESE5, M.R. BARILLARI6, U. BARILLARI6, S. BERRETTINI1, 7, C. LASCHI8, M. CIANCHETTI8, M. MANTI8, F. URSINO9, B. FATTORI1
1 ENT, Audiology and Phoniatrics Unit, University Hospital of Pisa, Italy; 2 Department of Clinical and Experimental Medicine, University of Pisa, Italy; 3 Institute of Clinical Physiology of the Italian National Research Council
(IFC-CNR), Pisa, Italy; 4 Institute of Otorhinolaryngology, Department of Head and Neck Surgery, Fondazione Policlinico Universitario A. Gemelli IRCCS, Roma - Università Cattolica del Sacro Cuore, Rome, Italy; 5 Institute of Otorhinolaryngology, Department of Head and Neck Surgery, Fondazione Policlinico Universitario A. Gemelli IRCCS, Rome, Italy; 6 Division of Phoniatrics and Audiology, Department of Mental and Physical Health and Preventive Medicine, University of Campania “Luigi Vanvitelli”, Naples, Italy; 7 Division of ENT Diseases, Karolinska Institutet, Stockholm, Sweden; 8 The BioRobotics Institute, Scuola Superiore Sant’Anna, Pisa, Italy; 9 National Institute for Research in Phoniatrics, University of Pisa, Italy
SUMMARY
In a recent study we introduced a new approach for analysis of the electroglottographic (ECG) signal. This method is based on the evaluation of variation of the EGG signal and its first derivative, through new software developed by the Pisan phoniatric school. This software is designed to extract quantitative indices related to the contacting and decontacting phases of the vocal folds during phonation. The software allows us to study the combined variability of vibration amplitude and velocity (i.e. the first derivative of the EGG signal). Pathological voices show a much more variable EGG signal compared to normal voices, since cordal vibration is made irregular due to the presence of glottis plane patholo-gies. With the aim of demonstrating the differences between normal and pathological voices relevant to combined vibration amplitude and velocity variability, we have introduced a new quantitative parameter named “variability index, VI”. We studied 95 subjects (35 normal and 60 with pathological voice); among pathologic subjects, 15 showed functional dysphonia and 45 showed organic dysphonia. Subjects affected by organic dysphonia presented: 15 bilateral vocal nodules, 15 unilateral polyps and 15 unilateral cysts. All subjects were studied with videola-ryngostroboscopy; electro-acoustic parameters of the voice were analysed with the KayPENTAX CSL (Model 4500) system. The EGG signal was recorded using KAY Model 6103 connected to the CSL system. The new software for the analysis of the EGG signal allows us to obtain not only a VI total value relevant to variability during all the recording, but also partial VI values relevant to the different glottis cycle phases. In fact, plotting the amplitude variation and its first derivative on a Lissajous graph, it is possible to divide the whole glottis cycle into four phases (each represented by four quadrants on the graph): the initial vocal folds contacting activity (VI-Q1), the last phase of vocal folds contacting (VI-Q2), the first phase of vocal folds decontacting (VI-Q3) and the last phase, up to the complete decontacting of vocal folds (VI-Q4). For each quadrant, it is also possible to work out the percent variability index. By comparing the variability indices in the normal and pathological groups, we obtained the following results: the total VI was significantly higher in the pathological subjects (0.25 vs 0.18; p = 0.01); the absolute value of VI was higher in pathological subjects, although the difference was not significant (VI-Q2, 0.041 vs 0.029; VI-Q3, 0.065 vs 0.058; VI-Q4, 0.054 vs 0.052). The percent variability in the Q2 quadrant (VI-Q2%) was significantly higher in pathological subjects compared to normal subjects (0.22 vs 0.16) (p = 0.01). The results of this study confirm that our new software for analysis of EGG signal can distinguish normal voice from pathological voice based on the new quantitative parameter VI. Moreover, this study emphasises that the final contact phase of vocal folds is the most representative of the difference between the normal and pathological voice and shows a wider variability in terms of amplitude and vibration velocity. Further studies on larger groups of subjects will be required to confirm these results and assess differences in the EGG signal among the various vocal fold pathologies.
KEY WORDS: Electroglottography • EGG • Glottal cycle • EGG variability • Vocal fold dynamics • DEGG RIASSUNTO
In un recente lavoro abbiamo presentato un nuovo approccio allo studio del tracciato elettroglottografico; il metodo di studio si basava sulla valutazione della variazione del segnale EGG e della sua derivata prima, mediante un nuovo software ideato dalla scuola foniatrica pisana. Tale software permette di ottenere indici quantitativi relativi alle fasi di contatto e decontatto delle corde vocali durante la fonazio-ne, mediante lo studio della variabilità combinata dell’ampiezza e della velocità di vibrazione (derivata prima del segnale EGG). La voce patologica presenta un segnale EGG più variabile rispetto alla voce normale: la vibrazione cordale è resa irregolare dalla presenza di
patologia del piano glottico. Al fine di dimostrare differenze tra voce normale e patologica relative alla variabilità combinata tra ampiezza e velocità di vibrazione, abbiamo introdotto un nuovo parametro quantitativo denominato “variability index, VI”. Abbiamo studiato 95 soggetti (35 normali e 60 con voce patologica); tra i patologici, 15 mostravano disfonia disfunzionale e 45 disfonia organica. I soggetti affetti da disfonia organica presentavano: 15 noduli vocali bilaterali, 15 polipi unilaterali e 15 cisti unilaterali. Tutti i soggetti venivano studiati con videolaringostroboscopia, i parametri elettroacustici della voce venivano analizzati attraverso il sistema KayPENTAX CSL (Model 4500). L’esame EGG veniva effettuato attraverso il KAY Model 6103 collegato al sistema CSL. Il nuovo software di analisi del se-gnale EGG permette non solo di ottenere un VI totale (VI-total) relativo alla variabilità durante tutta la registrazione, ma anche VI parziali relativi alle varie fasi del ciclo glottico. Applicando la variazione di ampiezza e della derivata prima su un grafico di Lissajous, è possibile dividere l’intero ciclo glottico in 4 fasi (rappresentate da 4 quadranti nel grafico): la fase iniziale di contatto delle corde vocali (VI-Q1), la fase finale di contatto delle corde vocali (VI-Q2), la fase iniziale di de-contatto delle corde vocali (VI-Q3) e la fase finale, fino al completo de-contatto delle corde vocali (VI-Q4). Per ciascun quadrante, inoltre, è possibile calcolare l’indice di variabilità percentuale. Comparan-do gli indici di variabilità nei gruppi normali e patologici, abbiamo ottenuto i seguenti risultati: il VI totale era significativamente maggiore nel gruppo di soggetti patologici (0,25 vs 0,18; p = 0,01); il valore assoluto di VI in 3 quadranti era maggiore nei patologici anche se non in maniera statisticamente significativa (VI-Q2, 0,041 vs 0,029; VI-Q3, 0,065 vs 0,058; VI-Q4, 0,054 vs 0,052). La variabilità percentuale del quadrante Q2 (VI-Q2%), era significativamente più elevata nei soggetti patologici rispetto ai normali (0,22 vs 0,16) (p = 0,01). I risultati di questo studio hanno confermato che il nostro nuovo software di analisi del tracciato EGG permette di distinguere la voce normale da quella patologica sulla base di un nuovo parametro quantitativo, il VI. Lo studio mette in evidenza come la fase che più caratterizza la dif-ferenza tra voce normale e patologica è quella relativa alla fase finale di contatto delle corde vocali, che presenta una maggiore variabilità di ampiezza e velocità di vibrazione. Ulteriori studi, con un numero maggiore di soggetti, saranno necessari per confermare questi risultati e per dimostrare eventuali differenze di variabilità del segnale EGG nelle diverse patologie delle corde vocali.
PAROLE CHIAVE: Elettroglottografia • EGG • Ciclo glottico • Variabilità EGG • Dinamica delle corde vocali • DEGG
Introduction
Electroglottography (EGG) is an electrical impedance-based technology for inferring vocal folds contact during
phonation 1-3. This technique is based on the principle that
electrical impedance through the neck systematically varies with the degree of contact of vocal folds in the glottic cycle. The complete contact of vocal folds is associated with low impedance values and a high electric current flow through the glottis. As the contact of vocal folds decreases (decon-tacting phase), the high impedance of air through the glot-tic plane causes a significant variation of the current flow; as a consequence, the voltage passing through neck tis-sues reduces. These voltage variations which occur during phonation in the vocal folds’ edge contact and detachment phases are at the basis of the EGG signal. Electroglottogra-phy is carried out using two electrodes placed on thyroidal cartilage. Electric current with low voltage and intensity (0.5 V; < 10 mA) and high frequency (0.3-5 MHz) flows through the electrodes, whereas the neck acts as a variable
resistor in a constant current circuit 4.
From a clinical standpoint, the advantages of EGG are as follows: the EGG cycle is repeated at each contact and its frequency is considered the most accurate indicator of the
voice fundamental frequency (F0) 5-7; the EGG plot
dem-onstrates the best indirect representation of the vocal fold vibration as a whole and particularly during its closing
phase 5 7 8; when used with high-speed imaging and acoustic
analysis, EGG is able to highlight irregular vibratory
pat-terns 9. In the early 1990s, Ursino and colleagues correlated
EGG findings with subglottic pressure variations measured in vivo, obtaining important information on cordal
vibra-tion physiology 10 11. Hosokawa et al. have recently shown
how EGG parameters related to the regularity of vocal fold vibration may be useful for diagnosis of dysphonia and
as-sessment of the efficacy of voice therapy 12. Somanath and
Mau confirmed that EGG parameters may serve as a mark-er for treatment response and found that they may provide a within-subject measure of vocal strain; adding EGG to multidimensional assessment may improve
characterisa-tion of voice disturbance 13. Moreover, EGG is useful for
the voices of singers in the study of diplophonia and vibrato (in conjunction with spectrography) and for the training of singers (displaying the contact quotient associated with the trend of F0 in real-time). Finally, EGG examination is
sim-ple, inexpensive and non-invasive 6 14-16.
It should be stressed that the EGG signal is influenced by many factors that alter the electric impedance through the neck, such as larynx extrinsic muscle contraction, varia-tions of larynx position during phonation and degree of dilatation of large neck vessels. These variables can, how-ever, be removed by high-pass filtering of the raw EGG signal. Other potential factors for impedance variation in-clude: excess adipose tissue in the neck that may obstruct the recording of the EGG signal, or the presence of mucus strands which may act as a direct path for current flow through the open glottis, thus simulating vocal fold con-tact. Besides these limits, EGG shows other disadvantag-es: large variability among individuals prevents the defini-tion of pathological and normal voice and the definidefini-tion
of the type of pathology; the EGG signal does not contain information either about the glottal area during opening or the air flow that passes through or the side which is possibly affected by pathologies (left or right). Moreover, the EGG cannot measure the amplitude of the mucosal wave or the anterior-posterior asymmetry, because it is a cumulative measurement of the vocal fold contact for all
points that pass through the glottis 4 5 17.
The EGG signal as it is still currently analysed is signifi-cant only when vocal folds have a certain degree of con-tact and does not specify the point where the concon-tact itself is taking place. Moreover, the simple EGG signal does not provide any information to allow precise determina-tion of the moment at which the vocal folds contact starts
as well as the moment in which their separation starts 4 18.
For this reason, the EGG signal has been generally subdi-vided into a “contact phase” (which includes both phases of increase and reduction of the vocal fold contact) and a “minimal contact phase” (which includes all the phases of
apparent missing contact of the vocal folds) 4. Based on
these limits, several quantitative parameters related to the closure phase have been developed to describe the EGG signal. Among these, “contact quotient” (CQEGG) (ratio of contact phase duration to the fundamental period) is
worth mentioning 19 20 and the “contact index” (difference
between increasing and decreasing vocal fold contact
du-rations, divided by total contact phase duration) 20.
In fact, the EGG is a one-dimensional signal obtained from the complex three-dimensional motion of the vocal folds. The speed of such motion is strictly related to the contacting and decontacting phases of the vocal folds activity. The first mathematical derivative of the EGG waveform (DEGG)
represents the speed of change of the EGG with time 5. It is
a common assumption that the maxima found in the DEGG signal always coincide with the moments of glottal closure and opening; thus, the exact timing of glottal closure can be easily obtained from a single maximum in the DEGG
signal 21 22. Some recent findings suggest that DEGG peaks
do not always coincide with the events of glottal closure and initial opening. Vocal fold contacting and decontacting do not occur at infinitesimally small instants of time, but ex-tend over a certain interval (0.24-10.88%), particularly
un-der the influence of anterior-posterior phase differences 22.
Nevertheless, the EGG and its first derivative are rich in use-ful information about the vocal folds activity, which is the result of the complex process of phonation at larynx level. Already in the early 1990s, Ursino and colleagues studied the correlation between the EGG signal and its first
deriva-tive using the Lissajous curve 23. The wider dispersion in
the graphs obtained using the Lissajous curve, typical of a wider variability of the EGG and its prime derivative (and
thus wider variation in the velocity of vibration), proved to be typical of pathological voices. Ursino’s work takes credit for stressing the importance of studying the correlation be-tween EGG and DEGG in the investigation of normal and pathological voices, even though the limits set by that signal processing approach did not allow to determine the disper-sion and, consequently, to discriminate euphonic voice from
dysphonic voice 23.
Dysphonia caused by vocal fold lesions, paralyses and oth-er pathological conditions are genoth-erally associated with a greater irregularity of the EGG signal. Many of these insta-bilities in the signal are related to the intrinsic non-linearity in the vibration of the vocal folds. These irregularities are thought to arise from the intrinsic nonlinearity of the vocal system and have been extensively examined by the theories
of non-linear dynamics 24. Using the non-linear dynamic
methods, it was possible to quantitatively describe the regu-lar and irreguregu-lar dynamics of the vocal folds, such as in
asymmetric vocal folds and polyps 25 26. Moreover, this
ap-proach was successfully employed to characterise different “vibratory states” of the vocal folds occurring during the
transition between modal and falsetto voice 27.
In a recent work, we presented a new approach for the analysis of the electroglottographic signal; the method of this study is based on the EGG signal and its first deriva-tive; which allows the extraction of quantitative indices about the EGG activity during the contacting-decontact-ing phases of the vocal folds process durcontacting-decontact-ing steady-state
vocal tests 28. We carried out EGG analysis of 21 normal
and 21 pathological voices, considering the variability based on the combined amplitude-velocity analysis, in or-der to demonstrate any quantitative differences between pathological and normal subjects. In normal subjects, the global variability index (VI) (expression of Ampli-tude and Velocity variation) was definitely lower than in pathological subjects. Despite the small sample, the above method for analysing the EGG signal proved to be effi-cient in discriminating normal subjects from pathological
ones 28. The aim of this work is to confirm from a
clini-cal point of view the data from our previous study using a larger study group, and to assess and evaluate possible differences between the various pathologies.
Materials and methods
A total of 95 subjects were enrolled and divided into two groups (35 normal subjects and 60 pathological subjects); among pathological subjects, 15 showed functional dys-phonia, 45 showed organic dysphonia. Subjects affected by organic dysphonia presented: 15 bilateral vocal nod-ules, 15 unilateral polyps and 15 unilateral cysts.
All subjects were studied with videolaryngostrobosco-py (KayPENTAX RLS 9100 Digital Strobo). Parametric analysis of voice quality during phonation of the “a” vowel was performed using Multidimensional Voice Program (MDVP) (KayPENTAX CSL Model 4500). Spectrographic analysis was carried out during pro-longed phonation of the vowel “a” with the CSL Main Program (KayPENTAX CSL Model 4500). Laryngeal electroglottography (KAY Model 6103) was performed on all subjects while phonating the “a” vowel at a com-fortable pitch and loudness.
EGG and amplitude-speed combined analysis of electro-glottographic signal variability
In clinical audiological lab, the electroglottographic sig-nal is commonly recorded using commercial instrumenta-tion (in our case KAY Model 6103) through two metallic electrodes positioned at the left and right side of the throat at the level of the vocal folds.
Variations in the position of the electrodes, muscular ac-tivity and movement of the other neck tissues may cause “noise” in the EGG signal which appears as low frequen-cy baseline drift, high frequenfrequen-cy noise and artefacts. To limit this “noise”, an accurate protocol for signal acquisi-tion needs to be adopted in the laboratory: accurate posi-tion of electrodes, fixed and relaxed posiposi-tion of the sub-ject, choice of simple vocal test and with short duration, subject awareness regarding the test to be performed and the actions to be avoided. Despite these precautions, some noise could still be present in the signal; signal pre-pro-cessing has to be carried out to reduce residual artefacts and enhance the real EGG component.
The EGG signal was obtained from commercial instru-mentation in the form of a standard WAV file with a sam-pling rate of 44 kHz. In each recording, a sub-interval of 7 seconds was selected by visual inspection of the EGG signal according to the presence of noise/artefacts and amplitude stability.
All signal processing was done using the software pack-age MatLab Vers. R2012a-Win64 (Mathworks Inc.). The EGG signal recorded during a continuous vocal phonation was processed in order to obtain the first de-rivative, which is related to the velocity of the contact-ing change of the vocal folds. The average fundamental frequency was computed and its corresponding period was taken as the typical duration of the EGG cycle. After each glottal cycle was identified, the EGG signal
and its derivative are locally normalised in time 28. It is
therefore possible to obtain a graphic representation of both the EGG filtered signal (red line) and its first de-rivative (speed of change of the EGG with time) (blue
line). The lighter red and blue areas around the main lines represent the variability of the EGG signal and its first derivative (Fig. 1).
Besides the above-mentioned graph, for each glottal cycle the amplitude and related velocity signals can be plotted on an X-Y axis, thus forming a multi-layer display where each EGG cycle appears as a circular trace. This X-Y rep-resentation can be viewed as a polar graph: by increas-ing the angle from 0 to 360° with incremental steps cor-responding to the time normalisation re-sampling of the EGG cycle, mean value and standard deviation (SD) are computed. The results are the amplitude-velocity mean cycle curve and the related SD curve. The shape of the mean loop is strictly associated with the relationships be-tween amplitude-velocity changes and phonation phases. The surrounding area represents the variability of local vocal phenomena around the above mean curve. Besides the bi-dimensional representation just described, the sig-nal can be plotted on an X-Y-Z graph (3D representation): the traces are formed by points where the X coordinate corresponds to the EGG samples, Z coordinate is the cor-responding first-derivatives and Y is time. The different colours of the traces (from dark blue to red) show the time flow (Figs. 2, 3).
Fig. 1. Graphic representation of both EGG filtered signal (red) and its first derivative (speed of change of the EGG with time) (blue) in patients of study group (A: Functional; B: Bilateral nodules; C: Polyp; D: Cyst). The lighter red and blue areas around the main lines compared to main lines (representation of the variability of the EGG signal and its first derivative) are more evident than in the normal control.
The phonation process can be characterised in more de-tail by computing couples of indices (mean and standard deviation) as obtained by dividing the polar graph in 4 quadrants, approximately associated with the different
phases of the glottal cycle (Fig. 4) 28. Since each quadrant
is associated with a specific behaviour of the vocal folds, four variability indices VI were extracted, one for each quadrant. The quadrants are numbered clockwise starting from the top-left position. These indices offer a compact view of the variability of the glottal waves in significant physiological phases. Variability in each quadrant can be calculated as both absolute value and a percentage of the total value. The parameters are therefore represented by the following:
• VI-Q1 and VI-Q1%: during the initial vocal folds con-tacting activity;
• VI-Q2 and VI-Q2%: during the last phase of vocal folds contacting;
• VI-Q3 and VI-Q3%: during the first phase of vocal folds decontacting;
• VI-Q4 and VI-Q4%: during the last phase, up to the complete decontacting of vocal folds.
Finally, a total variability index VI-tot is computed 28.
Statistical analysis
The data were analysed using SPSS v.21.0 (IBM Corp., Armonk, NY, USA) and the results were considered sig-nificant for p values < 0.05.
Categorical variables were expressed as percentages, whereas continuous variables were expressed as interquartile range (Median; IQR; Min and Max). In the first step, the
Kolmog-orov-Smirnov test was performed 29 to verify the normality
and the homoscedasticity of quantitative variables (VI-tot, VI-Q1, VI-Q1%, VI-Q2, VI-Q2%, VI-Q3, VI-Q3%, VI-Q4, VI-Q4%). The VI-tot, VI-Q1%, VI-Q3, VI-Q4 and VI-Q4% variables resulted in a normal distribution, opposite to, the VI-Q1, VI-Q2, VI-Q2% and VI-Q3% parameters. For this reason, we employed median values and non-parametric tests in the comparison between normal vs. pathological subjects. Mann-Whitney U statistic (non-parametric for two inde-pendent comparison) was performed to compare the me-dian of different variables (tot, Q1, Q1%, VI-Q2, VI-Q2%, VI-Q3, VI-Q3%, VI-Q4, VI-Q4%) between normal and pathological groups.
Fig. 2. X-Y plot of synchronised EGG cycles in 2D (A) and in 3D (B) version in a normal subject; the traces are formed by points where the X coordi-nates are the EGG samples, Z are the corresponding first-derivatives and Y are the time. The different colour (from dark blue to red) of the traces shows the time flow.
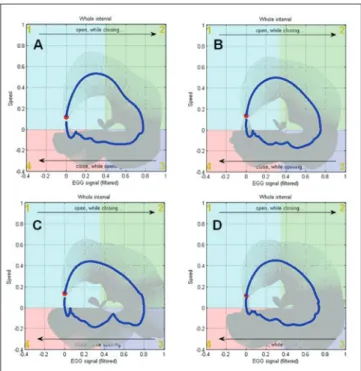
Fig.4. EGG representation of the phonation process at vocal folds level in pathological voice (A: Functional; B: Bilateral nodules; C: Polyp; D: Cyst). The figure is divided in 4 quadrants corresponding to different phases of the glot-tal cycle. The blue trace represents the mean EGG cycle, starting from the red circle. The grey segments crossing the blue line are the SD of normalised cycles, which is the variability of the EGG process.
Fig. 3. The same representation as Fig. 2, in a patient with pathological voice (Cyst).
Results
Normal vs Pathological
Comparing the variability indices in the normal and path-ological groups, we obtained the following results: the total VI showed significantly higher values in the patho-logical group (p = 0.01) (Fig. 5). As far as the absolute values are concerned (VI-Q1, VI-Q2, VI-Q3, VI-Q4), a significant difference was not observed, even though the absolute VI-Q2, VI-Q3 and VI-Q4 values were higher in the pathological group compared to the normal group (VI-Q2, 0.041 vs 0.029; VI-Q3, 0.065 vs 0.058; VI-Q4, 0.054 vs 0.052). It should be emphasised that the difference VI-Q2 was at the boundaries of significance.
The percent variability in each quadrant VI-Q2% was significantly higher in the pathological group (p = 0.01); VI-Q1% and VI-Q4% were higher in the normal group (p = 0.01 and p = 0.02 respectively). The VI-Q3% value difference was not statistically significant.
Data relevant to the difference in the variability indices are summarised in Table I.
Discussion and conclusions
EGG is a non-invasive method that indirectly monitors vo-cal folds vibration by measuring the electrivo-cal impedance in the electrodes placed on the dermis above the thyroidal cartilage. In this way, EGG indirectly measures contact
extension between the two vocal folds 1 2. To date EGG
stands out as the most representative, although indirect, investigation of vibration of the vocal folds, particularly
as far as the closure phase is concerned 7 8.
Notwithstand-ing its advantages, EGG suffers from some limitations. In particular, variability of the EGG signal makes the distinction between pathological and normal voices dif-ficult, as well as impossible to distinguish the various types of pathologies of the glottic plane. In fact, the EGG wave is easily influenced by both the normal variations of the cordal vibration and by mucus strands across the
glottis 5 17. The EGG signal, as it is currently analysed, is
significant only when vocal folds have a certain degree of contact; however, it does not specify the point where contact occurs. Moreover, the simple EGG signal does not provide any information to precisely determine the ment at which the vocal fold contact begins or the
mo-ment at which the vocal folds start to separate 4 18.
Several physical and mathematical models have been em-ployed to identify EGG signal landmarks, which should represent physiological and morphological aspects of cordal vibration. Many of those techniques offer a de-tailed vision of the cordal vibration process, yet the op-erator is required to carry out morphological analysis and
visual inspection of the curves obtained 30.
In fact, the EGG is a one-dimensional signal obtained from the complex three-dimensional motion of the vocal folds. The speed of such motion is strictly related to the contacting and decontacting phases of the vocal folds activity. The first mathematical derivative of the EGG waveform (DEGG)
rep-resents the speed of change of the EGG with time 5.
The EGG wave and the behaviour of its prime derivative are rich in information about vocal folds activity. In particular, quantitative analysis of the combined variability of ampli-tude and velocity in the EGG graph may offer a precious tool to evaluate the actual behaviour of the vocal folds in
normal and pathological voices 28. In one of our previous
studies, we illustrated a new approach to elaborate data ob-tained from the electroglottographic signal. This method is based on the combined analysis of the EGG signal and its prime derivative; this allows calculation of quantitative indices related to electroglottographic activity during the contacting-decontacting phases of the vocal folds process in steady-state vocal tests. In particular, we have worked out the variability index (VI), which represents the combined
variation in amplitude and velocity of the EGG signal 28.
The results of this preliminary study on 21 euphonic sub-jects and 21 dysphonic subsub-jects showed that VI could dis-tinguish normal voice from pathological voice.
In the present study, we have broadened the sample of both normal and pathological subjects, with the aim of confirming from a clinical standpoint the results obtained from our previous work, as well as identifying and evalu-ating eventual differences among the various pathologies. The results herein, carried out on 95 subjects (35 euphonic
Fig. 5. VI-tot values sorted by normal and pathologic population. The box plot diagram shows the distribution of median, interquartile range, minimum and maximum, and outlier observed values.
and 60 pathological), confirm that the total variability in-dex (VI-tot), which represents the global variability of the recorded signal, turns out to be a higher index in dysphonic subjects than in the control group (p = 0.01). The study of the variability indices in each quadrant, representing the differ-ent phases of the glottic cycle (initial vocal folds contacting activity; last phase of vocal folds contacting; first phase of vocal folds decontacting; last phase up to the complete de-contacting of vocal folds), showed a significant difference for VI-Q2% (p = 0.01), and at the boundaries of significance for VI-Q2, evidence of a higher signal disturbance during the last phase of vocal folds contacting in a pathological subject. In fact, the study group included 45/60 organic dysphonias (bilateral nodules, unilateral polyps and unilateral cysts), for which it is conceivable that the last phase of vocal folds con-tacting was the most disturbed one. The absolute values in the other quadrants (VI-Q1, VI-Q3, VI-Q4) were not signifi-cantly different way between normal and pathological sub-jects. This result confirms the above assumptions, i.e. that combined variability of amplitude and velocity of the EGG is higher only during the last phase of vocal folds contacting. The percent variability index in the single quadrants reflects the percentage index of variability in each phase of the glot-tis cycle in relation to the total variability. In our study, the VI-Q2% was clearly higher in pathological subjects than in normal subjects; on the other hand, the remaining per-centage indices (VI-Q1%, VI-Q3%, VI-Q4%) were clearly higher in normal subjects than in pathological subjects. For
this reason, being VI-tot higher in pathological subjects, the percentage value to be considered as significant is VI-Q2%. Due to the limited size of the samples of each pathological subgroup, it was not possible to perform a statistical eval-uation aimed at pointing out potential differences between organic or functional dysphonia and various patterns of the EGG signal among the several organic pathologies. Further studies on larger groups of subjects will be re-quired to confirm these results, assess any quantitative difference in the various phases of the glottal cycle and to highlight any difference in EGG signal among the various vocal fold pathologies.
Conflict of interest statement
None declared.
References
1 Baer T, Löfqvist A, McGarr NS. Laryngeal vibrations: a compari-son between high-speed filming and glottographic techniques. J Acoust Soc Am 1983;73:1304-8. https://doi.org/10.1121/1.389279 2 Howard DM. Electroglottography/electrolaryngography. In: Fried
MP, Ferlito F, editors. The Larynx. Third edition. San Diego, CA: Plural Press; 2009. pp. 227-43.
3 Hampala V, Garcia M, Svec JG, et al. Relationship between the electroglottographic signal and vocal fold contact area. J Voice 2016;30:161-71. https://doi.org/10.1016/j.jvoice.2015.03.018 4 Orlikoff RF. Scrambled EGG: the uses and abuses of
electroglot-tography. Phonoscope 1998;1:37-53. Table I. Differences in variability indices between normal and pathological subjects.
N Median IQR Min Max Mann-Whitney U test
VI-tot Normal 35 0.18 0.14 0.22 0.10 0.28 0.01 Pathologic 60 0.25 0.14 0.42 0.07 0.67 VI-Q1 Normal 35 0.03 0.02 0.04 0.01 0.05 0.77 Pathologic 60 0.03 0.02 0.05 0.00 0.08 VI-Q1% Normal 35 0.15 0.13 0.19 0.04 0.27 0.01 Pathologic 60 0.12 0.08 0.15 0.00 0.42 VI-Q2 Normal 35 0.03 0.02 0.04 0.01 0.10 0.07 Pathologic 60 0.04 0.02 0.17 0.01 0.66 VI-Q2% Normal 35 0.16 0.13 0.20 0.11 0.39 0.01 Pathologic 60 0.22 0.15 0.41 0.07 0.99 VI-Q3 Normal 35 0.06 0.05 0.08 0.02 0.12 0.34 Pathologic 60 0.07 0.05 0.10 0.00 0.20 VI-Q3% Normal 35 0.34 0.32 0.38 0.13 0.46 0.09 Pathologic 60 0.33 0.26 0.36 0.00 0.48 VI-Q4 Normal 35 0.05 0.05 0.07 0.04 0.13 0.73 Pathologic 60 0.05 0.04 0.08 0.00 0.17 VI-Q4% Normal 35 0.30 0.29 0.36 0.21 0.46 0.02 Pathologic 60 0.29 0.19 0.34 0.00 0.48
5 Childers DG, Krishnamurty AK. A critical review of electroglottog-raphy. Crit Rev Biomed Eng 1985;12:131-61.
6 Baken RJ, Orlikoff RF. Clinical measurement of speech and voice. Second edition. San Diego, CA: Singular Publishing Group; 2000. 7 Fourcin A. Precision stroboscopy, voice quality and
electroglottog-raphy. In: Kent RD, Ball MJ, editors. Voice quality measurement. San Diego, CA: Singular Publishing Group; 2000. pp. 413-27. 8 Hirano M. Clinical examination of voice. New York, NY: Springer
Verlag; 1981.
9 Saito M, Imagawa H, Sakakibara K, et al. High-speed digital imag-ing and electroglottography of tracheoesophageal phonation by Amatsu’s method. Acta Otolaryngol 2006;126:521-5. https://doi. org/10.1080/00016480500415613
10 Ursino F, Panattoni G, Pardini L, et al. Correlazione tra elettroglot-tografia e pressione sottoglottica cosiddetta “dinamica”: metodica e risultati preliminari. In: Piragine F, Ursino F, editors. La semei-otica foniatrica strumentale nella patologia vocale non neoplastica. Relazione Ufficiale del XXIV Congresso Nazionale della Società Italiana di Foniatria e Logopedia. Padova: Acta Phoniatrica Latina-Editrice “La Garangola”; 1990. pp. 115-36.
11 Ursino F, Pardini L, Panattoni G, et al. A study of EGG and si-multaneous subglottal pressure signals. Folia Phoniatr (Basel) 1991;43:220-5.
12 Hosokawa K, Yoshida M, Yoshii T, et al. Effectiveness of the com-puted analysis of electroglottographic signals in muscle tension dysphonia. Folia Phoniatr Logop 2012;64:145-50. https://doi. org/10.1159/000342146
13 Somanath K, Mau T. A measure of the auditory-perceptual quality of strain from electroglottographic analysis of continuous dyspho-nic speech: application to adductor spasmodic dysphonia. J Voice 2016;30:770.e9-e21. https://doi.org/10.1016/j.jvoice.2015.11.005 14 Fourcin A, Abberton E, Miller D, et al. Laryngograph: speech
pat-tern element tools for therapy, training and assessment. Eur J Dis-ord Commun 1995;30:101-5.
15 Howard DM. Variation of electrolaryngographically derived closed quotient for trained and untrained adult female singers. J Voice 1995;9:163-72.
16 Herbst CT, Howard DM, Schlomicher-Their J. Using electroglot-tographic real-time feed-back to control posterior glottal adduction during phonation. J Voice 2010;24:72-85. https://doi.org/10.1016/j. jvoice.2008.06.003
17 Childers DG, Hicks DM, Moore GP, et al. Electroglottography and vocal fold physiology. J Speech Hear Res 1990;33:245-54. https:// doi.org/10.1044/jshr.3302.245
18 Colton RH, Conture EG. Problems and pitfalls of electroglottogra-phy. J Voice 1990;4:10-24.
19 Rothenberg M, Mahshie JJ. Monitoring vocal fold abduction through vocal fold contact area. J Speech Hear Res 1988;31:338-51. https://doi.org/10.1044/jshr.3103.338
20 Orlikoff RF. Assessment of the dynamics of vocal fold contact from the electroglottogram: data from normal male subjects. J Speech Hear Res 1991;34:1066-72. https://doi.org/10.1044/jshr.3405.1066 21 Childers DG, Naik JM, Larar JN, et al. Electroglottography, speech,
and ultra-high speed cinematography. In: Titze IR, Scherer R, edi-tors.Vocal fold physiology and biophysics of voice. Denver: Denver Center of Performing Arts; 1983. pp. 202-20.
22 Herbst CT, Lohscheller J, Svec JG, et al. Glottal opening and closing events investigated by electroglottography and super-high-speed vid-eo recordings. J Exp Biol 2014;15:955-63. https://doi.org/10.1242/ jeb.093203
23 Ursino F, Pardini L, Grosjacques M, et al. Approccio personale com-puterizzato all’elettroglottografia nel soggetto normale e patologico. In: Piragine F, Ursino F, editors. La semeiotica foniatrica strumentale nella patologia vocale non neoplastica. relazione ufficiale del XXIV congresso nazionale della Società Italiana di Foniatria e Logopedia. Padova: Acta Phoniatrica Latina-Editrice “La Garangola”; 1990. pp. 95-113.
24 Packard NH, Crutchfield JP, Farmer JD, et al. Geometry from a time series. Phys Rev Lett 1980;45:712-6.
25 Behrman A. Global and local dimension of vocal dynamics. J Acoust Soc Am 1999;105:432-43. https://doi.org/10.1121/1.424573 26 Herbst CT, Herzel H, Svec JG, et al. Visualization of system dynam-ics using phasegrams. J R Soc Interface 2013;10:20130288. https:// doi.org/10.1098/rsif.2013.0288
27 Selamtzis A, Ternstrom S. Analysis of vibratory states in phonation using spectral features of the electroglottographic signal. J Acoust Soc Am 2014;136:2773-83. https://doi.org/10.1121/1.4896466 28 Macerata A, Nacci A, Manti M, et al. Evaluation of the
electroglot-tographic signal variability by amplitude-speed combined analysis. Biomed Signal Process Control 2017;37:61-8.
29 Chakravarti IM, Laha RG, Roy J. Handbook of methods of applied statistics. Volume 1. New York: John Wiley and Sons; 1967. 30 Berg R, Gall V. Voice cascadation and electroglottography-Basics
and practise. In: Dejonckere PH, Peters HFM, editors. Communica-tion and its disorders: a science in progress. Volume 1. Proceedings of the 24th congress international Association of Logopedics and
Phoniatrics, Amsterdam, The Netherlands. Groningen: International Association of Logopedics and Phoniatrics; 1999. pp. 5-8.
Received: February 24, 2018 - Accepted: March 26, 2018
Address for correspondence: Andrea Nacci, ENT, Audiology and Phoniatrics Unit, University of Pisa, Cisanello Hospital, via Paradisa 2, I-56124 Pisa, Italy. E-mail: [email protected]
How to cite this article: Nacci A, Romeo SO, Cavaliere MD, et al. Comparison of electroglottographic variability index in euphonic
and pathological voice. Acta Otorhinolaryngol Ital 2019;39:381-388. https://doi.org/10.14639/0392-100X-2127
This is an open access article distributed in accordance with the Creative Commons Attribution Non Commercial (CC BY-NC 4.0) license, which permits others to distribute, remix, adapt, build upon this work non-commercially, and license their derivative works on different terms, provided the original work is properly cited, appropriate credit is given, any changes made indicated, and the use is non-commercial. See: http://creativecommons.org/licenses/by-nc/4.0/.