Accepted Manuscript
Title: Expression of iNOS, CD163 and ARG-1 taken as M1 and M2 markers of microglial polarization in human
glioblastoma and the surrounding normal parenchyma
Authors: L. Lisi, G.M.P. Ciotti, D. Braun, S. Kalinin, D. Curr`o, C. Dello Russo, A. Coli, A. Mangiola, C. Anile, D.L. Feinstein, P. Navarra
PII: S0304-3940(17)30202-1
DOI: http://dx.doi.org/doi:10.1016/j.neulet.2017.02.076
Reference: NSL 32688
To appear in: Neuroscience Letters Received date: 17-1-2017
Revised date: 27-2-2017 Accepted date: 28-2-2017
Please cite this article as: L.Lisi, G.M.P.Ciotti, D.Braun, S.Kalinin, D.Curr`o, C.Dello Russo, A.Coli, A.Mangiola, C.Anile, D.L.Feinstein, P.Navarra, Expression of iNOS, CD163 and ARG-1 taken as M1 and M2 markers of microglial polarization in human glioblastoma and the surrounding normal parenchyma, Neuroscience Letters http://dx.doi.org/10.1016/j.neulet.2017.02.076
This is a PDF file of an unedited manuscript that has been accepted for publication. As a service to our customers we are providing this early version of the manuscript. The manuscript will undergo copyediting, typesetting, and review of the resulting proof before it is published in its final form. Please note that during the production process errors may be discovered which could affect the content, and all legal disclaimers that apply to the journal pertain.
1
Expression of iNOS, CD163 and ARG-1 taken as M1 and M2 markers of microglial
polarization in human glioblastoma and the surrounding normal parenchyma
Lisi L
1, Ciotti G.M.P.
1, Braun D
2, and Kalinin S
2, Currò D
1, Dello Russo C
1, Coli A
3,
Mangiola A
4, Anile C
4, Feinstein DL
2,5, Navarra P
11 Institute of Pharmacology, Catholic University Medical School, L.go F. Vito 1, Rome, Italy; 2 Department of Anesthesiology, University of Illinois at Chicago, Chicago, Illinois, USA; 3Institute of Pathology, Catholic University Medical School, Rome Italy;
4Institute of Neurosurgery, Catholic University Medical School, Rome Italy;
5Department of Veterans Affairs, Jesse Brown VA Medical Center, Chicago, Illinois, USA.
Lisi Lucia: [email protected]
Ciotti Gabriella Maria Pia: [email protected] Braun David: [email protected]
Kalinin Sergey: [email protected]
Currò Diego: diego.currò@unicatt.it
Dello Russo Cinzia: [email protected] Coli Antonella: [email protected]
Mangiola Annunziato: [email protected] Anile Carmelo: [email protected]
Feinstein Douglas: [email protected]
* To whom the correspondence should be addressed: Pierluigi Navarra
Institute of Pharmacology
Catholic University Medical School L.go F. Vito 1, 00168 Rome – Italy Tel: +39-0630154367
Fax: +39-063050159
email: [email protected]
2
M1 (iNOS) and M2 (CD163 , ARG-1) markers of microglia polarization were investigated in GBM tumors and in the surrounding parenchyma from the same patients
CD163 expression was higher within GBM specimens than in surrounding periphery in both male and female patients, and was inversely correlated with mean survival times.
A prevailing iNOS-like profile was present within the tumor, at variance with the peripheral parenchyma surrounding the tumor.
No significant association was found between ARG-1 or iNOS expression and survival time.
ABSTRACT
Microglia and macrophages appear to be the most common cells in the GBM microenvironment. In the present study we investigated the status of macrophages/microglia activation in surgical specimens from 41 patients diagnosed with grade IV GBM. For each patient we analyzed both the center of tumor and the parenchyma surrounding the tumor. The specimens were stained for: i) IBA1, a 17-kDa EF hand protein specifically expressed in microglia/macrophages ii) CD163, a cell surface antigen associated with M2 phenotype; iii) iNOS, taken as a functional marker of M1 phenotype, and iv) ARG-I, taken as a functional marker of M2 phenotype. Staining was scored in a double-blinded score on a scale from 0 to 5. Our results suggest that CD163 expression is higher within the tumor than in surrounding periphery in both male and female patients; while iNOS is higher within the tumor in males, no significant difference was found for ARG-1. In addition, analyzing the data in TGCA database, we found that CD163 expression was significantly and inversely correlated with mean survival times, with average survival times ranging from 448 days in patients having low expression, to 319 in mid, and 353 in patients with high CD163 expressing tumors. In contrast, no significant association was found between survival time and ARG-1 or iNOS expression.
Keywords: Glioblastoma, microglia, M1 polarization, M2 polarization, tumor, periphery, iNOS,
ARG-I, CD163.
3 Glioblastoma (GBM) is the most frequent and lethal primary brain tumor in adults, representing 15% of all brain tumors [1]. Epidemiological data show an estimated incidence of 2–3 GBM cases per 100 000 adults in Europe and North America each year; the incidence rate in men compared to women is 1.26/1 [2]. Despite surgical resection, radiotherapy and chemotherapy, the average survival of GBM patients is 14-16 months, and the 5-year survival rate is 3.3% [3]. Given the poor results of current therapeutic strategies, which are mainly directed against GBM cells, other cellular types (vascular cells, microglia, peripheral immune cells, and neural precursor cells) within the CNS might be envisioned as targets for the development of novel additional therapeutic options. Among these cells, tumor-associated resident microglia and macrophages appear to be the most common cells in the GBM microenvironment [4; 5; 6]. Studies of glioma specimens revealed that GBM contains a higher number of infiltrating macrophages compared to lower grade gliomas [7]. More recently, the activation status rather than the abundance of glioma-associated microglia/macrophages present in the tumor microenvironment has been suggested to have prognostic value [8; 9].
Similar to peripheral macrophages, microglia can acquire an activated M1 phenotype, characterized by the ability to release pro-inflammatory cytokines/mediators such as IL-1β, IL-6, TNF-α, CCL2, reactive oxygen species (ROS), and nitric oxide (NO) [10; 11]. Additionally, or alternatively, microglia can express an M2 phenotype, which is associated with the ability to produce anti-inflammatory and immune suppressive factors, including ARG-1, Ym1, and CD36, as well as to up-regulate the cell surface markers CD163, CD204 and CD206 and the anti-inflammatory cytokines, such as IL-10 [12]. Recently, M0 microglia (also referred to as resting microglia) have also been reported; M0 microglia are considered to possess an attenuated M2 phenotype. In healthy brain, M0 microglia show intrinsic properties contributing to the maintenance of a healthy environment for neuronal function [13]. Glioma associated microglia/macrophages (GAM) were found to express both M1/M2 polarization markers in human GBM specimens [14; 15; 16]. Looking at GAM profile, Gabrusiewicz and collaborators showed that a continuum exists between the M1 and M2 like phenotypes; in the apparent difficulty to distinguish between M1 and M2 phenotypes, these authors concluded that glioblastoma-infiltrated innate immune cells resemble M0 phenotype [17].
4 We have previously investigated the interaction between rat microglia and rat C6 glioma cells [18; 19]. Exposure to conditioned media obtained from C6 cells taken under baseline conditions induced a predominant M2-like phenotype in rat microglia. Conversely, if C6 cells were exposed to a medium containing pro-inflammatory agents, the subsequent exposure of microglia to such medium was followed by a shift toward a M1-like phenotype [18]. We interpreted these findings as the result of a positive-loop feed-back occurring between microglia and tumor cells: the exposure to inflammatory mediators causes tumor cells to release factor(s) able to shift the polarization state of microglia towards a M1 profile [18].
In the present work, we used tissue specimens of GBM obtained from the Neurosurgery Unit of the Catholic University Medical School to study microglia/macrophage polarization in GBM pathology. The surgical samples typically included at least 1-2 cm of peripheral parenchyma surrounding the tumor, hence we were able to compare the polarization status of microglia/macrophages within the tumor with that of microglia/macrophages localized in the peripheral parenchyma in each sample, allowing us to identify putative changes in polarization profile, possibly related with the proximity to tumor cells.
5 Methods
Patients and Specimens
We enrolled 41 adults mean age 58.5 (34-79), 27 males/14 females, that were operated for primary GBM at our Neurosurgery Department, from March 2005 to September 2011. We selected this group because in all cases a total tumor removal was achieved, allowing us to obtain tissues samples from both the tumor and the surrounding macroscopic normal brain tissue (between 1 cm and 2 cm from the tumor border; larger resections were performed in tumors that grew far from eloquent areas) [20; 21; 22]. All patients provided written consent to use their specimens for research purposes; none of them was identifiable. The local ethics committee (Catholic University Ethics Committee, Rome) approved the study. The ethical principles of the declaration of Helsinki were strictly followed.
Tissue preparation and immunohistochemistry
Human tumor tissue obtained from surgical resection of patients with grade IV GBM were fixed in 4% paraformaldehyde in 0.1 M phosphate buffer pH 7.6 overnight at 4°C. Dehydration of tissue was through a series of 80%, 95% ethanol one hour each followed by 100% ethanol overnight. Two 100% xylene washes were done for 1h each and then 1h in 60°C Paraplast Plus (Tyco/Healthcare, Mansfield, MA). After a change of Paraplast Plus, tissue was incubated in a 60°C vacuum oven for 2h prior to placing in molds to cool and solidify. Sections, 3-4 μm thick, were cut and mounted. Sections were deparaffinized by drying on superfrost plus slides (Fisher), heating at 56°C overnight, and then washing through mixed xylenes, 100% ethanol, 95% ethanol, ddH2O. Slides were immersed in 10 mM citrate buffer, pH 6.0, dry heated for 10 min each to unmask antigen sites, and then cooled and washed in PBS. Endogenous peroxidase activity was inhibited by rinsing the slides in 3% hydrogen peroxide for 5 min. Nonspecific binding was blocked by 5 min incubation with the Super Block Solution (ScyTek Laboratories, Utah, USA). After washing in PBS, sections were incubated for 30 minutes at room temperature with, Rabbit Anti-Human Arginase-1 Polyclonal Antibody (Spring Bioscience) 1:75, Rabbit Anti-Human CD163 Polyclonal Antibody (Spring Bioscience) 1:200, with Rabbit Anti-Human iNOS Polyclonal Antibody (Spring Bioscience) 1:75 or over-night with Goat Anti-Human Iba1 polyclonal antibody (Novus Biologicals) 1:250. The conditions of staining have been standardized in control tissues, using normal human lung as a control for iNOS and IBA1, and human hepato-carcinoma as a control for ARG-1. Sections were washed extensively with PBS and subsequently treated with the Ultra Tek Anti-Polyvalent kit
6 (ScyTek Laboratories). Finally sections were treated with 3,3’-diaminobenzidine as chromogen, contrasted with Hematoxylin and mounted [19].
Analysis
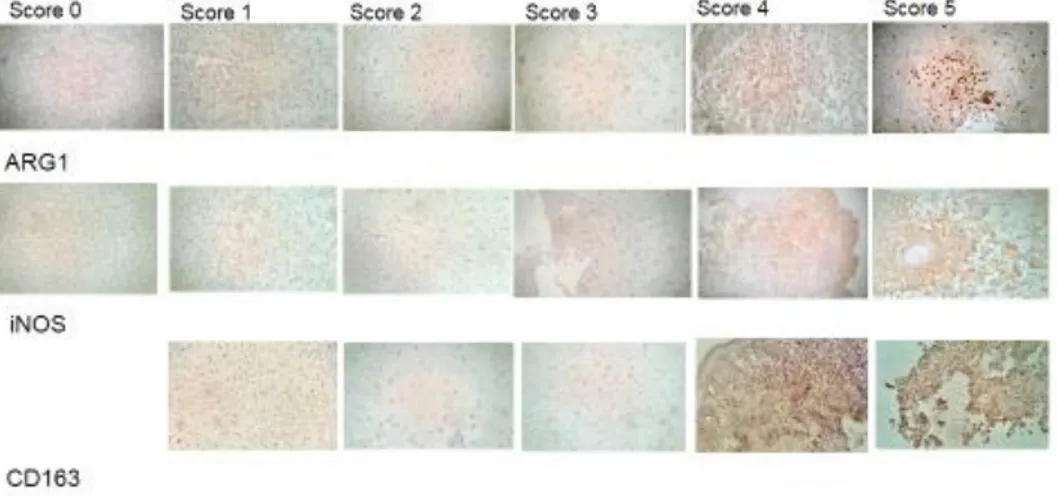
Staining of human specimens was evaluated by two examiners who were blinded as to the antibody used. Staining was scored on a scale from 0 to 5. In particular, score 0 indicates no significant staining, score 1 very low staining, score 2 low staining, score 3 significant staining, score 4 high staining and score 5 indicates very high staining. Figure 1 shows representative pictures for each antibody and score. Statistical comparisons between the average intensity of staining were made by non-parametric unpaired T-test. Correlations between staining scores were determined using non-parametric Spearman test. Chi-square test was used for the analysis of Δ data. Differences were taken as statistically significant if p < 0.05.
7
Results
Forty-one sections of glioma tissue obtained from surgical resection of patients diagnosed with grade IV GBM were stained for: i) IBA-1, a 17-kDa EF hand protein that is specifically expressed in microglia/macrophages ii) CD163, a cell surface antigen associated with M2 phenotype; iii) iNOS, taken as a functional marker of M1 phenotype, and iv) ARG-I, taken as a functional marker of M2 phenotype. For each patient we analyzed both the center of the tumor (T) and the parenchyma at the periphery of tumor (P), the latter defined as the tissue distant by at least 1-2 cm from the tumor border.
All specimens were positive for IBA-1. The intensity score for all the specimens was 4 or 5, with no difference either between tumor versus parenchyma or between female vs male gender. A representative field for the tumor and a representative field for the peripheral parenchyma, both scored 5 for IBA-1, are shown in figures 2A and 2B respectively. While the intensity of IBA-1 staining was similar between tumor and surrounding parenchyma, we observed a difference in microglia/macrophages morphology between the two areas, with a prevalence of amoeboid morphology within the tumor (Fig 2A) compared to a prevalence of resting morphology at the periphery (Fig 2B).
All specimens were positive for CD163 in both the tumor (T) and the parenchyma (P) (Table 1). In particular, 17% (6/41) of cases showed an intensity score in T equal to the intensity score in P, whereas 71% (30/41) of patients showed a higher intensity score in T compared to the periphery and only 12% (5/41) of patients showed a CD163 intensity score lower in the tumor compared to the periphery (Fig 3). Differently three tumor specimens and 6 cases of peripheral tissue were found negative for iNOS staining, with one case (#17) being negative in both T and P (Table 1). Looking at the individual cases, 22% (9/41) of cases showed an intensity score in T equal to the intensity score in P, whereas 66% (27/41) of patients showed a higher intensity score in T compared to the periphery; only 12% (5/41) of patients showed an iNOS intensity score lower in the tumor compared to the periphery (Fig 3). Finally four tumor specimens and 3 peripheral parenchyma specimens were found negative (score 0) for ARG-I staining, although these did not overlap. (Table 1). There were 34% (14/41) of cases showing an intensity score in T equal to the intensity score in P, whereas 46% (19/41) of patients showed a higher intensity score in T
8 compared to the periphery and only 20% (8/41) of patients showed an ARG-I intensity score lower in the tumor compared to the periphery (Fig 3).
Comparing the average intensity scores of our markers for the combined male plus female groups in T and P respectively (data expressed as the means ± SEM of 41 replicates per group), significant differences were found for both iNOS and CD163 (Fig 4). In the case of iNOS, the intensity score within the tumors was 2.46±0.21 versus 1.56±0.16 in the peripheral tissue. Likewise, the intensity score for CD163 staining was significantly higher within the tumors compared to the peripheral parenchyma: 3.32±0.18 versus 2.39±0.16. The difference between T and P staining for CD163 was also present in the individual male and female groups, whereas the difference for iNOS staining was present in the male, but not in the female group (Fig 4). In addition staining for CD163 in P was significantly greater in males than females. On the contrary, we found no significant difference between tumor and peripheral ARG-I staining in any of the groups (Fig 4).
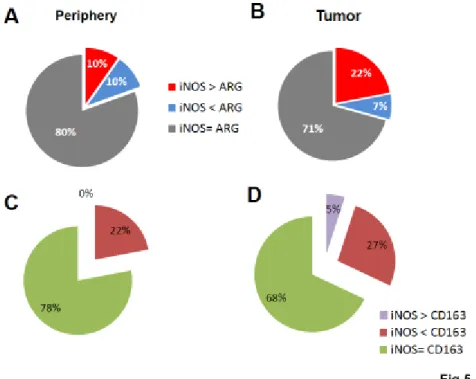
Not only it was relevant to show if there was any difference between marker expression in T versus P, but also to estimate the extent of such difference; having defined Δ as the difference between the iNOS and the ARG1 scores within the tumor (or in periphery) in each patient, or else as the difference between the iNOS and the CD163 scores within the tumor (or in periphery) in each patient, we looked at the rate of cases with Δ higher than 2 over the total of cases. In the periphery, 80% of the cases showed the same intensity score for iNOS and ARG-I, 10% of cases showed a higher Δ score for iNOS than ARG-I, and 10% of the cases showed a higher Δ score for ARG-I than iNOS (Fig 5A). Conversely in the tumors, we found a slightly lower number of cases (71%) showing the same intensity score for iNOS and ARG-I, and a marked, statistically significant prevalence of cases showing a higher Δ score for iNOS than ARG-I (22% of cases compared to 7% of cases with higher ARG-I Δ score) (Fig 5B).
The cross-analysis between CD163 and iNOS was somewhat less straightforward, and provided slightly different results compared to the iNOS-ARG-I comparison, mostly because we were comparing an inducible protein towards a surface antigen expressed in a constitutive manner by microglial cells. Nevertheless, in this case as well we found a statistically significant shift toward a M1 profile by moving from the periphery to the tumor, with a net 5% increase in cases were iNOS was prevalent compared to CD163 by a factor >2 (Fig 5C-D).
9 To determine if these expression patterns are associated with GBM survival, we interrogated the TCGA database [https://genome-cancer.ucsc.edu/proj/site/hgHeatmap/] (Fig 6). CD163 expression was significantly and inversely correlated with mean survival times, reducing average survival from 448 days in patients having low expression, to 319 in mid, and 353 in patients with high CD163 expressing tumors. In contrast, associations between survival time and Arg1 or iNOS expression did not reach statistical significance.
10 DISCUSSION
In the present study, we investigated the status of microglia/macrophages activation in surgical specimens from 41 patients diagnosed with IV grade GBM. For each patient we analyzed both the center of tumor and the parenchyma surrounding the tumor. In particular, we focused on the presence of microglia/macrophages cells both in tumor mass and in parenchyma surrounding the tumor, because microglia/macrophages may serve as a potential and additional target in GBM therapy. Regarding the parenchyma surrounding tumor, it is worth of note that neo-angiogenesis also occurs in the GBM peritumoral compartment [23]. Other factors correlated with the median patient survival time, pJNK and nestin have also been described in peritumoral tissue [24]. In addition, a recent paper suggests the occurrence of early tumorigenic events in GBM-neighboring tissue, as well as the involvement of cancer stem cells residing in the peritumoral niche in the GBM radio- and chemo-resistance [25].
Four different markers, namely IBA-1, CD163, iNOS and ARG-I, were investigated. Ionized calcium binding adaptor molecule 1 [IBA-1] is a 17 kDa EF hand protein whose expression is restricted to microglia/macrophages. IBA-1 is a key molecule in regulating membrane ruffling and phagocytosis; it is involved in the signaling pathways of calcium and Rho family small GTPase, as well as of Rac, which plays an essential role in regulating actin reorganization in membrane ruffling [26]. Expression of IBA-1 is up-regulated in activated microglia in several brain diseases [26]. Based on this evidence, in the present study we investigated the expression of IBA-1 in our samples, postulating changes in gene expression associated to the presence of GBM. However, we found that no significant difference in IBA-1 intensity score between tumor and periphery were found (Fig 2).
CD163 is a member of the scavenger receptor cysteine-rich (SRCR) family class B, and is expressed on most subpopulations of macrophages. CD163 has essentially a homeostatic activity; its best characterized function is the binding of Hemoglobin:Haptoglobin complexes [27]. In normal human CNS, CD163 is expressed by perivascular macrophages, but not by resident microglia [28]. However, under pathologic conditions both microglia and macrophages express CD163 [29; 30]. In addition, it has been suggested that CD163 positive cells or the soluble form of CD163 may play a role in inflammation processes, since they are found in high numbers in inflamed tissue [31]. CD163 has been recently associated to M2 polarization of microglia/macrophage. In particular,
11 CD163 was considered as a marker of M2a and M2c polarization status [32; 13]. A significant increase in CD163+ macrophages was observed in infiltrative gliomas [33]; in addition, CD163 expression was found to be elevated in high-grade gliomas with respect the low grade glioma [34]. In the present work, we show that CD163 expression is higher within GBM specimens than in surrounding periphery in both male and female patients. (Fig 4).
While CD163 data presented here show important findings, certain pitfalls concerning CD163 as a M2 marker should be taken into account when discussing our findings. In fact, Heusinkveld and van der Burg [35] reported that macrophage activation may result in a loss of expression of M2 markers (CD163, CD16), implying that the use antibodies against CD 163 only might be insufficient to fully demonstrate macrophage polarization toward the M2 type. These authors also suggested that the study of ‘functional’ markers of the M1/M2 phenotype (such as iNOS or ARG-1, as in the present study) might prove useful to overcome limitations associated to the use of CD163 alone.
iNOS and ARG-I give rise to two mediators, nitric oxide (NO) and ornithine respectively, that are involved in two opposite activities, pro-inflammatory (M1) versus anti-inflammatory function (M2) [36]. We were interested in these specific pathways because the enzymes both utilize L-arginine as substrate, and down regulate each other. The interplay between iNOS and ARG-I pathways is complex; in murine macrophages, ARG negatively regulates NOS activity by reducing the availability of L-Arg [37]. On the other hand, Nω-hydroxy-L-arginine, an intermediate in the synthesis of NO [38], is a competitive inhibitor of ARG [39]. Here we report that both iNOS (M1 marker) and ARG-1 (M2 markers) are present both within the tumor and in peripheral parenchyma, albeit unevenly distributed. Accordingly, gene expression analysis of GBM centers and peritumor areas reveals that RNA molecules are differentially expressed in tumor centers vs their respective peritumor areas [40].
Is there any correlation between iNOS, CD163 or ARG-I and patient survival? Unfortunately, our dataset was incomplete for the latter parameter, since many patients undergoing surgery in our center were followed up elsewhere; therefore, our data were largely insufficient to draw any statistical analysis. However, some indication might raise from the analysis of database available at the TCGA (The Cancer Genome Atlas) portal for survival in GMB [ https://genome-cancer.ucsc.edu/proj/site/hgHeatmap/]. Clinical information, genomic characterization data and high
12 level sequence analysis of tumor genomes are freely available at this site. For GBM, a total of 528 cases were available at the last update on March 7, 2016. One hundred and 65 cases out of 528 had data available for ARG-I, iNOS, CD163 gene expression, along with the relevant clinical histories. We carried out an analysis of these data dividing the cases (combining both male and female patients) into 3 groups based on gene expression levels. We found that survival was positively associated to lower CD163 expression levels, with the mean survival time increased to 448 days compared to 319 days in the middle group, and 353 in the high expressing group. We also observed an almost significant association (P= 0.0535) between increased survival time and lower ARG-I levels, with mean survival time increasing to 431 days versus 366 in the mid, and 324 days in the high expressing groups. We did not detect a significant relationship between survival time and iNOS expression (figure 6).
Finally, we would like to point out that, while the classification of macrophages or microglial cells into the M1 or M2 polarized state is a well-established approach in most preclinical models, the same is not true in the clinical research setting, because of a high-degree of diversity and plasticity shown by these cell types in human pathology. There is not a clear distinction between these phenotypes in many disorders. Cells within the tumor often display a complex pattern of phenotypes, up-regulating both M1 and M2 molecular markers, and the prevalence of one phenotype on the other might also depend on the stage of disease [16]. In light of such apparent difficulty in applying the M1/M2 paradigm to the CNS, it has been convincingly postulated that the notion of stimulus-dependent microglia phenotype should substitute that of microglia polarization [41, 42].
In conclusion, our data show that GBM influences microglia polarization, with a trend towards a iNOS-like profile respect to the periphery around the tumor. Additional studies are needed to fully elucidate the functional role of microglia within the glioma and see whether different microglia/ macrophage populations differentiate over time, and if a correlation exists between these changes and the outcome of disease, however M2 markers (CD163 marker) rather than M1 markers could be envisioned as prognostic marker. It is also possible to postulate that pharmacological strategies aimed at modulating microglial differentiation and modifying their polarization might have beneficial therapeutic effects.
13 COMPENTING INTEREST
14
Acknowledgement
The authors would like to thank Paola Lanza and Egidio Stigliano for kindly supporting us with the immunohistochemistry technique. DLF was supported by a Research Career Scientist award from the Department of Veterans Affairs.
Any conflict of interest to declare.
References
1)R.G. Verhaak, K.A. Hoadley, E. Purdom, V. Wang, Y. Qi, M.D. Wilkerson, C.R. Miller, L. Ding, T. Golub, J.P. Mesirov, G. Alexe, M. Lawrence, M. O'Kelly, P. Tamayo, B.A. Weir, S. Gabriel, W. Winckler, S. Gupta, L. Jakkula, H.S. Feiler, J.G. Hodgson, C.D. James, J.N. Sarkaria, C. Brennan, A. Kahn, P.T. Spellman, R.K. Wilson, T.P. Speed, J.W. Gray, M. Meyerson, G. Getz, C.M. Perou, D.N. Hayes, Cancer Genome Atlas Research Network. Integrated genomic analysis identifies clinically relevant subtypes of glioblastoma characterized by abnormalities in PDGFRA, IDH1, EGFR, and NF1. Cancer Cell 17 (2010) 98-110.
2) K. Urbańska, J. Sokołowska, M. Szmidt, P. Sysa, Glioblastoma multiforme – an overview, Contemp Oncol (Pozn) 18 (2014) 307-312.
3) L. Tentori, G. Graziani, Recent approaches to improve the antitumor efficacy of temozolomide, Curr Med Chem 16 (2009) 245-257.
4) B. Giometto, F. Bozza, F. Faresin, L. Alessio, S. Mingrino, B. Tavolato, Immune infiltrates and cytokines in gliomas, Acta Neurochir (Wien) 138 (1996) 50-56.
5) J.J. Watters, J.M. Schartner, B. Badie, Microglia function in brain tumors, J Neurosci Res 81 (2005) 447-455.
6) W. Roggendorf, S. Strupp, W. Paulus, Distribution and characterization of microglia/macrophages in human brain tumors, Acta Neuropathol 92 (1996) 288-293.
15 7) A. Nishie, M. Ono, T. Shono, J. Fukushi, M. Otsubo, H. Onoue, Y. Ito, T. Inamura, K. Ikezaki, M. Fukui, T. Iwaki, M. Kuwano, Macrophage infiltration and heme oxygenase-1 expression correlate with angiogenesis in human gliomas, Clin Cancer Res 5 (1999) 1107-1113.
8) Y. Komohara, K. Ohnishi, J. Kuratsu, M. Takeya, Possible involvement of the M2 anti-inflammatory macrophage phenotype in growth of human gliomas, J Pathol 216 (2008) 15-24.
9) S.M. Pyonteck, L. Akkari, A.J. Schuhmacher, R.L. Bowman, L. Sevenich, D.F. Quail, O.C. Olson, M.L. Quick, J.T. Huse, V. Teijeiro, M. Setty, C.S. Leslie, Y. Oei, A. Pedraza, J. Zhang, C.W. Brennan, J.C. Sutton, E.C. Holland, D. Daniel, J.A. Joyce, CSF-1R inhibition alters macrophage polarization and blocks glioma progression, Nat Med 19 (2013) 1264-1272.
10) H. Kettenmann, U.K. Hanisch, M. Noda, A. Verhratskym, Physiology of microglia, Physiol. Rev 91 (2011) 461–553.
11) K. Saijo, C.K. Glass, Microglial cell origin and phenotypes in health and disease, Nat Rev. Immunol 11 (2011) 775–787.
12) D.M. Mosser, J.P. Edwards, Exploring the full spectrum of macrophage activation, Nat Rev Immunol (2008) 958–969.
13) R. Franco, D. Fernández-Suárez, Alternatively activated microglia and macrophages in the central nervous system. Prog Neurobiol 131 (2015) 65-86.
14) K. Hattermann, S. Sebens, O. Helm, A.D. Schmitt, R. Mentlein, H.M. Mehdorn, J. Held-Feindt, Chemokine expression profile of freshly isolated human glioblastoma-associated macrophages/microglia, Oncol Rep 32 (2014) 270-276
15) F. Szulzewsky, A. Pelz , X. Feng, M. Synowitz, D. Markovic, T. Langmann, I.R. Holtman, X. Wang, B.J. Eggen, H.W. Boddeke, D. Hambardzumyan, S.A. Wolf, H. Kettenmann, Glioma-associated microglia/macrophages display an expression profile different from M1 and M2 polarization and highly express Gpnmb and Spp1, PLoS One 10 (2015) e0116644.
16 16) C. Dello Russo, L. Lisi, L. Tentori, P. Navarra, G. Graziani, C.K. Combs, Exploiting Microglial Functions for the Treatment of Glioblastoma, Curr Cancer Drug Targets. 2016 Aug 13. [Epub ahead of print]
17) K. Gabrusiewicz, B. Rodriguez, J. Wei, Y. Hashimoto, L.M. Healy, S.N. Maiti, G. Thomas, S. Zhou, Q. Wang, A. Elakkad, B.D. Liebelt, N.K. Yaghi, R. Ezhilarasan, N. Huang, J.S. Weinberg, S.S. Prabhu, G. Rao, R. Sawaya, d L.A. Langfor, J.M. Bruner, G.N. Fuller, A. Bar-Or, W. Li, R.R. Colen, M.A. Curran, K.P. Bhat, J.P. Antel, L.J. Cooper, E.P. Sulman, A.B. Heimberger, Glioblastoma-infiltrated innate immune cells resemble M0 macrophage phenotype. JCI Insight. 1 (2016).
18) L. Lisi, E. Stigliano, L. Lauriola, P. Navarra, C. Dello Russo, Proinflammatory-activated glioma cells induce a switch in microglial polarization and activation status, from a predominant M2b phenotype to a mixture of M1 and M2a/B polarized cells, ASN Neuro 6 (2014) 171-183.
19) L. Lisi, E. Laudati, P. Navarra, C. Dello Russo, The mTOR kinase inhibitors polarize glioma-activated microglia to express a M1 phenotype, J Neuroinflammation 11 (2014) 125.
20) A. Mangiola, P. de Bonis, G. Maira, M. Balducci, G. Sica, G. Lama, L. Lauriola, C. Anile, Invasive tumor cells and prognosis in a selected population of patients with glioblastoma multiforme, Cancer 113 (2008) 841-846.
21) G. Sica, G. Lama, C. Anile, M.C. Geloso, G. La Torre, P. De Bonis, G. Maira, L. Lauriola, M. Jhanwar-Uniyal, A. Mangiola, Int J Oncol 38 (2011) 41-49.
22) A. Mangiola, N. Saulnier, P. De Bonis, D. Orteschi, G. Sica, G. Lama, B.L. Pettorini, G. Sabatino, M. Zollino, L. Lauriola, A. Colabianchi, G. Proietti, G. Kovacs, G. Maira, C. Anile, Gene expression profile of glioblastoma peritumoral tissue: an ex vivo study, PLoS One 8 (2013) e57145.
23) A. Mangiola, G. Lama, C. Giannitelli, P. De Bonis, C. Anile, L. Lauriola, G. La Torre, G. Sabatino, G. Maira, M. Jhanwar-Uniyal, G. Sica, Stem cell marker nestin and c-Jun NH2-terminal kinases in
17 tumor and peritumor areas of glioblastoma multiforme: possible prognostic implications. Clin Cancer Res. 13 (2007) 6970-6977. Erratum in: Clin Cancer Res. 14 (2008) 4995-4996.
24) G. Sica, G. Lama, C. Anile, M.C. Geloso, G. La Torre, P. De Bonis, G. Maira, L. Lauriola, M. Jhanwar-Uniyal, A. Mangiola, Assessment of angiogenesis by CD105 and nestin expression in peritumor tissue of glioblastoma. Int J Oncol. 38 (2011) 41-49.
25) A. D'Alessio, G. Proietti, G. Lama, F. Biamonte, L. Lauriola, U. Moscato, A. Vescovi, A. Mangiola, C. Angelucci, G. Sica, Analysis of angiogenesis related factors in.glioblastoma, peritumoral tissue and their derived cancer stem cells. Oncotarget. 7 (2016) 78541-78556.
26) A. Stankov, V. Belakaposka-Srpanova, N. Bitoljanu, L. Cakar, Z. Cakar, G. Rosoklija, Visualisation of Microglia with the use of Immunohistochemical Double Staining Method for CD-68 and Iba-1 of Cerebral Tissue Samples in Cases of Brain Contusions, Pril (Makedon Akad Nauk Umet Odd Med Nauki) 36 (2015) 141-145.
27) B.O. Fabriek, C.D. Dijkstra, T.K. van den Berg, The macrophage scavenger receptor CD163. Immunobiology, 210 (2005) 153-160.
28) B.O. Fabriek, E.S. Van Haastert, I. Galea, M.M. Polfliet, E.D. Döpp, M.M. Van Den Heuvel, T.K. Van Den Berg, C.J. De Groot, P. Van Der Valk, C.D. Dijkstra, CD163-positive perivascular macrophages in the human CNS express molecules for antigen recognition and presentation, Glia 51 (2005) 297-305.
29) P. Pey, R.K. Pearce, M.E. Kalaitzakis, W.S. Griffin, S.M. Gentleman, Phenotypic profile of alternative activation marker CD163 is different in Alzheimer's and Parkinson's disease, Acta Neuropathol Commun 2 (2014) 21.
30) D.Y. Vogel, E.J. Vereyken, J.E. Glim, P.D. Heijnen, M. Moeton, P. van der Valk, S. Amor, C.E. Teunissen, J. van Horssen, C.D. Dijkstra, Macrophages in inflammatory multiple sclerosis lesions have an intermediate activation status, J Neuroinflammation 10 (2013) 35.
18 31) P. Rezaie, D. Male, Microglia in fetal and adult human brain can be distinguished from other mononuclear phagocytes through their lack of CD163 expression, Neuroembryology 2 (2003) 130– 133.
32) S. Colin, G. Chinetti-Gbaguidi, B. Staels, Macrophage phenotypes in atherosclerosis, Immunol Rev 262 (2014) 153-166.
33) C. Lu-Emerson, M. Snuderl, N.D. Kirkpatrick, J. Goveia, C. Davidson, Y. Huang, L. Riedemann, J. Taylor, P. Ivy, D.G. Duda, M. Ancukiewicz, S.R. Plotkin, A.S. Chi, E.R. Gerstner, A.F. Eichler, J. Dietrich, A.O. Stemmer-Rachamimov, T.T. Batchelor, R.K. Jain, Increase in tumor-associated macrophages after antiangiogenic therapy is associated with poor survival among patients with recurrent glioblastoma, Neuro Oncol 15 (2013) 1079-1087.
34) M. Prosniak, L.A. Harshyne, D.W. Andrews, L.C. Kenyon, K. Bedelbaeva, T.V. Apanasovich, E. Heber-Katz, M.T. Curtis, P. Cotzia, D.C. Hooper, Glioma grade is associated with the accumulation and activity of cells bearing M2 monocyte markers, Clin Cancer Res 19 (2013) 3776-86.
35) M. Heusinkveld, S.H. van der Burg, Identification and manipulation of tumor associated macrophages in human cancers, J Transl Med 9 (2011) 216.
36) C.D. Mills, M1 and M2 Macrophages: Oracles of Health and Disease, Crit Rev Immunol 32 (2012) 463-488.
37) M. Munder, K. Eichmann, J.M. Morán, F. Centeno, G. Soler, M. Modolell, Th1/Th2-regulated expression of arginase isoforms in murine macrophages and dendritic cells, J Immunol 16 (1999) 3771-3777.
38) D. Mansuy, J.L. Boucher, Alternative nitric oxide-producing substrates for NO synthases, Free Radic Biol Med 37 (2004) 1105-1121.
39) D.E. Ash, Structure and function of arginases, J Nutr. 134 (2004) (10 Suppl):2760S-2764S; discussion 2765S-2767S
19 40) B. Fazi, A. Felsani, L. Grassi, A. Moles, D. D'Andrea, N. Toschi, D. Sicari, P. De Bonis, C. Anile, M.G. Guerrisi, E. Luca, M.G. Farace, G. Maira, S.A. Ciafré, A. Mangiola, The transcriptome and miRNome profiling of glioblastoma tissues and peritumoral regions highlights molecular pathways shared by tumors and surrounding areas and reveals differences between short-term and long-term survivors, Oncotarget 6 (2015) 22526-22552.
41) R.M. Ransohoff, A polarizing question: do M1 and M2 microglia exist? Nat Neurosci. (2016) 19(8):987-91. doi: 10.1038/nn.4338. PubMed PMID: 27459405.
42) J. Xue, S.V. Schmidt, J. Sander, A. Draffehn, W. Krebs, I. Quester, D. De Nardo, T.D. Gohel, M. Emde, L. Schmidleithner, H. Ganesan, A. Nino-Castro, M.R. Mallmann, L. Labzin, H. Theis, M. Kraut, M. Beyer, E. Latz, T.C. Freeman, T. Ulas, J.L. Schultze, Transcriptome-based network analysis reveals a spectrum model of human macrophage activation. Immunity. 40 (2014) 274-288.
20 Figure legends.
Figure 1. Description of ICH scoring criteria. Fig 1 shows representative image for the different
scores. The figure is dived for antibody: first line of pictures show the staining for ARG-1, the second line for iNOS and the last line for CD163. Magnitude 25x.
Figure 2. IBA-1 staining in human GBM specimens. A) Panel A shows a representative positive
IBA-1 tumor field with score 5. B) Panel B shows a representative positive IBA-1 parenchyma field with score 5.
21
Figure 3. A) CD163, B) iNOS and C) ARG-I staining in human GBM specimens. Panel shows the
number of cases where intensity score in T is equal to the intensity score in P (black column), where patients showed a higher intensity score in T compared to the periphery (blue column) and where patients showed an intensity score lower in the tumor compared to the periphery (red column) for each antibody.
Figure 4. A comparison of staining for CD163, ARG-I and iNOS markers stratified by gender. The
data were expressed as the means ± SEM of 41, 15 and 26 replicates for the male+female, female and male groups, respectively. Comparisons between tumor and periphery, and between female and male subgroups were carried out. Differences were taken as statistically significant if p < 0.05.
22
Figure 5. A comparison of staining for different markers. Figure 5 show differences between T
and P looking at the rate of Δ for each patient higher than 2 over the total for the combined male and females groups. In order to carry out a chi-square test, results were re-arranged by dividing data into just 2 categories: iNOS>M2 marker versus iNOS ≤ M2 marker for CD163 and ARG-I. A-B) p = 0.00235; C-D) p = 0.002.
Figure 6. Correlation between activation markers and survival. Data from TCGA for GBM samples
23 ARG-I, and (C) iNOS. A total of 165 samples (male and female combined) were divided into three equal groups representing low (blue lines, n=55), mid (black lines, n=55), and high (red lines, n=55) expression. Kaplan Meier curves were generated to test for correlation by Log-rank (Mantel-Cox) test. There was a significant (P= 0.0152) relationship between lower CD163 expression and increased survival; and a trend (P= 0.0535) towards reduced survival and high ARG-I expression. There was no relationship between iNOS expression and survival. Average survival times for each group are given in the figures.
24 Table 1. Intensity score for staining of glioma tissue obtained from surgical resection of patients diagnosed with IV grade glioblastoma (GMB) stained for CD163, iNOS and ARG-1.
ARG-1 iNOS CD163 Males (26/41) T P T P T P Intensity score 1 1 1 4 3 4 3 2 3 4 4 3 2 4 3 3 1 4 1 4 2 6 3 0 2 1 3 3 7 5 2 5 3 5 4 8 1 0 2 1 5 2 9 1 1 5 2 4 3 10 1 1 3 2 4 3 11 1 1 2 2 4 2 13 0 1 3 3 4 3 17 0 1 0 0 3 2 19 1 1 3 1 4 2 20 2 1 2 1 1 5 22 4 1 4 1 5 5 24 1 1 2 1 3 1 25 3 1 3 2 2 3 27 3 2 2 2 4 2 29 2 2 2 1 3 3 30 0 5 2 2 2 1 31 1 1 1 2 4 3 32 1 5 2 1 5 2 34 1 1 2 1 3 3 38 4 1 2 0 4 2 39 1 1 1 1 2 1 40 5 3 5 4 5 3 41 2 2 4 4 4 3 ARG-1 iNOS CD163 Females (15/41) T P T P T P Intensity score 4 2 1 2 1 3 2 5 1 0 4 1 4 2 12 3 1 3 2 3 2 14 1 1 2 3 3 2 15 4 3 0 0 1 1 16 3 1 1 0 2 1 18 0 3 1 0 1 2 21 1 3 1 2 4 2 23 1 1 0 1 3 1 26 1 1 1 2 4 4 28 1 3 3 2 3 2 33 2 1 2 2 3 2 35 3 2 3 0 3 1 36 4 1 3 1 5 1 37 4 1 4 2 1 3