1
Unlocking the potential of Artificial Intelligence:
barriers and barriers’ inhibitors regarding the adoption of artificial intelligence-enabled
products by consumers
PhD dissertation
Ilaria Querci
PhD in Management, Banking and Commodity Sciences
XXXIII cycle
Supervisor:
3
Table of contents
Introduction ... 6
Overview of research papers ... 9
Paper 1 ... 9
Paper 2 ... 10
Paper 3 ... 10
References ... 12
Against the IoT: a Multi-method Examination of the Barriers to the Adoption of Smart Objects... 15 Introduction ... 15 Theoretical Background ... 16 Overview of Studies ... 20 Study 1 ... 21 Method... 21 Data Analysis ... 21 Findings ... 22 Study 2 ... 25 Method... 25 Findings ... 32 General Discussion ... 33 Theoretical Implications ... 34 Managerial Implications ... 35
Limitations and Further Research ... 35
References ... 36
Details Matter! Whether, How, and When Information about Algorithms’ Functioning Reduces Data Collection Concerns in the Artificial Intelligence Era ... 40
Introduction ... 40
Conceptual Foundations and Hypotheses ... 42
DCC and Control ... 43
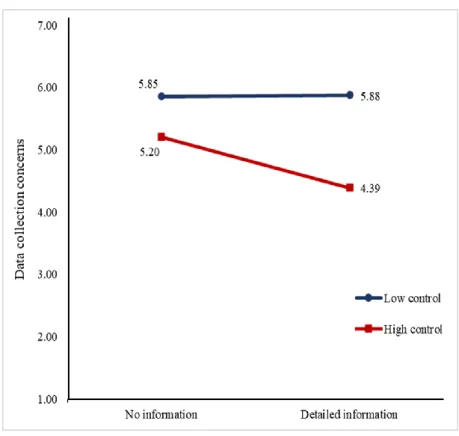
The Combined Effect of Control and Information Detail on DCC ... 44
Detailed Information Facilitates Understanding of the Utility of Providing Personal Data ... 46
Understanding the Utility of Providing Personal Data and DCC ... 47
Utilitarian, Symbolic, and Hedonic Benefits... 48
Overview of Studies ... 50
4
Method... 54
Results ... 55
Study 2: The Effect of Different Types of Information Detail on DCC ... 57
Method... 57
Results ... 58
Study 3: Serial Mediation of Communication Effectiveness and Understanding the Utility of Providing Personal Data... 59
Method... 59
Results ... 60
Study 4: Information Detail and the Moderation of Type of Benefits ... 63
Method... 63
Results ... 64
General Discussion ... 66
Theoretical implications ... 67
Managerial implications ... 68
Limitations and further research ... 70
References ... 72
Appendix ... lxxx “I’m Sorry Dave, I’m Afraid I Can’t Do That”: ... 100
Non-User Fears of Negative Social Roles in the Consumer-Smart Object Relationships ... 100
Introduction ... 100
Theoretical Framework ... 102
Resistance to Innovations ... 102
SOs as Potential Partners ... 104
Consumer-SO Relationship and Fear of Intimacy ... 106
Method ... 108 Time Period ... 108 Participants ... 109 Procedure ... 109 Data Analysis ... 111 Findings ... 111
Fear of Being Controlled ... 116
Fear of Being Dominated ... 119
Fear of Being Subordinated ... 122
Fear of Losing Self Control ... 125
5
Theoretical Contribution ... 129
Managerial Implications ... 130
Limits and Future Research ... 132
Conclusion ... 132
6
Introduction
In the past decade, market forecasts (ABI Research, 2014; Cisco, 2014; Ericsson, 2010) and consulting reports (Gartner, 2018; Manyika et al., 2015) predicted that 2020 would be a breakthrough year for artificial intelligence (AI). Euphoric projections foresaw mainstream adoption of artificial intelligence-enabled products - also known as smart objects (SOs) - (e.g., autonomous vehicles, smart robots, virtual assistants, conversational platforms) and connections of an estimated 50 billion devices to the Internet. But the reality of 2020 has not lived up to these predictions; not only have AI-enabled products not spread to the mainstream (Newman, 2020), but only 20 billion connected devices are actually in use out of the 50 billion that were predicted (Kranz, 2019), suggesting that “the road to mass adoption of the smart home will likely be a long and bumpy one” (Morrissey, 2019).
Why do consumers remain reluctant to buy AI-enabled products? The key factors seemingly relate to both technological features (e.g., use complexity, value offered, risk, object intrusiveness; Hubert et al., 2019; Johnson, Kiser, Washington, and Torres, 2018; Laukkanen, 2016; Lee and Coughlin, 2015; Mani and Chouk, 2017, 2018; Ram and Sheth, 1989) and consumers’ individual characteristics (e.g., data collection concerns, desire to avoid becoming dependent on AI-enabled products, low usage self-efficacy; Hsu and Lin, 2016; Johnson et al., 2018; Lee and Coughlin, 2015; Mani and Chouk, 2017, 2018; Ram and Sheth, 1989). Notably, data collection concerns (DCC), defined as consumers’ concerns about how companies gather and use their personal data (Malhotra, Kim, and Agarwal, 2004; Smith, Milberg, and Burke, 1996) appear strongly influential, such that AI technologies’ ability to collect and process huge amounts of highly personal data prompt consumers to avoid or delay their adoption of AI-enabled products (Berger-de Leon, Reinbacher, and Wee, 2018; Insider Intelligence, 2020). According to a recent survey, 87% of sales delays stem from consumers’ privacy concerns (Cisco, 2019). That is, DCC appears to hinder purchase intentions, being a crucial concern for consumers.
7 Although the relevance that several market and consulting reports ascribe to DCC, no empirical evidence so far has shown the actual role played by this barrier in preventing consumers’ adoption of AI-enabled products. Therefore, Paper 1 identifies what are the barriers specific to the adoption of these devices and shows that DCC is the most important barrier in discriminating consumers between adopters and non-adopters of AI-enabled products. As a consequence, mainstream diffusion of AI-enabled products will require reductions in DCC, or else business efforts to neutralize or mitigate DCC’s adverse effects.
Some studies suggest that granting consumers control over their personal data management (i.e., control) is key to inhibiting DCC (e.g., Malhotra, Kim, and Agarwal, 2004; Xu, Teo, Tan, and Agarwal, 2012), and some companies (e.g., Apple, Facebook) have implemented policies to help consumers see which information is being collected and decide whether to allow such collections or when to remove their information from a company’s database. Beyond this direct effect of control on DCC, it also seems likely to interact with other relevant inhibitors, though these combined effects surprisingly have not been much studied (Aguirre, Mahr, Grewal, Ruyter, and Wetzels, 2015; Martin, Borah, and Palmatier, 2017; Martin and Murphy, 2017). For example, the quality of information that companies provide to explain how their AI-enabled products’ algorithms process personal data to produce a certain outcome, or information detail, is critical in AI contexts (Mastercard, 2020; Puntoni, Reczek, Giesler, and Botti, forthcoming; Rai, 2020), because consumers generally lack sophisticated knowledge about how the algorithms work, which strongly feeds their DCC (Cisco, 2019). Providing consumers with detailed information about the functioning of AI-enabled products’ algorithms should decrease DCC, alone and in interaction with control. Therefore, Paper 2 investigates whether, by which pathways, and in which settings the provision of detailed information combines with control to reduce DCC in an AI-enabled product domain.
All barriers we consider in Paper 1 and Paper 2 stem from either AI-enabled product technical capacities (e.g., connectivity, ubiquity, and smartness) or consumers’ personal traits. Focusing on AI-enabled product capacities, they depend on both SO technical abilities (e.g., being provided with
8 Internet connection, sensors, AI systems) as well as human-like characteristics (e.g., usage of natural language to communicate with the user, having humanized names and genders, and ability to interact with the user in real time). The human-like characteristics enhance the AI-enabled product’s social aspect, making AI-enabled product s’ social presence more salient (McLean & Osei-Frimpong, 2019). This social aspect has affected how consumers interact with AI-enabled products. Indeed, consumer-smart object interactions have acquired meaning that extend beyond the utilitarian benefits stemming from AI-enabled product technical capacities, as AI-enabled product characteristics are enriched by social aspects. The motivation leading consumers to use AI-enabled products now involves this social aspect. People use these devices for social purposes such as conversation (Ammari, Kaye, Tsai, & Bentley, 2019) or having company (Gao, Pan, Wang, & Chen, 2018). These characteristics lead consumers to look at AI-enabled products as potential partners in a relationship that can be referenced to social and interpersonal relationships (Gao et al., 2018; Hoffman & Novak, 2018; Novak & Hoffman, 2019). People can compare AI-enabled products to their romantic companions (Gao et al., 2018) and also attribute to them social roles (e.g., partner, master, or servant - Schweitzer et al., 2019). As the consumer-smart object interaction evolution has implications for consumer behavior (e.g., changes in the occasions of use and type of task performed), it has also implications for consumers’ resistance to the adoption of AI-enabled products. However, consumer resistance frameworks have not included the relational perspective as a barrier that can explain this phenomenon so far. In order to fully understand why a consumer rejects an AI-enabled product, it is necessary to account for reasons that may stem from consumers’ perception of as AI-enabled product as potential partner in a relationship. Therefore, Paper 3 identifies the relational barriers as a new category of barriers to consumers’ adoption of AI-enabled products.
In conclusion, this PhD dissertation is focused on the barriers to adoption of AI-enabled products and on the identification of factors that can inhibit the effect of such barriers on the adoption from a consumer behavior perspective. More specifically, the goal of this dissertation is threefold. First, to advance knowledge about the barriers to consumers’ adoption of AI-enabled products and
9 factors that can inhibit these barriers. Second, to provide useful suggestions and solutions that could be implemented by managers to reduce the main barrier to consumers’ adoption (i.e., DCC). Third, to provide evidence about the existence of a new category of barriers: the relational barrier. In conclusion, despite limitations, this PhD dissertation aims at encouraging future research building on consumer resistance to AI-enabled products.
Overview of research papers
Paper 1
The first paper included in this dissertation, titled “Against the IoT: a multi-method examination of the barriers to the adoption of smart objects”, explores the barriers to consumers’ adoption of SOs and provide a detailed classification of the barriers discriminating between adopters and non-adopters.
Despite the Internet of Things (IoT) is expected to open up new business opportunities, consumers' adoption of smart objects is still limited. Extant literature has widely analyzed the barriers to consumers’ adoption of innovation in general and IoT services. Conversely, it
investigated the barriers to SO adoption limitedly. Therefore, the aim of this study is to investigate the specific barriers to consumers’ adoption of SOs, and to identify the most relevant barriers across different consumer segments. This paper is based on a multi-method approach. In Study 1 (N = 132) we run a qualitative survey based on the critical incident technique while in Study 2 (N = 669) we present the results of cluster analysis based on an online survey. Our results reveal that despite price and value are perceived as relevant obstacles to adoption, privacy concern (collection) is the most important barrier in profiling consumers across clusters.
10
Paper 2
The second paper included in this dissertation, titled “Details Matter! Whether, How, and When Information about Algorithms’ Functioning Reduces Data Collection Concerns in the
Artificial Intelligence Era”, explores the effect of some inhibitors on the DCC barrier to consumers’ adoption of AI-enabled products and provide an explanation about the mechanism underlying the relationship between such inhibitors and DCC, as well as information about boundary conditions under which the effect lasts/vanishes.
Consumers’ DCC, regarding how companies gather and use their personal data, can impede adoption of AI–enabled products. Prior research investigates consumers’ control; this study builds on those findings by considering the effects of control in combination with the level of information detail that companies provide to explain how these products process personal data, as another potential inhibitor of data collection concerns. Therefore, the current research investigates whether, how, and when a high level of control might magnify the effect of detailed information in reducing consumers’ data collection concerns. Tests of the conceptual model with four independent online experiments (combined N = 1183) confirm (1) a negative effect of information detail on consumers’ data collection concerns and a significant moderating influence of control (Studies 1 and 2); (2) serial mediation by perceived communication effectiveness and subsequent understanding of the utility of providing personal data, which explains the relationship between information detail and consumers’ data collection concerns (Study 3); and (3) relevant boundary conditions, pertaining to the type of benefits consumers gain (Study 4). These findings add to existing theoretical knowledge, provide actionable managerial implications, and identify avenues for further research.
Paper 3
The third paper included in this dissertation, titled ““I’m Sorry Dave, I’m Afraid I Can’t Do That”: Non-User Fears of Negative Social Roles in the Consumer-Smart Object Relationships”, explores the barriers to consumers’ adoption of SOs adopting a relational perspective and provide a
11 detailed classification of four fears experienced by consumers that can prevent them to adopt these devices.
SOs have entered into consumers’ everyday life. However, despite the great potential of smart objects, their diffusion is struggling. Models on the resistance of innovation, also applied to smart devices, have tried to explain this phenomenon. However, these models rely only on
innovation or user characteristics. Smart objects capabilities, such as using natural language and interacting with the user in real-time, contribute to the capacity for these devices to elicit a social presence, become anthropomorphized by consumers and perceived as a relational partner. Since, in the interpersonal domain, people can be reluctant to engage in new intimate relationships, this paper claims that the relational potentialities of smart objects can inhibit the purchase and use. So, these aspects should be taken into account when talking about resistance. From ZMET interviews on non-users, four fears emerged, each one connected to a different smart object social role: Fear of Being Controlled (Stalker), Fear of Being Dominated (Captor), Fear of Being Subordinated (Master), Fear of Losing Self Control (Seducer). This work contributes both to the resistance literature, shedding light on a new barrier (i.e., the relational barrier), and to the smart object-consumer relationship literature, discovering new (anticipated) social roles, all negative.
12
References
ABI Research. (2014). The Internet of Things Will Drive Wireless Connected Devices to 40.9 Billion in 2020. Retrieved from https://www.abiresearch.com/press/the-internet-of-things-will-drive-wireless-connect/
Aguirre, E., Mahr, D., Grewal, D., De Ruyter, K., & Wetzels, M. (2015). Unraveling the
Personalization Paradox: The Effect of Information Collection and Trust-Building Strategies on Online Advertisement Effectiveness. Journal of Retailing, 91(1), 34–49.
https://doi.org/10.1016/j.jretai.2014.09.005
Ammari, T., Kaye, J., Tsai, J. Y., & Bentley, F. (2019). Music, Search, and IoT: How People (Really) Use Voice Assistants. ACM Transactions on Computer-Human Interaction (TOCHI),
26(3), 1–28. https://doi.org/https://doi.org/10.1145/3311956
Berger-de Leon, M., Reinbacher, T., & Wee, D. (2018). The IoT as a growth driver. In The Internet
of Things: How to capture the value of IoT (pp. 78–83). McKinsey IoT. Retrieved from
https://www.mckinsey.com/~/media/McKinsey/Business Functions/McKinsey Digital/Our Insights/The Internet of Things How to capture the value of IoT/How-to-capture-the-value-of-IoT.ashx
Cisco. (2014). The internet of things. Cisco. https://doi.org/10.5480/1536-5026-34.1.63 Ericsson. (2010). Ceo to shareholders: 50 billion connections 2020. Retrieved from
https://www.ericsson.com/en/press-releases/2010/4/ceo-to-shareholders-50-billion-connections-2020
Gao, Y., Pan, Z., Wang, H., & Chen, G. (2018). Alexa, My Love: Analyzing reviews of amazon echo. Proceedings - 2018 IEEE SmartWorld, Ubiquitous Intelligence and Computing,
Advanced and Trusted Computing, Scalable Computing and Communications, Cloud and Big Data Computing, Internet of People and Smart City Innovations,
SmartWorld/UIC/ATC/ScalCom/CBDCo, (May), 372–380.
https://doi.org/10.1109/SmartWorld.2018.00094
Gartner. (2018). Gartner Identifies Five Emerging Technology Trends That Will Blur the Lines Between Human and Machine. Retrieved from https://www.gartner.com/en/newsroom/press- releases/2018-08-20-gartner-identifies-five-emerging-technology-trends-that-will-blur-the-lines-between-human-and-machine
Hoffman, D. L., & Novak, T. P. (2018). Consumer and object experience in the internet of things: An assemblage theory approach. Journal of Consumer Research, 44(6), 1178–1204.
https://doi.org/10.1093/jcr/ucx105
Hsu, C. L., & Lin, J. C. C. (2016). An empirical examination of consumer adoption of Internet of Things services: Network externalities and concern for information privacy perspectives.
13 Hubert, M., Blut, M., Brock, C., Zhang, R. W., Koch, V., & Riedl, R. (2019). The influence of
acceptance and adoption drivers on smart home usage. European Journal of Marketing, 53(6), 1073–1098. https://doi.org/10.1108/EJM-12-2016-0794
Insider Intelligence. (2020). The security and privacy issues that come with the Internet of Things. Retrieved from https://www.businessinsider.com/iot-security-privacy?IR=T
Johnson, V. L., Kiser, A., Washington, R., & Torres, R. (2018). Limitations to the rapid adoption of M-payment services: Understanding the impact of privacy risk on M-Payment services.
Computers in Human Behavior, 79, 111–122. https://doi.org/10.1016/j.chb.2017.10.035
Kranz, M. (2019). The IoT : Yesterday ’ s Predictions Vs . Today ’ s Reality. Retrieved from https://www.forbes.com/sites/forbestechcouncil/2019/05/02/the-iot-yesterdays-predictions-vs-todays-reality/#2fc0d2f5512b
Laukkanen, T. (2016). Consumer adoption versus rejection decisions in seemingly similar service innovations : The case of the Internet and mobile banking. Journal of Business Research,
69(7), 2432–2439. https://doi.org/10.1016/j.jbusres.2016.01.013
Lee, C., & Coughlin, J. F. (2015). PERSPECTIVE: Older Adults’ Adoption of Technology: An Integrated Approach to Identifying Determinants and Barriers. Journal of Product Innovation
Management, 32(5), 747–759. https://doi.org/10.1111/jpim.12176
Malhotra, N. K., Kim, S. S., & Agarwal, J. (2004). Internet users’ information privacy concerns (IUIPC): The construct, the scale, and a causal model. Information Systems Research, 15(4), 336–355. https://doi.org/10.1287/isre.1040.0032
Mani, Z., & Chouk, I. (2017). Drivers of consumers’ resistance to smart products. Journal of
Marketing Management, 33(1–2), 76–97. https://doi.org/10.1080/0267257X.2016.1245212
Mani, Z., & Chouk, I. (2018). Consumer Resistance to Innovation in Services: Challenges and Barriers in the Internet of Things Era. Journal of Product Innovation Management, 35(5), 780– 807. https://doi.org/10.1111/jpim.12463
Manyika, J., Chui, M., Bisson, P., Woetzel, J., Dobbs, R., Bughin, J., & Aharon, D. (2015). The
Internet of Things: Mapping the value beyond the hype. McKinsey Global Institute.
https://doi.org/10.1007/978-3-319-05029-4_7
Martin, K. D., Borah, A., & Palmatier, R. W. (2017). Data Privacy: Effects on Customer and Firm Performance. Journal of Marketing, 81(1), 36–58. https://doi.org/10.1509/jm.15.0497
Martin, K. D., & Murphy, P. E. (2017). The role of data privacy in marketing. Journal of the
Academy of Marketing Science, 45(2), 135–155. https://doi.org/10.1007/s11747-016-0495-4
Mastercard. (2020). Doing AI Right: No Trust? No Business. Retrieved from
https://mastercardcontentexchange.com/research-reports/2020/doing-ai-right-no-trust-no-business/
McLean, G., & Osei-Frimpong, K. (2019). Hey Alexa … examine the variables influencing the use of artificial intelligent in-home voice assistants. Computers in Human Behavior, 99, 28–37.
14 https://doi.org/10.1016/j.chb.2019.05.009
Morrissey, J. (2019). The Race to Create the Coolest Smart Home Devices Is Hotter Than Ever. The
New York Times.
Newman, P. (2020). THE INTERNET OF THINGS 2020: Here’s what over 400 IoT decision-makers say about the future of enterprise connectivity and how IoT companies can use it to grow revenue. Retrieved from
https://www.businessinsider.com/internet-of-things-report?IR=T
Novak, T., & Hoffman, D. L. (2019). Relationship Journeys in the Internet of Things: A New Framework for Understanding Interactions Between Consumers and Smart Objects. Journal of
the Academy of Marketing Science, 47(2), 216–237. https://doi.org/10.2139/ssrn.3059093
Puntoni, S., Reczek, R. W., Giesler, M., & Botti, S. (n.d.). Consumers and Artificial Intelligence: An Experiential Perspective. Journal of Marketing.
Rai, A. (2020). Explainable AI: from black box to glass box. Journal of the Academy of Marketing
Science, 48(1), 137–141. https://doi.org/10.1007/s11747-019-00710-5
Ram, S., & Sheth, J. N. (1989). Consumer resistance to innovation: The marketing problem and its solutions. Journal of Consumer Marketing, 6(2), 5–14.
https://doi.org/10.1108/EUM0000000002542
Schweitzer, F., Belk, R., Jordan, W., Ortner, M., Schweitzer, F., Belk, R., … Ortner, M. (2019). Servant , friend or master ? The relationships users build with voice-controlled smart devices.
Journal of Marketing Management, 00(00), 1–23.
https://doi.org/10.1080/0267257X.2019.1596970
Smith, H. J., Milberg, S. J., & Burke, S. J. (1996). Information Privacy: Measuring Individuals’ Concerns about Organizational Practices. MIS Quarterly, 20(2), 167–196.
https://doi.org/10.2307/249477
Xu, H., Teo, H. H., Tan, B. C. Y., & Agarwal, R. (2012). Effects of individual self-protection, industry self-regulation, and government regulation on privacy concerns: A study of location-based services. Information Systems Research, 23(4), 1342–1363.
15
Against the IoT: a multi-method examination of the barriers to the adoption of
smart objects
Introduction
Smart objects (SOs) are physical objects connected to the Internet that can interact with other objects and people, and that can collect, store, and process a huge amount of data. These actions are made by SOs with agency, autonomy, and authority (Hoffman & Novak, 2018). These characteristics entail changes in the way consumers use and interact with this kind of innovation delineating a different context compared to that of innovation in general. The Internet of Things (IoT) is expected to unlock significant market opportunities. The combined markets of the IoT is forecasted to grow to about $520B in 2021 (more than double the $235B spent in 2017 – Columbus, 2018), and the number of devices connected to the Internet has exceeded 31B in 2018 (Morelli et al., 2018).
Despite these favorable predictions, the diffusion of smart objects in the market is still in its infancy. For instance, consumers’ intentions to purchase smart objects increased only by 1% in the 2015-2016 period (Björnsjö, Lovati, and Viglino, 2016).
Scholars and practitioners have increasingly ascribed this inconsistency to the occurrence of relevant adoption barriers, that is, actual (functional and psychological) obstacles that may hinder consumers’ desire to adopt innovations (Berger-de Leon, Reinbacher, and Wee, 2018; Mani & Chouk, 2017, 2018). However, while extant empirical research has focused on the barriers of adopting innovation in general (Laukkanen, 2016; Laukkanen, Sinkkonen, Kivijärvi, & Laukkanen, 2007; Ram & Sheth, 1989), the investigation of the specific barriers to the adoption of smart objects has been pursued to a more limited extent (Mani & Chouk, 2017, 2018).
The present study addresses this research gap. Specifically, it aims to investigate the barriers to consumers’ adoption of smart objects, and to identify the most relevant barriers across different consumer segments. In this regard, Study 1 shows the results of a qualitative study that combines the barriers identified by previous literature with those ones specific to the adoption of SOs. Second,
16 Study 2 shows the results of a quantitative study that highlights the most relevant barriers to the adoption of SOs for different consumer segments.
Theoretical background
Recent decades have witnessed a growing body of research on the factors that foster and hinder consumers’ adoption of innovative products in general (Y. Park & Chen, 2007; Ram & Sheth, 1989) as well as of smart objects (SOs) (Hubert et al., 2019; Mani & Chouk, 2017; Shin, Park, & Lee, 2018). However, despite these studies, research that aims at identifying the elements able to suppress the barriers to consumers’ adoption of SOs is still in its infancy (André et al., 2018).
The marketing literature about how consumers respond to innovations refers to two research paradigms (Laukkanen, 2016): the innovation adoption paradigm and the resistance to innovation paradigm. The former is based on theoretical models that aim at understanding how consumers’ perception of the features of an innovation (e.g., perceived usefulness and perceived ease of use; Davis, 1989) affects whether they decide to adopt it. The main models that have allowed researchers to do so are the technology acceptance model (TAM: Davis, 1989), and the unified theory of acceptance and use of technology (UTAUT: Venkatesh, Morris, Davis, & Davis, 2003). These two models have been subsequently extended to better explain consumer behavioral intention to adopt innovations. The update results in three new models, such as TAM2 (Venkatesh & Davis, 2000), TAM3 (Venkatesh & Bala, 2008), and UTAUT2 (Venkatesh, Thong, & Xu, 2012).
The latter paradigm is based on theoretical models intended to understand what are the factors that impede consumers’ adoption of innovations. This stream of literature has its foundations in the assumption that consumers resist innovations because of the occurrence of “several barriers that paralyze their desire to adopt innovations” (Ram & Sheth, 1989, p. 7). Ram and Sheth (1989) distinguished functional barriers from psychological barriers. Functional barriers (i.e., usage, value, and risk) occur when the consumer perceives that the adoption of the innovation entails significant
17 changes (Ram & Sheth, 1989). Psychological barriers (i.e., image and tradition) occur when the adoption of the innovation and consumers’ prior beliefs are in conflict (Ram & Sheth, 1989).
Marketing scholars have recently started to use the two paradigms to explain consumers’ behavioral intentions toward SOs. Specifically, the application of the above-mentioned theoretical models to the SO realm resulted in the identification of several specific factors either for or against the adoption. The fact that SOs present some peculiar features, that make them a unique type of innovation (Hoffman & Novak, 2018; Novak & Hoffman, 2019), has called for some extensions of the innovation adoption models (Davis, 1989; Venkatesh et al., 2012). Indeed, building on the original versions, several studies recently developed new adoption models that include typical SO variables (Chuah et al., 2016; Kim & Shin, 2015; Shin et al., 2018; Talukder, Sorwar, Bao, Ahmed, & Palash, 2020), such as compatibility (i.e., the ability of a device to be connected and communicate with other devices inside the smart home; Shin et al., 2018), and subcultural appeal (Kim & Shin, 2015). Research on consumers’ adoption of smart products has also been conducted using a combination of different theoretical models of adoption. For instance, a framework composed by both the UTAUT2 and diffusion of innovation (DOI) (Talukder, Chiong, Bao, & Hayat Malik, 2019) allowed researchers to provide a better explanation of the adoption phenomenon, since it is seen as a blend of consumers’ perception of SO characteristics and consumer innovative traits.
Concerning the literature on resistance to innovations, Mani and Chouk (2017) answered to the need of updated models by the identification of two groups of barriers determining the consumer resistance to smartwatches. The first group is composed by barriers referring to the characteristics of the SO (i.e., smartwatch); therefore, it presents barriers such as perceived usefulness, perceived novelty, perceived price, and intrusiveness. The second group is composed by barriers relating to the characteristics of the consumer; therefore, it presents barriers such as privacy concerns, dependence and self-efficacy.
Although in marketing literature both paradigms have been used separately to analyze consumer behavior toward SOs, recently researchers have started to claim and proved that the analysis
18 of consumers’ adoption of complex and multifaced innovations like IoT products calls for a combination of different theoretical frameworks, so that it is possible to capture positive and negative aspects at the same time (Hubert et al., 2019). Venkatesh et al. (2003, p. 426) already shed light on this issue arguing that: “researchers are confronted with a choice among a multitude of models and find that they must ‘pick and choose’ constructs across the models, or choose a ‘favored model’ and largely ignore the contributions from alternative models. Thus, there is a need for a review and synthesis to progress toward a unified view of user acceptance.” In this vein, recent studies explained consumers’ adoption of SO drawing from different frameworks and concepts in the literature, mainly referring to both adoption and perceived risk theory (Hubert et al., 2019; Wang, McGill, & Klobas, 2018). These studies show a new pathway to consumers’ adoption of smart products.
This scenario depicts a fragmented literature on the barriers to consumers’ adoption of SOs. The implementation of both adoption and resistance model in the SO realm resulted in a miscellaneous of factors that promote and hinder consumers’ adoption, such as usability factors (Mani & Chouk, 2017; Shin et al., 2018), risk factors (Hubert et al., 2019), technical factors (e.g., intrusiveness and compatibility; Mani & Chouk, 2017; Shin et al., 2018), and consumers’ personality traits (i.e., optimism, innovativeness, discomfort and insecurity; (Mulcahy, Letheren, McAndrew, Glavas, & Russell-Bennett, 2019). In this mosaic of barriers, Mani and Chouk (2018), building on Ram and Sheth’s (1989) model, tested the presence of new barriers specific to the IoT service domain. They presented three main categories of barriers to the adoption of IoT services: functional, psychological and individual barriers. The first category, as in Ram and Sheth’s (1989) model, covers usage, value and risk barriers. The second category is enriched with two new barriers: the technology vulnerability barrier (i.e., perceived technological dependence and technology anxiety), and the ideological barrier (i.e., skepticism). The third and new category is the ideological barrier (i.e., inertia). However, this model neglects some relevant factors that might play a role in consumer resistance to smart product. These factors refer to both the SO and the individual; speaking in terms of barriers,
19 they refer, respectively, to functional barriers (i.e., perceived novelty and intrusiveness) and to psychological barrier (i.e., privacy concerns and self-efficacy) (Mani & Chouk, 2017).
One of the main features of SOs, i.e. one of those reflecting their “smartness”, is the ability to collect, store and share information that is present in the surrounding environment (Hernández & Reiff-Marganiec, 2014; López, Ranasinghe, Patkai, & McFarlane, 2011), and so users’ personal data. SOs constantly collect consumers’ private and sensitive information and the more users integrate SOs in their lives, the more information about them the SOs collect (K. Park, Kwak, Lee, & Ahn, 2018). Moreover, the exchange of information takes place not only from consumer to consumer but also from consumers to SOs and among SOs (Yun, Lee, & Kim, 2019). Borrowing a concept from Hoffman and Novak (2018), we can say that consumers’ personal data are collected by SOs and shared with and within the assemblage. Consumers’ concerns about the data collection made by the SO can lead the consumers themselves to restrict the way they use the SO (Novak & Hoffman, 2019). This type of concerns are not attached to SOs in an exclusive way. Indeed, privacy literature has already ascribed data collection to the primary dimensions of individuals’ concerns about organizational practices, and defined it as the individuals’ perception that and resentment about the “great quantities of data regarding their personalities, background and actions are being accumulated” (H. J. Smith, Milberg, & Burke, 1996, p. 171). Malhotra, Kim, and Agarwal (2004) adapted this seminal definition to the Internet and e-commerce context defining it “as the degree to which a person is concerned about the amount of individual-specific data possessed by others relative to the value of benefits received” (Malhotra et al., 2004, p. 338). In the marketing literature, several studies shed light on consumers’ concerns about how IoT technologies collect, store and share their personal data, as well as the quantity of data these devices can collect (Balta-Ozkan, Davidson, Bicket, & Whitmarsh, 2013; Hmielowski, Boyd, Harvey, & Joo, 2019; Novak & Hoffman, 2019; Wang et al., 2018; Worthy, Matthews, & Viller, 2016), such as information on geographical location, financial, personal health and habits. In our research the term data collection concerns (DCCs) is used to refere to the degree to which a person is concerned about the quantity of his/her personal data SOs can collect and use. Some
20 empirical studies showed that consumers’ DCCs entail negative consequences. Fore instance, consumers perceive the data collection and use that smart home devices make of their personal information as a risk (Wang et al., 2018). Moreover, their concerns affect negatively the satisfaction with digital assistants (Brill, Munoz, & Miller, 2019), while it has a positive impact on the intrusiveness of smartwatches, which in turn has a positive impact on the resistance to this kind of SOs (Mani & Chouk, 2017).
Althought these facts make consumers’ concerns about the collection of their personal data an issue even more salient compared to how much it was before the beginning of the IoT era (Belanger & Xu, 2015), there are no empirical evidence, to the best of our knowledge, confirming that consumers’ data collection concerns can be a barrier to consumers’ adoption of SOs.
Thus, given the peculiarities of SOs, the complex and various portfolio of barriers referring to them, and some evidences about the possible presence of new barriers specific to SOs (e.g., privacy concerns barriers), a clear representation of what are the consumers’ barriers to the adoption of SOs and of the characteristics – in terms of barriers and individual traits - distinguishing adopters from non-adopters of SOs is needed in order to identify what are the main barriers on which an intervention can make the difference. Therefore, our research questions are:
• What are the barriers to consumers’ adoption of SOs?
• What is the most important barrier preventing consumers in adopting SOs, so
discriminating between adopters and non-adopters?
Overview of studies
We answered to these research questions with two online studies. Study 1 is a qualitative study. We conduct an online survey to investigate what are the barriers to consumers’ adoption of SOs. The aim of this study is to understand whether consumers experience specific new barriers in addition to the ones already identified in the literature of resistance to innovation and resistance to SOs. Study 2
21 is a quantitative study. We conduct an online survey to identify what is the main barrier to the adoption of SOs.
Study 1
Method
Participants. We recruited 157 respondents. Some participants were disqualified because of
lack of any barrier or incompleteness of the answer. Hence, responses from 132 respondents (36% female; 54% aged 18 – 30, 27% aged 31 – 45, 14% aged 46 – 60 and 5% aged over 60; 2% lower than High School education level, 31% High School education level, 42% Bachelor Degree education level, 21% Master Degree education level and 4% PhD education level; 30% student, 44% employee, 14% self-employee, 4% unemployed, 5% retired and 3% other) were analyzed.
Procedure. The qualitative online survey was conducted using an adaptation of the critical
incident technique (CIT) (e.g., Bitner, Booms, and Tetreault, 1990). Respondents were asked to recall a recent opportunity in which they could purchase a SO, but they decided on not buying it. They were asked to describe the incident and the motivations for the SO non-adoption.
Data analysis
Participants’ narratives were coded in two phases, using the open-coding technique of the grounded theory (Corbin & Strauss, 1990). Firstly, we analyzed the responses of each informant at a level of analysis as close as possible to the way they were voiced by everyone. Then, we ran a second round of coding in which, bearing in mind the categories that emerged from the individual-level analysis, we conducted a cross-analysis among all the informants. This second phase aimed at identifying broader categories, resulting from the collapse and the merger of the previous ones, and overarching themes. In some cases, individuals reported more than one motivation as to why smart
22 objects were not adopted. These responses were classified into multiple categories yielding 204 occurrences. The analysis resulted in the identification of nine main macro themes. Each theme corresponded to a specific barrier to the adoption of SOs.
Findings
From the coding, nine categories emerged. Each category represents a barrier to consumers’ adoption of SOs. While some barriers we identified were already present in the marketing literature about consumers’ reactions to innovations and SOs (i.e., perceived value, perceived piece, novelty, negative externalities, self-efficacy, and dependence and tradition) (Johnson, Kiser, Washington, & Torres, 2018; Laukkanen, 2016; Laukkanen et al., 2007; Mani & Chouk, 2017, 2018; Ram & Sheth, 1989; Shin et al., 2018), our analysis shed light on some new barriers, specific to the SO context (i.e., risky purchase, knowledge, and privacy concerns). Barriers’ definitions, absolute frequencies, and participants’ quotes are reported in Table 1.
Perceived value (n=74). When consumers experience the perceived value barrier, they do not
catch the value generated by the device. Often the SO is considered useless because the consumer already owns a similar device, and this leads the consumer to postpone the purchase. The low perceived value is also represented by the low perceived quality of the attributes of the product, the perplexities regarding the quality-price ratio, and the fact that the consumer knows that she will rarely use the SO.
Perceived price (n=54). When consumers experience the perceived price barrier, they
perceive the price of the SO as inadequate, too high, and not consistent with the quality and utility of the device. Also, the price evaluation is made in connection with a low perceived value of the SO. The doubts on the relationship between utility and price increase the importance of the limited budget that consumers can allocate to the SO purchase. This leads the individuals not to buy the product in order to optimize the allocation of resources.
23
Novelty (n=20). When consumers experience the novelty barrier, they perceive a reduced
originality of SOs in absolute terms and/or in relation to previous versions or similar products. Non-differentiated functions of SOs lead to postpone the purchase because consumers prefer to wait for a model or product that represents an innovative leap. On this basis, we can say that the novelty barrier seems to be an antecedent of the perceived value barrier.
Negative externalities (n=15). Negative externalities are negative effects external to the
consumer-SO relationship due to the adoption of the device. These negative effects stem from the incompatibility of the SO with respondent’s lifestyle or with other devices that the respondent already owns. In this case, the consumer thinks to use the SO rarely. On this basis, we can say that he negative externalities barrier seems to be an antecedent of the perceived value barrier.
Risky purchase (n=14). When consumers experience the risky purchase barrier, they fear to
make a wrong purchase regarding the functionalities of the product, the price (due to the limited budget), and the unfavorable contractual conditions.
Knowledge (n=8). When consumers experience the knowledge barrier, they have low
knowledge of the SO and its characteristics at the time of purchase. The low level of knowledge is due to a lack of time that they would have dedicated to the preliminary research of information. In this case, the consumer tends to delegate the purchase decision to others who have a higher knowledge of the product.
Privacy concerns (n=7). When consumers experience the privacy concerns barrier, they feel
concerned about the data that SOs collect and analyze. Specifically, they fear the possibility of being victim of attacks by hackers and companies’ secondary use of personal data. This barrier also refers to consumers’ concerns about the intrusiveness of SOs (i.e., their ability to enter autonomously into the users’ lives).
Self-efficacy (n=7). When consumers experience the self-efficacy barrier, they have low
perception of their ability to use the SO due to the awareness of being to some extent adverse to technology, or the belief that SOs are too difficult to use.
24
Miscellaneous (n=5). This is a residual category. It is composed of reasons of non-adoption
related to the individuals’ conservative personality (i.e., a personality that is adverse to innovation and against the continuous control to which technology exposes those who use it or the fear of becoming dependent on the SO). The concepts that make up this category are related to the privacy concerns barrier, in particular to the intrusive aspects of the SO, and the self-efficacy barrier.
As evidenced from the results, perceived value and perceived price are the barriers that emerged more frequently in participants’ narratives. This outcome is not surprising given that Study 1 is based on the memory recall of the incident. However, other relevant reasons were reported by respondents concerning the non-adoption (e.g., risky purchase and privacy concerns). Therefore, to detect and delve into the role of specific barriers for consumer segments characterized by different levels of adoption, a quantitative study is conducted with a new group of participants. To this end, a set of measurement scales were used to identify the barriers to SO adoption.
Table 1. Qualitative excerpts organized by category.
Barrier Definition Quote Absolute
frequency Perceived
value
Consumers perceive the smart object as useless and of low value
Int. #2: “Was debating on whether I should swap my current iPhone 6 to get the new iPhone. I didn't purchase it in the end because my current phone is working fine.”
74
Perceived price
Consumers perceive the price as too high and inconsistent with the functionalities of the smart object
Int. #132: “Smartwatch. I did not buy it mainly because I
found it too expensive.” 54
Novelty
Consumers perceive smart objects as lacking originality and innovativeness
Int. #21: “Smartwatch. Not for the price (that I think it is too high) but for the features that don't represent a breakthrough.”
20
Negative externalities
Consumers perceive a mismatch between the devices they already own and the smart objects
Int. #118: “About one month ago I was going to buy a "Samsung smart fitness watch" from Amazon, but I didn't, because it was not compatible with my Samsung tablet.”
15
Risky purchase
Consumers perceive the risk of a bad purchasing decision (in terms of product, spending and contractual condition terms)
Int. #58: “Alexa…but I didn't know if I could have used
it in Italy” 14
Knowledge
Consumers have not enough information about smart object features at the moment of purchase
Int. #71: “We were looking for a new TV. We had a look at a Smart TV which looked good, but we didn't know much about it. We decided to collect more information about it.”
25
Privacy concerns
Consumers are concerned about how smart objects may process their personal information (i.e., collection, storage and diffusion of data, intrusiveness)
Int. #122: “I have been thinking about purchasing a larger TV such as 80". However, almost all the large TVs are Smart TVs. The problem is that I want a TV to be a TV, not a device that can listen to voice commands 24/7 and one that tracks everything you do. I believe the security on TVs is not good and it is not updated. The wifi and camera (if it includes it) can easily be turned on without your knowledge.”
7
Self-efficacy
Consumers’ self-perception of their ability in using smart objects is low because of their cognitive technology aversion or object complexity
Int. #80: “I had the chance to have a smart device that allowed me to control heating from any room in the house or outside. I felt that this could be too complicated, and things could just go wrong.”
7
Miscellaneous
- Consumers are concerned about becoming dependent on the smart objects - Consumers’ conservative
personality hinders the adoption of smart objects
Int. #57: “Fitbit. I didn't buy it because I thought that it could have influenced significantly my behaviors” Int. #91: “We were going to purchase a Smart TV. However, after talking to the shopping assistant, my husband realized he didn't like the Internet via a TV as he is old fashioned, and he doesn't trust the Internet at all.”
5
Study 2
Method
Participants. We recruited 669 respondents (48.9% men; 41.3% 18–30 years, 17.9% 31–45
years, 30.2% 46–60 years, and 10.6% older than 60 years) from Prolific participated in exchange for monetary compensation.
Procedure and data analysis. The questionnaire was composed of three sections. The first
section introduced the definition of smart objects and provided some examples. In the second section, respondents were asked to recall a recent opportunity in which they could purchase a smart device, but they decided on not buying it (see Study 1 for the procedure). The third section recorded the model variables, socio-demographic data, and thanked the participants. The respondents took about 12 minutes to complete the questionnaire. Measurement scales validated by previous literature were used to measure all the constructs. Some of the scales were adapted to a smart object context. The questionnaire included latent constructs measured on seven-point Likert scales (1 = “strongly disagree”
26 to 7 = “strongly agree”), except for perceived value and price fairness that were measured with bipolar scales (Table 2).
We conducted a two-step cluster analysis to categorize sample respondents on the basis of their responses to the clustering variables (Punj and Stewart, 1983). The initial, hierarchical cluster analysis suggested a three-cluster solution. Then we used a non-hierarchical, k-means clustering procedure (MacQuenn, 1967) to develop the three-cluster solution. It grouped respondents according to their perceptions of the main barriers to adoption (i.e., data collection concerns (DCC), intrusiveness, perceived value, self-efficacy, ease of use, perceived usefulness, knowledge, dependence, risk, familiarity, price fairness, improper access concerns, novelty, and unauthorized secondary use concerns). Individual traits (i.e., optimism, innovativeness, discomfort, and insecurity), the number and type of AI-enabled products they owned, and perceived network externalities associated with the presence of AI-enabled products were not included in the clustering procedure but were used for descriptive purposes. Analyses of variance and Bonferroni pairwise comparison tests were conducted to compare the three clusters (Table 3; Figure 1). After respondents were grouped in clusters, we labeled them according to their purchase and positive word-of-mouth (WOM) intentions.
Table 2. Cluster Analysis Measures and Descriptive Statistics
Construct Operationalization Measurement (Source) Cronbach's
alpha α Data collection
concerns (DCC)
1. I am concerned about threats to my personal privacy coming from AI-enabled products. 2. I am concerned about data collected by AI-enabled products without my permission. 3. I am concerned that Smart Device producers are
collecting too much personal information about me.
4. It bothers me to give personal information to so many Smart Device producers.
Four 7-point items anchored by “strongly disagree” [1] and “strongly agree” [7], adapted from Hsu and Lin (2016); Mani and Chouk (2017).
α = 0.94
Intrusiveness 1. Smart Devices are intrusive. 2. Smart Devices are irritating. 3. Smart Devices are indiscreet.
4. I am not comfortable with Smart Devices. 5. Smart Devices are disturbing.
Five 7-point items anchored by “strongly disagree” [1] and “strongly agree” [7], adapted from Mani and Chouk (2017).
α = 0.90
Perceived value The value of Smart Devices is: Five 7-point items, anchored by “not necessary” [1] and “necessary” [7],
27
“boring” [1] and “exciting” [7], “not a worthwhile product” [1] and “a worthwhile product” [7], “unappiling” [1] and “appiling” [7],
“common” [1] and “unique” [7]*, adapted from Kleijnen, Ruyter, and Wetzels (2007) and Voss, Spangenberg, and Grohmann (2003).
Self-efficacy 1. I know how to use Smart Devices.
2. I am confident in my ability to understand and use Smart Devices.
3. I think I am able to operate Smart Devices although I've never used it before.*
Three 7-point items anchored by “strongly disagree” [1] and “strongly agree” [7], adapted from Mani and Chouk (2017).
α = 0.91
Ease of use 1. In my opinion, Smart Devices are easy to use. 2. In my opinion, Smart Devices are fast to use. 3. In my opinion, progress in Smart Devices is
clear.
4. My interaction with Smart Devices is understandable.
5. Interacting with Smart Devices does not require a lot of my mental effort.
Five 7-point items anchored by “strongly disagree” [1] and “strongly agree” [7], adapted from Laukkanen, Sinkkonen, Kivijärvi, and Laukkanen (2007); Lu, Yao, and Yu (2005).
α = 0.90
Perceived usefulness
The value of Smart Devices is: Seven 7-point items, anchored by “ineffective” [1] and “effective” [7],
“not functional” [1] and “functional” [7],
“impractical” [1] and “practical” [7],
“useless” [1] and “useful” [7], “inefficient” [1] and “efficient”[7], “unproductive” [1] and
“productive” [7],
“not helpful” [1] and “helpful” [7], adapted from Kleijnen, Ruyter, and Wetzels (2007) and Voss, Spangenberg, and Grohmann (2003).
α = 0.95
Knowledge 1. I feel very knowledgeable about Smart Devices. 2. If I had to purchase Smart Devices today, I
would need to gather very little information in order to make a wider decision.*
3. I feel very confident about my ability to tell the difference in quality among different brands of Smart Devices.
4. If a friend asked me about Smart Devices, I could give them advice about different brands.
Four 7-point items anchored by “strongly disagree” [1] and “strongly agree” [7], adapted from Smith and Park (1992).
α = 0.88
Dependence 1. I am afraid of becoming dependent on Smart Devices.
2. Smart Devices will reduce my autonomy. 3. Smart Devices will strengthen my addiction to
technology.
4. I'm thinking my social life will suffer from my use of Smart Devices.
Four 7-point items anchored by “strongly disagree” [1] and “strongly agree” [7], adapted from Mani and Chouk (2017).
α = 0.81
Risk 1. There is a good chance I will make a mistake if I purchase a Smart Device.
2. Smart Device is a very risky purchase.
Two 7-point items anchored by “strongly disagree” [1] and “strongly agree” [7], adapted from
28
Laroche, Yang, Mcdougall, and Bergeron (2005).
Familiarity I find Smart Devices to be: Tow 7-point items, anchored by “novel” [1] and “familiar” [7], “atypical” [1] and “typical” [7], adapted from Cox and Cox (2002).
α = 0.75
Price fairness The price of Smart Devices is: Eight 7-point items, anchored by “unfair” [1] and “fair” [7], “unreasonable” [1] and “reasonable” [7],
“dishonest” [1] and “honest” [7], “unacceptable” [1] and
“acceptable” [7],
“not justified” [1] and “justified” [7],
“unsatisfactory” [1] and “satisfactory” [7], “extremely high” [1] and “extremely low” [7], “bad value for money” [1] and “good value for money” [7 adapted from Haws and Bearden (2006).
α = 0.92
Improper access concerns
1. Smart Device producers should devote more time and effort to prevent unauthorized access to personal information.
2. Smart Device producers should take more steps to ensure that the personal information in their files is accurate.*
3. Smart Device producers should take more steps to ensure that unauthorized people cannot access personal information in their computers.
Three 7-point items anchored by “strongly disagree” [1] and “strongly agree” [7], adapted from Hsu and Lin (2016).
α = 0.79
Novelty I find Smart Devices to be: Tow 7-point items, anchored by “new” [1] and “old” [7], “original” [1] and “unoriginal” [7], adapted from Cox and Cox (2002).
α = 0.73
Unauthorized secondary use concerns
1. Smart Device producers should not use personal information for any purpose not specifically authorized by the user.
2. Smart Device producers should never sell personal information to other companies. 3. Smart Device producers should never share
personal information with other companies unless specifically authorized to do so by the user.
Three 7-point items anchored by “strongly disagree” [1] and “strongly agree” [7], adapted from Hsu and Lin (2016).
α = 0.77
Purchase intention
1. How likely are you to purchase Smart Devices? 2. How probable is it that you will purchase Smart
Devices?
3. How possible is it that you will purchase Smart Devices?
Three 7-point items, anchored by “very unlikely” [1] and “very likely” [7],
“very improbable” [1] and “very probable” [7],
“very impossible” [1] and “very possible” [7], adapted from Grewal, Monroe, and Krishnan (1998).
29
Positive WOM 1. I will recommend friends to buy Smart Devices. 2. I will say good things about Smart Devices to
others.
3. I bring up Smart Devices in a positive way in conversations I have with friends and acquaintances.
4. In social situations, I often speak favorably about Smart Devices.
Four 7-point items anchored by “strongly disagree” [1] and “strongly agree” [7], adapted from Arnett, German, and Hunt (2003), Harrison-Walker (2001) and Zeithaml, Berry, and Parasuraman (1996).
α = 0.94
Optimism 1. Technology gives you more freedom of mobility.
2. Products and services that use the newest. technologies are much more convenient to use. 3. You find new technologies to be mentally
stimulating.
Three 7-point items anchored by “strongly disagree” [1] and “strongly agree” [7], adapted from Rojas-Mendez, Parasuraman, and Papadopoulos (2017).
α = 0.84
Innovativeness 1. You can usually figure out new high-tech products and services without help from others. 2. Other people come to you for advice on new
technologies.
3. You find you have fewer problems than other people in making technology work for you. 4. You keep up with the latest technological
developments in your areas of interest.
5. In general, you are among the first in your circle of friends to acquire new technology when it appears.
Five 7-point items anchored by “strongly disagree” [1] and “strongly agree” [7], adapted from Rojas-Mendez, Parasuraman, and Papadopoulos (2017).
α = 0.91
Discomfort 1. Sometimes, you think that technology systems are not designed for use by ordinary people. 2. It is embarrassing when you have trouble with a
high-tech gadget while people are watching.* 3. Technology always seems to fail at the worst
possible time.
4. Many new technologies have health or safety risks that are not discovered until after people have used them.
5. There is no such thing as a manual for a high-tech product or service that is written in plain language.
6. If you buy a high-tech product or service, you prefer to have the basic model over one with a lot of extra features.
Six 7-point items anchored by “strongly disagree” [1] and “strongly agree” [7], adapted from Rojas-Mendez, Parasuraman, and Papadopoulos (2017).
α = 0.69
Insecurity 1. You do not consider it safe giving out a credit card number over a computer.
2. The human touch is very important when doing business with a company.*
3. You do not consider it safe to do any kind of financial business online.
4. You do not feel confident doing business with a place that can only be reached online.
5. You worry that information you send over the internet will be seen by other people.
Five 7-point items anchored by “strongly disagree” [1] and “strongly agree” [7], adapted from Rojas-Mendez, Parasuraman, and Papadopoulos (2017).
α = 0.85
Perceived critical mass
1. Most people in my peer group frequently use Smart Devices.
2. Most people in my community frequently use Smart Devices.
3. My family/friends frequently use Smart Devices. 4. Most people I know use Smart Devices.
Four 7-point items anchored by “strongly disagree” [1] and “strongly agree” [7], adapted from Hsu and Lin (2016).
α = 0.95
Perceived compatibility
1. Using Smart Devices is compatible with all aspects of my daily life.*
2. I think that using Smart Devices fits well with the way I like to live.
3. Using Smart Devices fits into my lifestyle.
Three 7-point items anchored by “strongly disagree” [1] and “strongly agree” [7], adapted from Hsu and Lin (2016).
30 Number and
complementarity of smart devices
1. I think a good number of Smart Devices can be used.
2. I could easily find circumstances in which I can use Smart Devices.
3. A wide range of Smart Device products is available.
4. A wide range of apps concerning Smart Devices are available on smartphone.
Five 7-point items anchored by “strongly disagree” [1] and “strongly agree” [7], adapted from Hsu and Lin (2016).
α = 0.80
*Items delated after scale reliability test.
Table 3. Cluster Analysis Consumer Characteristics by Cluster.
Cluster Comparison tests
Innovators Early Majority
Skeptics Cluster 1 Cluster 2 Cluster 3 Cluster size (%) 222 (33.18%) 269 (40.21%) 178 (26.61%) F value (df); p Clustering variables Data collection concerns (DCC) 3.12 (1.29) (2; 3) 5.58 (0.94) (1) 5.48 (1.23) (1) 329.84 (666); p < .001 Unautho-rized secondary use concerns 6.30 (1.03) (2; 3) 6.66 (0.62) (1) 6.58 (0.77) (1) 12.49 (666); p < .001 Improper access concerns 6.01 (1.09) (2; 3) 6.52 (0.65) (1) 6.42 (0.81) (1) 22.42 (666); p < .001 Self-efficacy 6.17 (1.01) (3) 6.20 (0.74) (3) 4.29 (1.40) (1; 2) 216.54 (666); p < .001 Depen-dence 2.66 (1.14) (2; 3) 4.31 (1.26) (1; 3) 3.75 (1.44) (1; 2) 103.55 (666); p < .001 Intusive-ness 2.13 (0.75) (2; 3) 3.60 (1.11) (1; 3) 4.51 (1.37) (1; 2) 250.13 (666); p < .001 Novelty 5.89 (0.98) (2; 3) 5.43 (1.18) (1; 3) 5.13 (1.29) (1; 2) 22.02 (666); p < .001 Familia-rity 5.20 (1.33) (3) 5.12 (1.41) (3) 3.83 (1.23) (1; 2) 64.27 (666); p < .001 Know-ledge 4.70 (1.34) (3) 4.61 (1.33) (3) 2.87 (1.22) (1; 2) 121.82 (666); p < .001 Perceived usefulness 6.12 (0.77) (2; 3) 5.86 (0.85) (1; 3) 4.29 (1.31) (1; 2) 201.91 (666); p < .001 Perceived value 5.59 (0.93) (3) 5.36 (0.95) (3) 3.49 (1.29) (1; 2) 235.38 (666); p < .001 Price fairness 4.31 (1.00) (2; 3) 3.83 (1.17) (1; 3) 3.52 (1.03) (1; 2) 27.49 (666); p < .001 Risk 2.39 (1.22) (2; 3) 3.35 (1.35) (1; 3) 4.20 (1.28) (1; 2) 98.87 (666); p < .001 Ease of use 5.83 (0.84) (3) 5.78 (0.72) (3) 4.26 (1.05) (1; 2) 211.94 (666); p < .001
31 Outcome variables Purchase intention 5.94 (1.11) (2; 3) 5.57 (1.33) (1; 3) 3.70 (1.63) (1; 2) 153.06 (666); p < .001 Positive WOM 5.14 (1.33) (2; 3) 4.71 (1.29) (1; 3) 2.84 (1.40) (1; 2) 162.82 (666); p < .001 Individual traits Optimism 5.63 (0.96) (3) 5.44 (0.95) (3) 4.12 (1.24) (1; 2) 120.73 (666); p < .001 Innovati-veness 4.78 (1.39) (3) 4.65 (1.37) (3) 3.30 (1.27) (1; 2) 71.63 (666); p < .001 Discom-fort 3.43 (1.02) (2; 3) 4.06 (0.96) (1; 3) 4.43 (0.97) (1; 2) 54.47 (666); p < .001 Insecurity 2.73 (1.26) (2; 3) 3.90 (1.40) (1) 3.87 (1.42) (1) 53.50 (666); p < .001 Network externalities Perceived critical mass 5.64 (1.35) (2; 3) 6.07 (1.03) (1; 3) 4.28 (1.72) (1; 2) 97.38 (666); p < .001 Perceived compati-bility 5.72 (1.15) (2; 3) 5.25 (1.18) (1; 3) 3.22 (1.52) (1; 2) 211.00 (666); p < .001 Number and comple-mentarity of smart devices 6.21 (0.73) (3) 6.10 (0.66) (3) 4.84 (0.98) (1; 2) 186.76 (666); p < .001 Number of smart devices owned 3.36 (1.38) (2; 3) 2.95 (1.26) (1; 3) 2.37 (1.33) (1; 2) 27.70 (666); p < .001 Type of smart devices owned Traditional (smartphone, tablet, laptop) % 25.68% 29.00% 43.26% Non-traditional % 74.32% 71.00% 56.74% Demogra-phic information Gender (% of women) 52.70% 52.42% 47.19% Age (% < 46 years) 61.26% 68.40% 42.70%
32
Figure 1. Factors Pro and Against the Adoption of AI-enabled Products
Findings
Cluster 1 includes Innovators, who show the highest purchase and WOM intentions. In relation to barriers to adopting AI-enabled products, they offer the lowest mean values for DCC, unauthorized secondary use concerns, improper access concerns, intrusiveness, dependence, and risk. This cluster indicates high levels of novelty, familiarity, perceived usefulness, perceived value, price fairness, ease of use, self-efficacy, and knowledge. Moreover, it scores lowest on the traits of discomfort and insecurity and high perceived network externalities of AI-enabled products.
Cluster 3 is composed of Skeptics. These consumers exhibit the lowest means for both purchase and WOM intentions. This segment is significantly more concerned about data collection, unauthorized secondary use, improper access, intrusiveness, dependence, and risk than the Innovators. Skeptics provide the lowest means for self-efficacy, novelty, familiarity, perceived usefulness, perceived value, price fairness, knowledge, and ease of use. Furthermore, compared with the other segments, Skeptics are significantly higher on discomfort traits and lower on innovativeness and optimism. Finally, this cluster shows the lowest means, significantly different from the other two clusters, on all the network externalities.
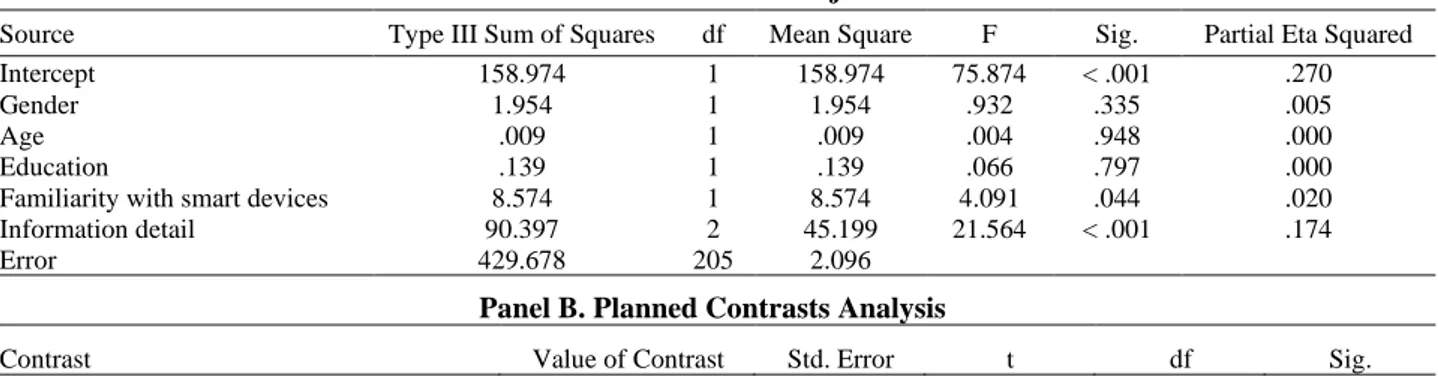
33 Cluster 2 is composed of the Early Majority, and it occupies an intermediate position, with intermediate values for both purchase and WOM intentions. It is significantly different from the other two clusters with regard to the barriers associated with intrusiveness, dependence, novelty, perceived usefulness, price fairness, and risk, as well as the discomfort trait. Early Majority consumers also are similar to Innovators when it comes to functional barriers (i.e., ease of use, familiarity, perceived value, and knowledge), the psychological self-efficacy barrier, positive individual traits (i.e., innovativeness and optimism), and the complementarity of network externalities. Yet they are similar to Skeptics when it comes to psychological barriers (i.e., DCC, unauthorized secondary use concerns, improper access concerns) and the negative insecurity trait.
The three segments differ in the relative importance they attribute to specific barriers to the adoption of AI-enabled products. In particular, Clusters 1 and 3 differ significantly in relation to all the barriers; Cluster 2 is similar to Cluster 1 across most functional barriers (i.e., perceived value, familiarity, knowledge, ease of use) and similar to Cluster 3 or intermediate between the two clusters for the psychological barriers. Moreover, DCC represents a significant barrier to AI-enabled product adoption for the Early Majority and Skeptics. Thus, the results confirm the presence of several barriers to consumers’ adoption of AI-enabled products, depending on which consumers express a specific level of intention to adopt. Furthermore, DCC is the most important barrier in profiling consumers and assigning them to the three clusters.
General discussion
Even as we enter a new decade, one that was predicted to be the era of SOs, consumers remain reluctant to buy these products, due to several barriers that they experience when considering the purchase of a SO. The marketing literature about how consumers respond to innovations refers to two research paradigms (Laukkanen, 2016): the innovation adoption paradigm and the resistance to innovation paradigm. These two streams of literature have identified several factors that can
34 respectively lead or inhibit consumers in the adoption of innovations and, consequently, in the adoption of SOs (e.g., Johnson et al., 2018; Laukkanen, 2016; Laukkanen et al., 2007; Mani & Chouk, 2017, 2018). However, two aspects must be considered. First, literature that considers consumers’ reactions to innovations is fragmented in terms of both conceptual models and theories adopted and barriers identified and type of innovations. Second, SOs are a specific type of innovation, due to their specific technical features and characteristics (i.e., agency, autonomy, and authority) (Hoffman & Novak, 2018; Novak & Hoffman, 2019). This second aspect suggests that the reasons leading consumers to avoid the adoption of SOs could be different from the reasons underlying the non-adoption of a general innovation. Therefore, investigating what are the specific factors that lead to or inhibit the adoption of SOs is of pivotal importance. With two online studies we identified the barriers to consumer adoption of SOs (Study 1) and we identified the most important barrier in hindering consumers’ adoption of these products (Study 2). The results of Study 1 and Study 2 provide relevant insights into consumer perceptions about the barriers of SO adoption. Price and value have emerged in Study 1 as major obstacles. These findings are partially supported in Study 2. However, Study 2 revealed that data collection concerns is the most important barrier in profiling consumers and assigning them to the three different clusters.
Theoretical implications
This research contributes to the existing literature in two ways. First, we systematize the literature about consumer adoption and resistance to SOs by. Starting from the literature about innovation adoption and resistance, and then moving to the one about SOs adoption and resistance, we put together different factors that can play a role in leading or hindering consumers in adopting a SO. Second, we identify new barriers to the adoption of SOs (i.e., risky purchase and privacy concerns). Finally, we identify the most important barrier to consumers’ adoption of SOs and provided a detailed profile of different types of consumers in term of psychological barriers, functional barriers, network externalities, and individual traits.