Research Article
Dentin Morphology of Root Canal Surface: A Quantitative
Evaluation Based on a Scanning Electronic Microscopy Study
Giuseppe Lo Giudice,
1Giuseppina Cutroneo,
2,3Antonio Centofanti,
2,3Alessandro Artemisia,
1Ennio Bramanti,
1Angela Militi,
1Giuseppina Rizzo,
2,3Angelo Favaloro,
2,3Alessia Irrera,
4Roberto Lo Giudice,
1and Marco Cicciù
51Department of Medical-Surgery and Odontostomatologic Experimental Sciences, University of Messina, Italy
2Department of Biomedical Sciences and Morpho-Functional Imaging, University of Messina, Italy
3IRCCS Centro Neurolesi “Bonino-Pulejo”, Messina, Italy
4IPCF-CNR Viale Stagno D’Alcontres, 98100 Messina, Italy
5Department of Human Pathology, University of Messina, Via Consolare Valeria, 98100 Messina, Italy
Correspondence should be addressed to Marco Cicci`u; [email protected] Received 14 February 2015; Revised 25 March 2015; Accepted 13 April 2015 Academic Editor: Levent Sarikcioglu
Copyright © 2015 Giuseppe Lo Giudice et al. This is an open access article distributed under the Creative Commons Attribution License, which permits unrestricted use, distribution, and reproduction in any medium, provided the original work is properly cited.
Dentin is a vital, hydrated composite tissue with structural components and properties that vary in the different topographic portions of the teeth. These variations have a significant implication for biomechanical teeth properties and for the adhesive systems utilized in conservative dentistry. The aim of this study is to analyse the root canal dentin going from coronal to apical zone to find the ratio between the intertubular dentin area and the surface occupied by dentin tubules varies. Observations were conducted on 30 healthy premolar teeth extracted for orthodontic reasons in patients aged between 10 and 14. A SEM analysis of the data obtained in different canal portions showed that, in the coronal zone, dentinal tubules had a greater diameter (4.32 𝜇m) than the middle zone
(3.74 𝜇m) and the apical zone (1.73 𝜇m). The average number of dentinal tubules (in an area of 1 mm2) was similar in coronal zone
(46, 798 ± 10, 644) and apical zone (45, 192 ± 10, 888), while in the middle zone they were lower in number (30, 940 ± 7, 651). However, intertubular dentin area was bigger going from apical to coronal portion. The differences between the analysed areas must be considered for the choice of the adhesive system.
1. Introduction
Dentin is the calcified tissue that forms the major part of the tooth. It is composed mainly by type I collagen fibrils (and a small amount of types III, IV collagen, noncollagen proteins, and proteoglycans) and by hydroxylapatite [1–3].
Anatomic dentin microstructure shows dentinal tubules, cylindrical canals of 1-2 𝜇 in diameter, running from the pulp to the dentinoenamel junction (DEJ) in the crown, and the cementodentinal junction (CEJ) in the root. An inter-tubular dentin layer individually surrounds these tubules. Calcified collagen fibrils are 50–100 𝜇 of average diameter and constitute the dentin basic structure; they are orthogonal to
the tubules and form an intertubular dentin matrix network [1,4].
In order to evaluate dentin ultrastructure several studies [5,6] and many different techniques have been performed immunofluorescence, microradiography, scanning electron microscopy (SEM), and transmission electron microscopy (TEM).
A detailed knowledge of dentin structure is essential in order to understand its physiology and the mechanism by which different adhesive systems work in restorative dentistry. In the total etching technique we use the exposed intertubular collagen fibrils together with resin tubular tags to obtain a >20 MPa adhesion force [5–8].
The majority of teeth anatomical studies analyse the coro-nal denticoro-nal substratum. Cagidiaco and Ferrari [6] demon-strated how the anatomy of the coronal dentin is character-ized by different density, diameter, and orientation of dentinal tubules in different cavity preparation cutting planes.
From the literature analysis, observing the coronal part of the dentin layer close to the pulp, the dentinal tubules number was 65,000–45,000/mm2; this number was higher if com-pared to the outer dentin areas (15,000–20,000/mm2) [9,10]. The tubular diameter is larger near to the pulp (3-4 𝜇) and smaller in the peripheral area near to the DEJ (average diameter 1.7 𝜇). Casually large dentinal tubules have been observed [11].
Age determines variations of the tubular lumen diameter due to a physiological sclerosis of the dentinal tubules; indeed, in advanced age, the tubules located in the most superficial dentin layer may measure even 0.2 𝜇 [12].
Dentinal tubules have very thin collateral ramifications (1 𝜇 diameter). These secondary tubules are right-angled, divided, and connected to closer tubules through intertubular dentin forming a three-dimensional network [11,13].
We can state that tubule morphology and intertubular substance differences were found in coronal and root dentin as well as a wide variation among different areas of the root canal [14,15].
This micromorphological study is aimed to evaluate, in vitro, dentinal tubules size and tubular distribution in coro-nal, middle, and apical root portions. This anatomical condi-tion, related to the intertubular dentin area and the surface occupied by dentinal tubules (determined by their number and diameter), may influence the adhesives efficiency in endocanal cementation of composite reinforced posts.
2. Materials and Methods
Observations were conducted on 30 healthy premolars extracted for orthodontic reasons, in patients aged between 10 and 14 (mean age: 11.4 years, STD 1.26) and preserved in saline solution (0.9%) at 4∘C. Informed consent was obtained from all patients and all the procedures were performed according to the Helsinki Declaration of 1975.
The preparation procedure of specimens consisted in a preliminary tooth crown and a root pulp tissue removal.
Pulp removal was performed using manual endodontic files under irrigation of 5% NaOCl (Niclor 5; OGNA Lab S.r.l Muggi`o, MB, IT) at 50∘C, alternating with 17% EDTA (OGNA Lab S.r.l Muggi`o, MB, IT) for 20 min followed by a wash with 5% NaOCl for 1 min and a saline solution (OGNA Lab S.r.l Muggi`o, MB, IT).
Preliminary to the observation we proceeded by etching the canal lumen with 37% orthophosphoric acid (Universal Etchant Scotchbond; 3M ESPE, St. Paul, USA) for 15 sec., washing with saline solution and metallizing [16]. After-wards, all specimens were divided along the longitudinal axis using a coronal-apical groove such as a fracture guide.
All specimens were analysed with Gemini Field Emis-sion SEM (FE-SEM) SUPRA 25 (Carl Zeiss NTS GmbH, Oberkochen, Germany), with an EDAX EDX detector.
Surface was analysed with a 1.7 𝜇m resolution (15 kV) at a 3072 × 2304 pixels resolution. A 2,500x was used to quantify dentinal tubules density and intertubular surface, while a 23,000x was used to evaluate tubule morphology. Three different areas (coronal, middle, and apical) of the root canal of each specimen were examined [16,17]. Within the same area of the canal, measurement was conducted by taking random references from three default areas that were 400 𝜇m2. According to anatomical observations, the number of tubules in the three measurement areas was quantified and the tubules average number was calculated in each area (Table 1). On 9 tubules randomly selected within each area (3 for each area) the diameter was measured (Table 1).
According to these data, quantification of the dentinal surface area occupied by the tubular lumens (in absolute value and percentage) and intertubular dentin surface area was made.
The aforementioned quantification was carried out as follows.
(1) Identification of the number of dentinal tubules per mm2: this parameter was calculated by the Schellen-berg formula (𝑋 = 𝑛106/𝑧), where 𝑛 is the number of tubules observed in each analysed area and 𝑧 is the global surface of observation (Table 2).
(2) Identification of tubular lumen average surface: con-sidering the tubule section is roughly circular, and the area was obtained through its average diameter (Table 2).
(3) Calculation of area occupied by all tubules: this datum was obtained by multiplying tubules number in one mm2to tubules average area (Table 2).
(4) The intertubular dentin surface area was obtained by subtraction of the area occupied by the tubules (Table 2).
A further datum was obtained by calculating the percent-age ratio between the observation area and the tubular lumen area (Table 2).
A two-way ANOVA test is a way for investigating the effect of two nominal predictor variables on a continuous out-come variable. For this reason two-way analysis of variance (ANOVA) was performed to verify statistically significant difference among the tested groups. A 𝑃 value < 0.05 was considered as significant. Then we considered the post hoc doc accordingly with LSD Fisher’ test: LSD = 𝑡𝛼/2,𝑑𝑓√2𝑆2
𝑒/𝑛 in order to have the significance values [18].
3. Results
The analysis of the data obtained from the microphotographs taken in various canal portions is summarised in Tables1and
2and Graphs (Figures1(a)and1(b)).
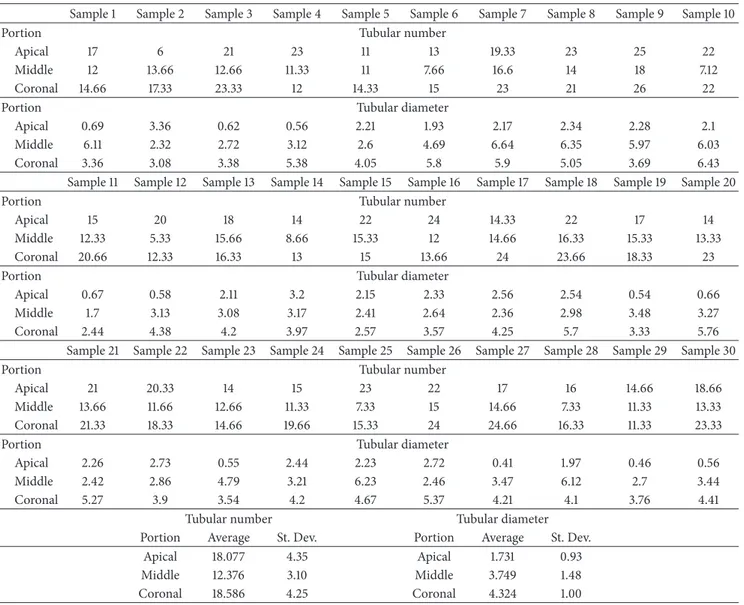
Table 1 shows averages, found in each specimen, and standard deviation of the number of tubules identified in the three random areas, carried out in the coronal, middle, and apical root canal portions.
Table 1: Average and St. Dev. of tubular number and tubular diameter (three observations/areas of 400 𝜇m2).
Sample 1 Sample 2 Sample 3 Sample 4 Sample 5 Sample 6 Sample 7 Sample 8 Sample 9 Sample 10
Portion Tubular number
Apical 17 6 21 23 11 13 19.33 23 25 22
Middle 12 13.66 12.66 11.33 11 7.66 16.6 14 18 7.12
Coronal 14.66 17.33 23.33 12 14.33 15 23 21 26 22
Portion Tubular diameter
Apical 0.69 3.36 0.62 0.56 2.21 1.93 2.17 2.34 2.28 2.1
Middle 6.11 2.32 2.72 3.12 2.6 4.69 6.64 6.35 5.97 6.03
Coronal 3.36 3.08 3.38 5.38 4.05 5.8 5.9 5.05 3.69 6.43
Sample 11 Sample 12 Sample 13 Sample 14 Sample 15 Sample 16 Sample 17 Sample 18 Sample 19 Sample 20
Portion Tubular number
Apical 15 20 18 14 22 24 14.33 22 17 14
Middle 12.33 5.33 15.66 8.66 15.33 12 14.66 16.33 15.33 13.33
Coronal 20.66 12.33 16.33 13 15 13.66 24 23.66 18.33 23
Portion Tubular diameter
Apical 0.67 0.58 2.11 3.2 2.15 2.33 2.56 2.54 0.54 0.66
Middle 1.7 3.13 3.08 3.17 2.41 2.64 2.36 2.98 3.48 3.27
Coronal 2.44 4.38 4.2 3.97 2.57 3.57 4.25 5.7 3.33 5.76
Sample 21 Sample 22 Sample 23 Sample 24 Sample 25 Sample 26 Sample 27 Sample 28 Sample 29 Sample 30
Portion Tubular number
Apical 21 20.33 14 15 23 22 17 16 14.66 18.66
Middle 13.66 11.66 12.66 11.33 7.33 15 14.66 7.33 11.33 13.33
Coronal 21.33 18.33 14.66 19.66 15.33 24 24.66 16.33 11.33 23.33
Portion Tubular diameter
Apical 2.26 2.73 0.55 2.44 2.23 2.72 0.41 1.97 0.46 0.56
Middle 2.42 2.86 4.79 3.21 6.23 2.46 3.47 6.12 2.7 3.44
Coronal 5.27 3.9 3.54 4.2 4.67 5.37 4.21 4.1 3.76 4.41
Tubular number Tubular diameter
Portion Average St. Dev. Portion Average St. Dev.
Apical 18.077 4.35 Apical 1.731 0.93
Middle 12.376 3.10 Middle 3.749 1.48
Coronal 18.586 4.25 Coronal 4.324 1.00
Table 2: Observation data (mm2and %) for each root portion.
Portion Tubular number(mm2) Tubular lumenarea (𝜇m2) Surface occupied bytubules (1 mm2) Intertubular area(mm2) area/dentinal surface (%)Tubular lumen
Apical 45,192 ± 10,888 3.033 ± 2.43 0.14 0.86 13.71% Middle 30,940 ± 7,651 12.77 ± 10.23 0.40 0.60 39.53% Coronal 46,798 ± 10,644 15.47 ± 7.06 0.72 0.28 72.42% 70000 60000 50000 40000 30000 20000 10000 0
Apical Middle Coronal
(×
1mm
2)
(a) Tubules number
Apical Middle Coronal
(𝜇 m 2 ) 25 20 15 10 5 0
(b) Tubular lumen area
(a) (b)
Pa R1
Pa1 = 3.083 𝜇m
Pb1 = 77.6∘
Pa1
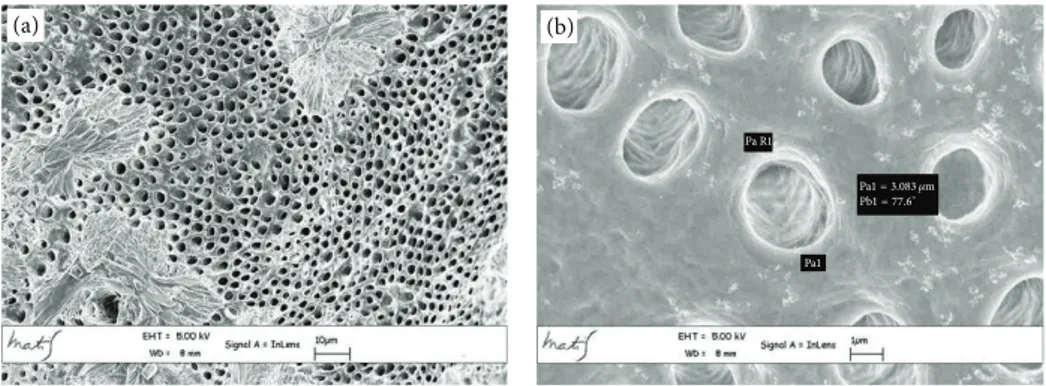
Figure 2: Coronal area metallised dentin specimens analysed with Gemini Field Emission SEM (FEM-SEM) at 1.7 𝜇m and 3072 × 2304 pixel
resolution 2500x (a) and 23000x (b) magnification: presence of calcospherites (Figure 3(a)).
(a) (b)
Pa R1
Pa1 = 3.109 𝜇m
Pb1 = 89.4∘
Pa1
Figure 3: Middle area metallised dentin specimens analysed with Gemini Field Emission SEM (FEM-SEM) at 1.7 𝜇m and 3072 × 2304 pixel
resolution 2500x (a) and 23000x (b) magnification: presence of calcospherites (Figure 4(a)).
The average linear values of the dentinal tubules diame-ters evaluated in 9 areas, expressed in 𝜇m, are listed inTable 2. The average diameter within the various areas has a variation range between 6.43 and 2.44 𝜇m (coronal area Figures2(a) and 2(b)), 6.64 and 1.7 𝜇m (middle area Figures 3(a) and
3(b)), and 3.36 and 0.41 𝜇m (apical area Figures 4(a) and
4(b)).
General averages calculated in mm2show that the coro-nal third of the cacoro-nal has a higher tubular density than the middle third (46, 798 ± 10, 644 mm2 versus 30, 940 ± 7, 651 mm2). In the same areas the tubules average diameter decreases (4.324 𝜇m versus 3.749 𝜇m). The apical third shows an average tubular density of 45, 192 ± 10, 888 mm2 that is similar to the coronal third, but with smaller tubular diameter (1.731 𝜇m) (Table 1).
The ANOVA analysis shows that differences between tubular diameter and number observed among the three canal areas (apical versus middle, middle versus coronal) and the ones evaluated by post hoc Fisher’s test (LSD = 𝑡𝛼/2,𝑑𝑓√2𝑆2
𝑒/𝑛) result significant (𝑃 < 0.05).
As shown inTable 2andFigure 2, the ratio between tubu-lar lumen area and dentinal surface, moving from coronal to apical areas, decreases from 72.42% to 39.53% and 13.71%.
Furthermore, analysing individually high-magnification microphotographs, the secondary tubules appear to be more common inside the dentinal tubule wall in the coronal
portion than those observed in the middle and apical por-tions (Figures5(a),5(b), and5(c)).
4. Discussion
The restoration of teeth treated with endodontic therapy frequently requires the use of endocanalar post cemented with adhesive resin, in order to provide the retention of the coronal restoration and to achieve a better homogeneity between the composite inlay, the build-up, the fiber posts, and the luting agents, reinforcing the residual dental structure [19,20].
Ferrari et al. [21] report that the anatomical variations that are present between different dentin portions of the root canal can influence the efficiency of the adhesive system used; therefore, the knowledge of details related to canal dentinal structure as well as its tubules and their ramifications is essential to develop efficacious resinous build-ups, adhesives, and endodontic cements [5].
Several authors [21–24] described anatomical variations of both number and size of dentinal tubules, when moving from the coronal to the apical portion of the root canal.
Data retrieved from our research show a substantial morphological variability among the dentin that forms the different endocanalar regions; this variability is seen in tubular number differences and diameter differences. Moving
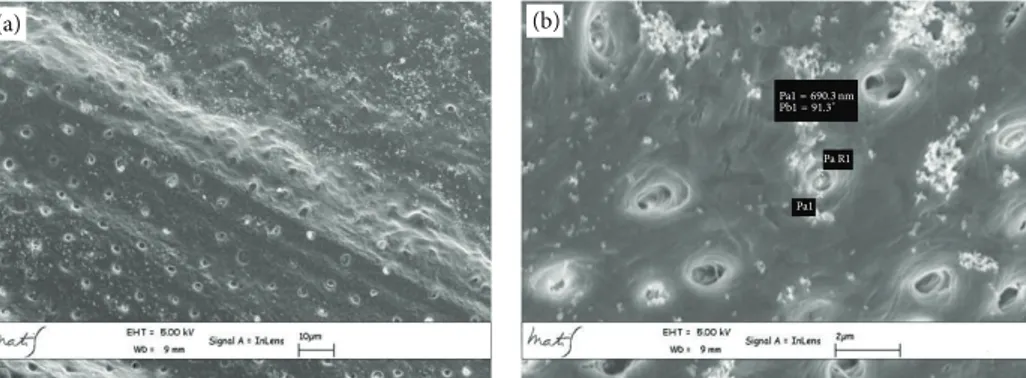
(a) (b)
Pa R1 Pa1 = 690.3 nm
Pb1 = 91.3∘
Pa1
Figure 4: Apical area metallised dentin specimens analysed with Gemini Field Emission SEM (FEM-SEM) at 1.7 𝜇m and 3072 × 2304 pixel resolution 2500x (a) and 23000x (b) magnification.
(a) (b) (c) Pa R1 Pa R2 Pa1 = 3.362 𝜇m Pb1 = 25.4∘ Pa1 Pa2 Pa2 = 1.152 𝜇m Pb2 = 26.9∘
Figure 5: High magnification microphotograph analysis shows a higher number of secondary tubules access cavities in coronal zone than (a) in the middle (b) and apical (c) ones. In Figure (c) the Pa1 is 3.362 𝜇m and it represents the external diameter while the Pa2 is 1.152 𝜇m and it represents the diameter of the internal portion of the tubule.
forward from coronal to apical zone our study shows how the tubular lumen area progressively decreases from 15.47 ± 7.06 𝜇m2 of the coronal zone to 12.77 ± 10.23 𝜇m2 of the middle zone, reaching his minimum of 3.033 ± 2.43 𝜇m2in the apical zone.
Tubular distribution does not seem to be regular moving from 46, 798 ± 10, 644 mm2 to 30, 940 ± 7, 651 mm2 and to 45, 192 ± 10, 888 mm2, respectively, in the coronal, middle, and apical zones.
From the crossed analysis of this data it is evident how the surface occupied by the intertubular dentin, calculated by difference, progressively increases moving from coronal to apical while the ratio between tubular lumen area and dentinal surface progressively decreases (Table 2,Figure 2).
The endocanalar structural differences resulted from our data analysis appear to be substantially influenced by the diameter instead of the tubular number.
Although some authors consider that the endocanalar zone does not affect adhesion, further studies have revealed differences [25,26].
According to the authors, the push-out test shows higher bond strength values in the apical third than those in other parts of the root canal [27–30].
Differences, in the endocanalar regions, regarding the efficiency of various adhesive systems (total-etch and self-etching adhesive systems) are reported in the literature.
A study by Perdig˜ao et al. [24] showed higher bond strength values in the coronal region using total-etch system. This kind of adhesive exploits both a resin-collagen hybrid
layer formation and a micromechanical retention with resin tags inside the dentinal tubules.
The presence of numerous tubules with big diameter and secondary tubule access cavities, identified in our research, can promote this mechanism [31].
Instead in the apical region, the self-etching adhesives that exploit all the dentinal surface show better performances, because the adhesion with these systems is obtained modify-ing the collagen fibers present in the intertubular dentin area [25,28,30].
Our observations agree with this thesis and explain their inner mechanisms, showing the presence of numerous small diameter tubules and a wide intertubular area surface.
Considering this observation, the dentin, as interface of endocanalar adhesion, has to be studied not only considering its tubular number but also considering its diameter and consequently the intertubular dentin characteristics that, biologically, are strictly linked to the odontoblast activities that induce and regulate the mineralization [32].
These cells are involved in type I collagen synthesis and the secretion of proteoglycans and noncollagenous proteins, increasing the level of mineralization of secondary dentin.
The secondary dentin deposition is associated with odon-toblasts reorganization in a single layer and determines the decrease in the number of odontoblasts [9].
Bjørndal and Thylstrup demonstrated a low frequency of disjunctions between the odontoblast layer and the predentin in the undermineralized tooth [33].
In presence of carious lesions further mineralization and dentinal anatomy modifications are evident, along with the tertiary dentin formation from the odontoblast-like cells and partially from fibroblasts. Considering that tooth maturation and bacteria invasion can cause intratubular and peritubular ex novo dentin formation, dentinal surface does not have to be considered constant in time [32,34,35].
Our research has been conducted on premolars in paediatric-aged patients, extracted for orthodontic reasons, in order not to include excessive variables in the research data. The results of our research showed that dentinal structure varied in the different root canal portions. This anatomic peculiarity can explain the differences identified in the adhesive efficiency in the different endocanalar regions.
The dentinal microscopic structure is an important topic in conservative dentistry for the choice of different adhesive technologies and for a correct clinical approach.
Conflict of Interests
The authors declare that there is no conflict of interests regarding the publication of this paper.
References
[1] A. Linde and M. Goldberg, “Dentinogenesis,” Critical Reviews in Oral Biology & Medicine, vol. 45, pp. 679–728, 1993. [2] A. Nanci, Oral Histology. Development, Structure and Function,
Mosby, St. Louis, Mo, USA, 2003.
[3] R. K. Nalla, A. E. Porter, C. Daraio et al., “Ultrastructural examination of dentin using focused ion-beam cross-sectioning
and transmission electron microscopy,” Micron, vol. 36, no. 7-8, pp. 672–680, 2005.
[4] S. J. Jones and A. Boyde, “Ultrastructure of dentin and dentino-genesis,” in Dentin and Dentinogenesis, pp. 81–134, CRC Press, Linde, Boca Raton, Fla, USA, 1984.
[5] I. A. Mj¨or, M. R. Smith, M. Ferrari, and F. Mannocci, “The structure of dentine in the apical region of human teeth,” International Endodontic Journal, vol. 34, no. 5, pp. 346–353, 2001.
[6] M. C. Cagidiaco and M. Ferrari, Bonding to dentin. Mechanism, morphology and efficacy of bonding resin composites to dentin in vitro and in vivo [Ph.D. thesis], University of Amsterdam, Amsterdam, The Netherlands, 1995.
[7] A. J. Gwinnett, F. R. Tay, K. M. Pang, and S. H. Y. Wei, “Quantitative contribution of the collagen network in dentin hybridization,” American Journal of Dentistry, vol. 9, no. 4, pp. 140–144, 1996.
[8] J. Perdig˜ao, G. Gomes, and V. Augusto, “The effect of dowel space on the bond strengths of fiber posts,” Journal of Prostho-dontics, vol. 16, no. 3, pp. 154–164, 2007.
[9] J.-C. Franquin, M. Remusat, I. A. Hashieh, and J. Dejou, “Immunocytochemical detection of apoptosis in human odon-toblasts,” European Journal of Oral Sciences, vol. 106, no. 1, pp. 384–387, 1998.
[10] L. Vermelin, S. L´ecolle, D. Septier, J.-J. Lasfargues, and M. Goldberg, “Apoptosis in human and rat dental pulp,” European Journal of Oral Sciences, vol. 104, no. 5-6, pp. 547–553, 1996. [11] H. Agematsu, H. Watanabe, H. Yamamoto, M. Fukayama,
T. Kanazawa, and K. Miake, “Scanning electron microscopic observations of microcanals and continuous zones of interglob-ular dentin in human deciduous incisal dentin,” The Bulletin of Tokyo Dental College, vol. 31, no. 2, pp. 163–173, 1990.
[12] L. Schroeder and R. M. Frank, “High-resolution transmission electron microscopy of adult human peritubular dentine,” Cell and Tissue Research, vol. 242, no. 2, pp. 449–451, 1985. [13] T. Dyngeland, G. Fosse, and N. P. Berg Justesen, “Histochemical
study of giant tubule content in dentin of unerupted cow incisors,” Scandinavian Journal of Dental Research, vol. 92, no. 3, pp. 177–182, 1984.
[14] G. R. Holland, “Morphological features of dentine and pulp related to dentine sensitivity,” Archives of Oral Biology, vol. 39, pp. 3s–11s, 1994.
[15] W. Grayson and J. Marshall, “Dentina: microestructura y caracterizacion,” Quitessence, vol. 8, pp. 160–170, 1995. [16] R. A. Pimenta, C. V. D. S. R. Penido, R. D. A. Cruz, and J.
B. Alves, “Morphology of the dentin on primary molars after the application of phosphoric acid under different conditions,” Brazilian Oral Research, vol. 24, no. 3, pp. 323–328, 2010. [17] M. B. Lopes, M. A. C. Sinhoreti, A. G. J´unior, S. Consani, and J. F.
McCabe, “Comparative study of tubular diameter and quantity for human and bovine dentin at different depths,” Brazilian Dental Journal, vol. 20, no. 4, pp. 279–283, 2009.
[18] C. R. Rao, “Diversity: its measurement, decomposition, appor-tionment and analysis,” Sankhy¯a: The Indian Journal of Statistics Series A, vol. 44, part 1, pp. 1–12, 1982.
[19] M.-A. Kahnamouei, N. Mohammadi, E.-J. Navimipour, and M. Shakerifar, “Push-out bond strength of quartz fibre posts to root canal dentin using total-etch and self-adhesive resin cements,” Medicina Oral, Patologia Oral y Cirugia Bucal, vol. 17, no. 2, pp. 337–344, 2012.
[20] G. lo Giudice, F. Lipari, A. Lizio, G. Cervino, and M. Cicci`u, “Indirect composite restorations in the posterior region—case reports,” International Journal of Clinical Dentistry, vol. 1, article 1, 2008.
[21] M. Ferrari, F. Mannocci, A. Vichi, M. C. Cagidiaco, and I. A. Mj¨or, “Bonding to root canal: structural characteristics of the substrate,” American Journal of Dentistry, vol. 13, no. 5, pp. 255– 260, 2000.
[22] L. Boschian Pest, G. Cavalli, P. Bertani, and M. Gagliani, “Adhesive post-endodontic restorations with fiber posts: push-out tests and SEM observations,” Dental Materials, vol. 18, no. 8, pp. 596–602, 2002.
[23] C. Goracci, F. T. Sadek, A. Fabianelli, F. R. Tay, and M. Ferrari, “Evaluation of the adhesion of fiber posts to intraradicular dentinp,” Operative Dentistry, vol. 30, no. 5, pp. 627–635, 2005. [24] J. Perdig˜ao, S. Geraldeli, and I. K. Lee, “Push-out bond strengths
of tooth-colored posts bonded with different adhesive systems,” American Journal of Dentistry, vol. 17, no. 6, pp. 422–426, 2004. [25] R. M. Foxton, M. Nakajima, J. Tagami, and H. Miura, “Adhesion to root canal dentine using one and two-step adhesives with dual-cure composite core materials,” Journal of Oral Rehabili-tation, vol. 32, no. 2, pp. 97–104, 2005.
[26] C. Goracci, A. U. Tavares, A. Fabianelli et al., “The adhesion between fiber posts and root canal walls: comparison between microtensile and push-out bond strength measurements,” Euro-pean Journal of Oral Sciences, vol. 112, no. 4, pp. 353–361, 2004. [27] B. H. Kivanc¸, H. D. Arisu, M. B. ¨Uc¸tas¸li, and T. C. Okay, “The effect of different adhesive system applications on push-out bond strengths of glass fiber posts,” Journal of Advanced Prosthodontics, vol. 5, no. 3, pp. 305–311, 2013.
[28] K. Bitter, H. Meyer-Lueckel, K. Priehn, J. P. Kanjuparambil, K. Neumann, and A. M. Kielbassa, “Effects of luting agent and thermocycling on bond strengths to root canal dentine,” International Endodontic Journal, vol. 39, no. 10, pp. 809–818, 2006.
[29] L. Muniz and P. Mathias, “The influence of sodium hypochlorite and root canal sealers on post retention in different dentin regions,” Operative Dentistry, vol. 30, no. 4, pp. 533–539, 2005. [30] B. A. Gaston, L. A. West, F. R. Liewehr, C. Fernandes, and D. H.
Pashley, “Evaluation of regional bond strength of resin cement to endodontic surfaces,” Journal of Endodontics, vol. 27, pp. 321– 324, 2001.
[31] M.-A. Kahnamouei, N. Mohammadi, E.-J. Navimipour, and M. Shakerifar, “Push-out bond strength of quartz fibre posts to root canal dentin using total-etch and self-adhesive resin cements,” Medicina Oral, Patologia Oral y Cirugia Bucal, vol. 17, no. 2, pp. e337–e344, 2012.
[32] F. Bleicher, “Odontoblast physiology,” Experimental Cell Research, vol. 325, no. 2, pp. 65–71, 2014.
[33] L. Bjørndal and A. Thylstrup, “A comparative histologic study of the pulp-dentinal interface in undemineralized and demineral-ized tooth sections,” Acta Odontologica Scandinavica, vol. 52, no. 4, pp. 198–202, 1994.
[34] M. T. Mamaladze and M. G. Ustiashvili, “Theoretical and prac-tical principles of dentinogenesis: hypotheses and confirmed clinically reality,” Georgian Medical News, vol. 186, pp. 22–28, 2010.
[35] W. H. Arnold, S. Konopka, and P. Gaengler, “Qualitative and quantitative assessment of intratubular dentin formation in human natural carious lesions,” Calcified Tissue International, vol. 69, no. 5, pp. 268–273, 2001.