The Rockefeller University Press $30.00
Introduction
In vitro studies have shown that cells become more prone to
col-lective migration when they are confined onto micropatterned
surfaces (Vedula et al., 2012; Doxzen et al., 2013; Leong et
al., 2013; Londono et al., 2014; Marel et al., 2014). To
inves-tigate the potential in vivo relevance of this effect, we studied
the collective migration of neural crest cells (NCCs), a
mesen-chymal embryonic cell population whose migratory behavior
has been likened to cancer metastasis. NCCs delaminate from
the neural tube and migrate large distances in distinct streams
as a loosely connected cluster of mesenchymal cells to reach
a target area, where they differentiate further. Previous studies
of NCC migration identified two essential mechanisms:
coat-traction (CoA) and contact inhibition of locomotion (CIL;
Car-mona-Fontaine et al., 2008, 2011; Woods et al., 2014). CoA is
the autocrine chemotaxis of NCCs toward the self-secreted and
diffusible complement component C3a (Carmona-Fontaine et
al., 2011). CIL, on the other hand, is the process whereby
col-liding cells make contact, repolarize away from one another,
and eventually separate. High cell density has been identified
previously in epithelial cells as a key requirement for
confine-ment to enhance collective migration (Doxzen et al., 2013;
Leong et al., 2013; Londono et al., 2014). However, NCCs
exhibit CIL only with other NCCs and not with the surrounding
tissues (Carmona-Fontaine et al., 2008, 2011); therefore, they
migrate into a region with essentially low cell density.
Conse-quently, the prediction of in vitro studies does not necessarily
hold true for NCCs. Despite the detailed studies of CIL and
CoA, the role of confinement during in vivo NCC migration has
not yet been established.
To experimentally test the hypothesis that NCC migration
in vivo is enhanced by spatial confinement, the confining factor
needs to be identified. Such a factor is likely to be present in
the microenvironment of the NCCs and is expected to restrict
migration without affecting cellular motility. Thus the
hypoth-esis predicts a contradictory role for such a factor acting as an
inhibitor of migration to form exclusionary boundaries and, at
the same time, required for collective migration of NCCs.
Stud-ies in amphibian, avian, and mouse embryos have demonstrated
a crucial role for extracellular matrix molecules in controlling
NCC migration and in particular the chondroitin sulfate
pro-teoglycan versican (Newgreen et al., 1982; Perris and
Johans-son, 1987, 1990; Perris et al., 1996; Pettway et al., 1996; Kerr
and Newgreen, 1997; Perris and Perissinotto, 2000). Studies in
mouse and amphibia suggest that versican is expressed in tissues
surrounding the neural crest (NC; Casini et al., 2008; Dutt et al.,
2011). The role of versican has been controversial, with studies
Collective cell migration is fundamental throughout development and in many diseases. Spatial confinement using
mi-cropatterns has been shown to promote collective cell migration in vitro, but its effect in vivo remains unclear. Combining
computational and experimental approaches, we show that the in vivo collective migration of neural crest cells (NCCs)
depends on such confinement. We demonstrate that confinement may be imposed by the spatiotemporal distribution of
a nonpermissive substrate provided by versican, an extracellular matrix molecule previously proposed to have
contrast-ing roles: barrier or promoter of NCC migration. We resolve the controversy by demonstratcontrast-ing that versican works as
an inhibitor of NCC migration and also acts as a guiding cue by forming exclusionary boundaries. Our model predicts
an optimal number of cells in a given confinement width to allow for directional migration. This optimum coincides with
the width of neural crest migratory streams analyzed across different species, proposing an explanation for the highly
conserved nature of NCC streams during development.
In vivo confinement promotes collective migration of
neural crest cells
András Szabó,
1* Manuela Melchionda,
1* Giancarlo Nastasi,
2Mae L. Woods,
1Salvatore Campo,
2Roberto Perris,
3and Roberto Mayor
11Department of Cell and Developmental Biology, University College London, London WC1E 6BT, England, UK
2Department of Biochemical and Dental Sciences and Morphofunctional Images, School of Medicine, University of Messina, 98122 Messina, Italy
3Center for Molecular and Translational Oncology, University of Parma, 43121 Parma, Italy
© 2016 Szabó et al. This article is distributed under the terms of an Attribution– Noncommercial–Share Alike–No Mirror Sites license for the first six months after the publication date (see http ://www .rupress .org /terms). After six months it is available under a Creative Commons License (Attribution–Noncommercial–Share Alike 3.0 Unported license, as described at http ://creativecommons .org /licenses /by -nc -sa /3 .0 /).
*A. Szabó and M. Melchionda contributed equally to this paper. Correspondence to Roberto Mayor: [email protected]
Abbreviations used in this paper: CIL, contact inhibition of locomotion; CoA, coattraction; CoMo, control morpholino oligonucleotide; CPM, cellular Potts model; DEM, discreet element method; ISH, in situ hybridization; MO, mor-pholino oligonucleotide; NAM, normal amphibian medium; NC, neural crest; NCC, neural crest cell; PB, phosphate buffer.
THE
JOURNAL
OF
CELL
BIOLOGY
on February 28, 2017
Downloaded from
/content/suppl/2016/06/06/jcb.201602083.DC4.html /content/suppl/2016/06/06/jcb.201602083.DC2.html /content/suppl/2016/05/23/jcb.201602083.DC1.html Supplemental Material can be found at:describing it as either a positive or negative regulator of NCC
migration (Landolt et al., 1995; Perissionotto et al., 2000; Dutt
et al., 2006, 2011; Casini et al., 2008). Isolated amphibian and
avian NCCs are unable to migrate onto a purified versican
sub-strate in vitro (Perris et al., 1991, 1996; Perris and Perissinotto,
2000) and are unable to migrate onto the versican-rich
loca-tions in avian and mouse embryos (Perris et al., 1991; Landolt
et al., 1995; Henderson et al., 1997; Perris and Perissinotto,
2000; Dutt et al., 2006). Paradoxically, experiments in avian
and amphibian embryos indicate that versican acts as a guiding
cue for NCC migration (Perris et al., 1990; Stigson et al., 1997;
Perissinotto et al., 2000) and, consequently, the precise role of
versican remains controversial. One major obstacle in resolving
this disagreement is the lack of versican loss-of-function
exper-iments because of the lethality of the versican-null hdf (heart
defect) mouse mutant, with embryos dying before a possible
assessment for NC development (Mjaatvedt et al., 1998;
Wil-liams et al., 2005). Nonetheless, these apparently contradictory
studies that suggest positive and negative activities of versican
on NC migration make versican an ideal candidate molecule for
confining NCCs during their movement through the embryo.
Using Xenopus laevis embryos, we show that
confine-ment in vivo may be imposed by the spatiotemporal
distribu-tion of versican and support our predicdistribu-tion via loss-of-funcdistribu-tion
experiments. We show a quantitative agreement between the
effect predicted by computational modeling and our
observa-tions in vivo, and we predict an optimal confinement width
for a given population size of migrating NCCs that coincides
with the width–size relationship of various NC streams in
both Xenopus and zebrafish.
Results and discussion
Versican forms an inhibitory boundary around NC streams
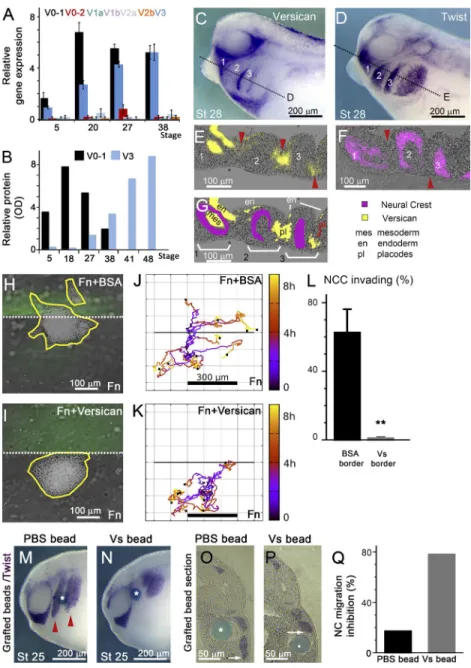
We performed the first comprehensive mapping of versican
expression during the early stages of Xenopus development
and analyzed several of its alternatively spliced variants using
a combination of quantitative PCR (qPCR) and Western
im-munoblotting of all eight currently known isoforms. By using
exon-spanning primers for all versican variants, we found that
versican V0-1 expression peaks around stage 20 (midneurula;
Fig. 1 A, black bar), which coincides with the initiation of NCC
migration (Mayor et al., 1995). Although some expression of
V3 mRNA is also detected around stage 20, transcription of
this isoform continues rising well beyond stage 27, when NCC
migration ends (Fig. 1 A, blue bar). All other variants (V0–2,
V1a, V1b, V2a, and V2b) remained undetectable, or expressed
at very low levels, throughout development (Figs. 1 A and S1
A). Importantly, these observations were confirmed by
West-ern blotting of Xenopus whole-embryo lysates, showing that at
NC migratory stages V0–1 is the predominant versican form
(Fig. 1 B). Based on these findings, we focused on isoform V0-1
throughout this study.
To ascertain whether versican is localized within the
tissues surrounding the migrating NC, we analyzed the
versi-can mRNA distribution during NC migration and compared it
with the NCC marker Twist and the placode markers Eya1 and
FoxI1C
(David et al., 2001; Pohl et al., 2002). Our results
in-dicate that versican is not expressed by the NCCs themselves
but is present in the adjacent tissues, including the placodal
ectoderm, pharyngeal mesoderm, and pharyngeal endoderm
(Fig. 1, C–G; and Fig. S1, B–D). These findings confirm that
versican is present around the NCCs, consistent with previous
observations in chicken and mouse embryos (Henderson et al.,
1997; Perissinotto et al., 2000), and is not expressed by the
mi-grating cranial NCCs themselves.
Next, to assess whether versican could impede movement
of cephalic NCCs, we first cultured NC explants on a dual
sub-strate composed of an area containing only fibronectin and
an-other containing fibronectin together with either BSA (control)
or 0.6
μg/ml of purified versican (Fig. 1, H and I). NC explants
plated onto the control substrate were able to move across the
border between the two areas (Fig. 1 J). However, explants
cul-tured on the dual fibronectin–versican substrate failed to invade
the versican-positive region even at versican concentrations
as low as 0.3 µg/ml (Fig. 1, K and L). The majority (80%) of
the clusters touching the versican border leave the border and
return to the fibronectin region, making it unlikely that
versi-can would act as either a haptotactic attractant or a
chemoat-tractant. To test the effect of ectopic versican in vivo, acrylic
beads soaked with versican were grafted into the NC migratory
pathways and the percentage of embryos exhibiting abnormal
NC migration was assessed. In accordance with the in vitro
assay, versican-soaked beads inhibited NCC migration locally,
whereas control PBS beads did not affect NC migration (Fig. 1,
M–Q). These observations corroborate the nonpermissive
na-ture of versican as a migratory substrate both in vitro and in
vivo and further show that versican forms a restrictive boundary
around the migrating NC.
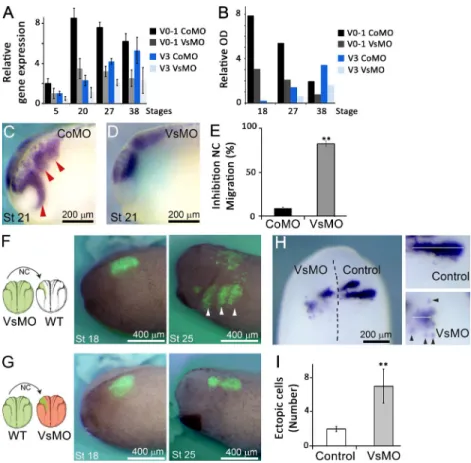
Loss of versican in vivo leads to altered NC migration
To experimentally test the hypothesis that removing the
con-finement would compromise the collective migration of NCCs,
we used versican-directed morpholino oligonucleotides (MOs)
designed to block splicing or translation of all versican
iso-forms (as described in Materials and methods), including the
isoforms found to be expressed during NCC migration as
as-sayed by qPCR (Fig. 2 A) and Western blot (Figs. 2 B and S2
A). Three different MOs targeting V0–1 were used, and because
all of them generated similar phenotypes, we show the result
of only one MO, hereafter referred to as VsMO (see Materials
and methods). Assessment of NCC migration at stage 21 in
em-bryos that received either injection of a control MO (CoMO) or
VsMO revealed that knockdown of versican resulted in a strong
inhibition of NCC migration (Fig. 2, C–E). This effect persisted
in late migratory stages (27), when a more disorganized
distri-bution of NC was observed (Fig. S2, B–E). In later stages, NC
derivatives were affected by VsMO injection, as shown by the
reduced number of melanocytes or abnormal cartilage
forma-tion (Fig. S2, F–H). It is well established that NC migraforma-tion
requires repulsive and attractive cell interactions, such as CIL
and CoA, respectively (Carmona-Fontaine et al., 2008, 2011).
Importantly, inhibition of versican with VsMO did not affect
CIL and CoA (Fig. S2, I–L). The specificity of the MO was
demonstrated by rescue experiments using localized delivery of
the versican protein (Fig. S2, N and O).
To demonstrate that versican is required only in tissues
surrounding the NC, we performed a series of grafting
exper-iments (Fig. 2, F and G). When NCCs from embryos injected
with VsMO were grafted into wild-type embryos, we observed
normal NC migration along the three major pathways (Fig. 2 F).
on February 28, 2017
Conversely, when wild-type NC was grafted into VsMO-treated
hosts, a clear inhibition of migration was observed (Figs. 2 G
and S2 M), indicating that versican is required in the tissues
surrounding the NCCs and not in the NCCs themselves for
mi-gration to occur. Consequently, our hypothesis suggests that
versican forms boundaries between the streams and that its
re-moval of versican might lead to intermingling of NCCs between
neighboring streams. To verify whether this was the case, we
as-sessed Krox-20 expression, as it is known to only be present in
alternate streams. Control embryos showed a sharp NC stream
emanating from rhombomere 5, whereas in VsMO-injected
em-bryos the streams appeared less advanced, with several cells
mi-grating ectopically into areas of the neighboring stream (Fig. 2,
H and I). These observations suggest that versican is required
for confinement and that confinement is necessary for efficient
collective migration of NCCs.
Confinement enhances directional collective NCC migration in silico
To test the hypothesis that NCC migration is enhanced by
spa-tial confinement, we apply a computational approach. Although
computational models have been previously proposed to
ex-plain NC migration, they have not tested the role of spatial
confinement (Carmona-Fontaine et al., 2011; Woods et al.,
2014; Szabó and Mayor, 2016). One of these models allows
cell overlap and arbitrarily high densities (Carmona-Fontaine
et al., 2011), which makes it less suitable to explore the effect
of confinement. A second model, based on the discreet element
method (DEM), overcomes this limitation by representing cells
as spheres with a core repulsion defined through contact
me-chanics (Woods et al., 2014). In this latter model, cell
move-ment is governed by second-order dynamics that allows for
frictionless gliding of cell clusters, an assumption that could
potentially introduce unexpected modeling artifacts when
test-ing the role of confinement.
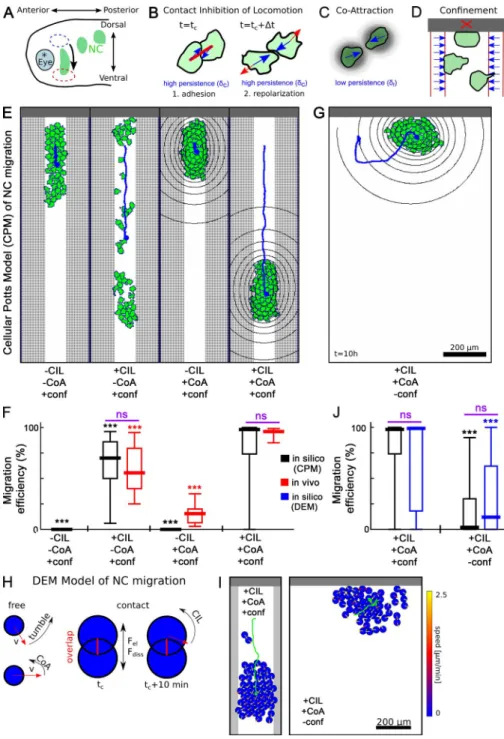
To avoid the limitations of these models and to test whether
confinement promotes collective migration of NCCs, we present
a new model based on the cellular Potts model (CPM)
frame-work (Graner and Glazier, 1992; Fig. 3, A–D). This frameframe-work
has been widely and successfully applied for studying the effect
of confinement on cell migration (Vedula et al., 2012; Doxzen et
al., 2013; Londono et al., 2014) but is not specific to epithelia,
Figure 1. Versican V0–1 forms a delimiting bound-ary around migrating NCCs. (A) qPCR of versican isoforms. Bars, mean; error, SEM. (B) Western blot of V0–1 and V3 isoforms. (C–G) Embryos showing ex-pression of versican (C) and the NC marker Twist (D) using whole-mount in situ hybridization (ISH), and cor-responding sections (E and F), with a scheme summa-rizing the sections (G). Sections on E and F have been enhanced by blurring and squaring the separated ISH signals and overlaid in pseudo-color on the section background. (H–L) NCC explants cultured on fibronec-tin (Fn) + BSA or Fn + versican barriers invade the bar-rier area only in absence of versican. (J and K) In vitro cluster trajectories with barrier boundary marked as solid line; n = 10; color: time. (L) Percentage of cells invading the barrier (n = 3 independent experiments with n = 251 and n = 336 explants in total for BSA and versican, respectively). Bars, mean; error, SEM. (M–Q) ISH for Twist of embryos grafted with PBS (M) or versican-soaked beads (N), with the corresponding sections (O and P), and inhibition of NC migration (Q; mean inhibition, PBS: n = 5/29, versican: n = 25/32 embryos). Arrowheads show migrating NCC and as-terisks indicate grafted bead. **, P < 0.01.
on February 28, 2017
as shown by its use in modeling cancer metastasis (Turner and
Sherratt, 2002; Rubenstein and Kaufman, 2008; and many others
reviewed in Szabó and Merks, 2013), T cell trafficking
(Belt-man et al., 2007; Vroo(Belt-mans et al., 2012), swarming of bacteria
(Jorn et al., 2007), vasculogenesis (Merks et al., 2006; Szabó
et al., 2008; Shirinifard et al., 2009), and even dictyostelium
movement (Marée et al., 1999). In brief, cells in the model
are represented as connected domains on a 2D lattice with a
preferential migration direction (polarity) that sets the cell’s
movement persistence (Szabó et al., 2010). To implement CIL,
colliding cells form a cell–cell adhesion contact and they
grad-ually repolarize away from one another to eventgrad-ually separate
(Fig. 3 B). In agreement with previous experimental
observa-tions (Theveneau et al., 2010), migratory persistence of cells
is increased during contact (Fig. S3 A). This implementation
leads to a distribution of contact durations and separation angles
(Fig. S3, B and C) similar to those observed experimentally
(Woods et al., 2014). To implement CoA, cells secrete a
diffus-ing and decaydiffus-ing chemoattractant, which is sensed by the other
cells (Fig. 3 C). CoA acts to prevent dispersion of the cluster
in a size-dependent manner (Fig. S3, D and E). In simulations
of confinement, lateral restriction is achieved through a
local-ized band of directed force-field acting on the cells, whereas
dorsal confinement is implemented by strict exclusion of cells
(Fig. 3 D). For more detail on the implementation and
parame-ters, see Materials and methods.
Simulations of the CPM show that a cluster of cells
is able to migrate without dispersion and that both CIL and
CoA are required for this movement (Fig. 3 E and Video 1).
Migration efficiencies, i.e., the percentage of cells migrating
ventrally an arbitrary distance of 150 µm within a 3-h period,
were calculated from the simulations for the different
condi-tions (Fig. 3 F, black bars). To compare with in vivo migration,
equivalent measurements were performed in embryos with
fluorescently labeled NC. CoA was inhibited by depleting
C3aR (Carmona-Fontaine et al., 2011), whereas CIL was
in-hibited by expressing Dsh
−Dep+, a dominant-negative
vari-ant of the PCP signaling pathway (De Calisto et al., 2005;
Carmona-Fontaine et al., 2008). Similar migration efficiency
was found in most conditions between simulated and in vivo
migrating cells (Fig. 3 F, compare black and red bars). Cells
without CIL (
−CIL+CoA) exhibited similar although slightly
higher migration efficiency in vivo than in silico, which could
result from the incomplete inhibition of CIL in experiments or
from chemotaxis induced by the chemoattractant Sdf1 present
in the environment. Clusters of +CIL
−CoA cells seemingly
migrate efficiently, also supported by the large mean cell
dis-placement over 3 h (Fig. S3 F); however, this movement
re-sembles an enhanced diffusion process (Fig. S3 G; note high
dispersion), similar to experimental observations (McLennan
et al., 2010; Theveneau et al., 2010; Carmona-Fontaine et al.,
2011). These results show that our model based on the CPM
is able to reproduce the main aspects of NCC migration,
con-firming the requirement of CIL and CoA proposed in
previ-ous models. Removing lateral confinement in silico results
in less directional cluster movement, significantly reduced
migration efficiency and mean cell displacements (Fig. 3 G
and J, black bars; and Fig. S3 F). This observation is
con-firmed in simulations using our previously published DEM
implementation of NCC migration (Fig. 3, H–J, blue bars;
and Video 2). Importantly, this result shows that our
predic-tion is robust, as it does not depend on the particulars of one
kind of simulation framework. Together, our results suggest
that restrictive boundaries enhance the collective directional
movement of NCCs, and when these restrictions are lifted,
NC migration is compromised.
Figure 2. Versican is required for normal NC migra-tion. (A and B) qPCR (A) and Western blot (B) analysis of CoMO- and VsMO-injected embryos. (C–E) ISH of Twist in embryos injected with either CoMO (C) or VsMO (D), and inhibition of migration (E; C: n = 91, D: n = 135). (F and G) Graft experiments: VsMO + fluorescein-dextran (FDx)–injected NCC grafted into control host (F; 76% of migration, n = 17) or CoMO + FDx NCC grafted into VsMO-injected host (G; 13% of migration, n = 15). (H and I) ISH against Krox20, showing an uninjected versus VsMO-injected side of a stage 24 embryo (H, dorsal view; n = 53), and number of ectopic NCC (I; n = 51). Bars, mean; error, SEM. Arrowhead represents a migrating NC. **, P < 0.01.
on February 28, 2017
Static experimental data are insufficient to confirm this
model prediction and a dynamic analysis of NCC movements
is required.
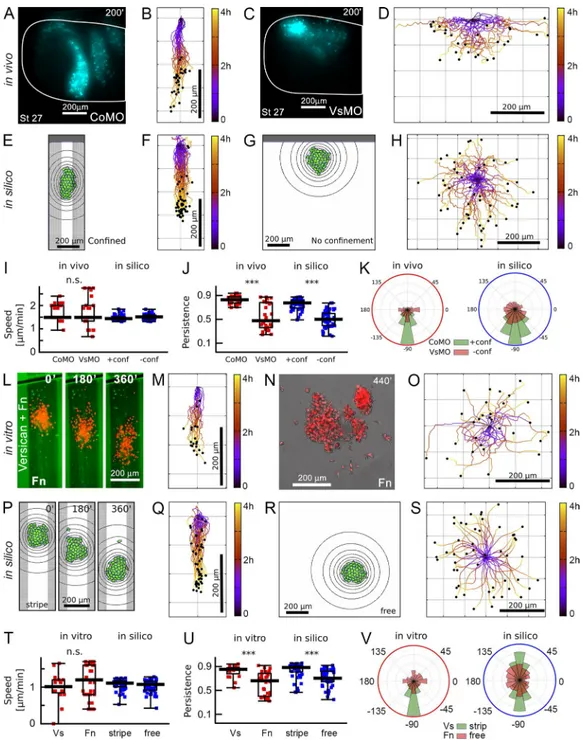
Versican confinement affects movement directionality but not cell motility
To quantify the effect of versican confinement on NCC
mo-tility, we analyzed the migratory trajectories of NCCs grafted
into CoMO or VsMO-treated host embryos (Fig. 4, A–D; and
Video 3) and the trajectories of simulated cells, with or
with-out lateral confinement (Fig. 4, E–H). Importantly, we found
that versican depletion in vivo did not affect the ability of cells
to move, as shown by the unaltered speed of migrating NCCs
(Fig. 4 I), and cell division was also not affected (3 ± 0.5 × 10
−7divisions per square micrometer per minute in both CoMO-
and VsMO-injected embryos). However, persistence of cells is
significantly and similarly reduced both in vivo and in silico
(Fig. 4 J), which is also reflected in the distribution of the
mi-gratory directions (Fig. 4 K). These results show that versican
enhances directional migration by confining the NCCs in vivo,
and the similarity of the analyzed motility parameters in vivo
and in silico provide a quantitative confirmation of our
compu-tational model prediction.
To next test whether the observed effect results from
the complex environment of the embryo, for example by a
self-generated gradient through sequestration of a chemokine
as observed during zebrafish lateral line primordial cell
migra-tion (Donà et al., 2013), we challenged our model in vitro. We
used a previously described “stripe assay” paradigm to mimic
in vivo patterns of NCC migration along versican-delineated
paths. Accordingly, cultured NC clusters were tracked for 3 h
on fibronectin stripes in the presence or absence of versican
Figure 3. Computational model of NC mi-gration. (A) Schematic embryo during NCC migration in the Xenopus head. (B–D) Cell in-teractions in the CPM: CIL (B), CoA (C), and dorsal and lateral confinements (D). (E) CPM configurations for versions of NC migration in constrained geometries with and without CIL and CoA. (F and J) Migration efficiencies. Error bars: min-max values, boxes: quartiles; central value: median; n = 50 simulations. Signifi-cance compared with relevant control, where significance bars (purple) compare data from the same conditions. (G) CPM configuration in unconstrained geometry. (H) Rules of the DEM model of NCC migration. (I) Configuration of the DEM model with and without confinement. ***, P < 0.001; ns, not significant.
on February 28, 2017
borders (Fig. 4, L–O; and Video 4). In parallel, movement of
clusters was simulated in silico with or without confinement
as in the stripe assays (Fig. 4, P–S). Absence of confinement
did not have major effects on cluster speed but significantly
re-duced the persistence of clusters in vitro, as determined in silico
(Fig. 4, T and U). Confined clusters in silico initiated movement
in both directions (dorsal: 23/50, ventral: 27/50; Fig. 4 V; tracks
are aligned on Fig. 4, M and Q) and otherwise behaved as the
clusters with dorsal confinement. This suggests that the dorsal
barrier representing the neural tube in simulations serves only
the purpose to determine the initial direction for migration. This
is consistent with experimental observations indicating that
NCCs grafted into the middle of an already formed NC stream
are able to move both ventrally and dorsally (Erickson, 1985).
Although several additional factors are expected to influence
the NCCs in vivo, our results on cultured NCCs suggest that the
confining effect of versican is sufficient to account for the
phe-notypic change observed by versican loss of function in vivo.
We conclude so far that restrictive boundaries are required for
the enhancement of NCC migration.
Figure 4. Confinement by versican enhances collective NC migration. (A–D) Lateral view of stage 27 embryos of wild-type NC (nuclear-GFP in cyan) trans-planted into a CoMO-injected (A, n = 21) or VsMO-injected host (C, n = 24; Video 3), with cell trajectories (B and D). (E–H) In silico cell migration with and without confinement with cell trajectories (n = 50). (I–K) Comparison of cell speed, persistence, and direction of migration in vivo and in silico. (L–O) NC cluster migration in vitro. Frames of time-lapse movie of control NC cluster in versican confinement (L, green: versican, red: NC nuclei; n = 20) or without confinement (N; Video 2, n = 25) and cluster trajectories (M and O). (P–S) Simulations imitating the in vitro geometries (n = 50). (T–V) Comparison of cluster speed, persistence, and direction of migration in vitro and in silico. Error bars, min–max, boxes: quartiles; bar, median. ***, P < 0.001; ns, not significant.
on February 28, 2017
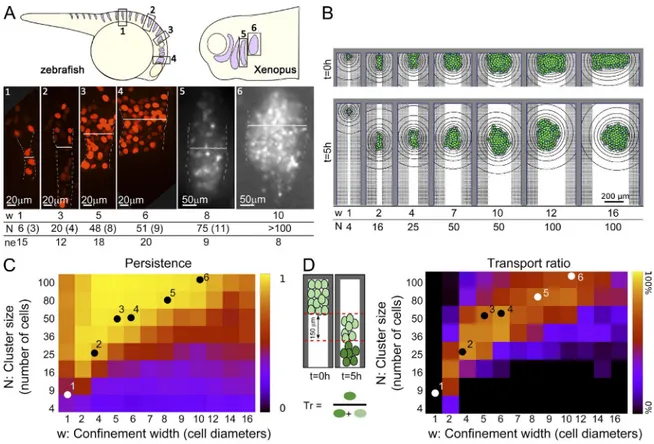
Confinement width and cluster size
determine the efficiency of NCC migration
Although migration in streams is conserved across species, a
large variability exists in the width of the streams and the
num-ber of cells migrating in the stream (size). Width and size are
nevertheless stereotypic for each stream. We quantified these in
streams along the anterior posterior axis of zebrafish and
Xen-opus
embryos using time-lapse imaging and found that streams
containing more cells migrate in wider streams (Fig. 5 A).
Next, we used our model to ask whether the width of the
confinement influences the migration. We simulated NCC
clus-ters of different sizes (n = 4, 9, 16, 25, 36, 50, 80, and 100 cells)
in various confinement widths (w = 1-, 2-, 4-, 5-, 6-, 7-, 8-,
9-, 10-, 12-, 14-, and 16-cell diameters; selected configurations
shown in Fig. 5 B and Video 5). Clusters migrate persistently
in a range of confinement widths, which is determined by the
number of cells in the cluster (Fig. 5 C). Importantly, we found
that for a given number of cells, persistence increased with the
stream width up to a point and decreased in wider streams,
indi-cating an optimal stream width for that cell number. To compare
with our in vivo observations, we assume that the stream width
observed in vivo is indicative of confinement width. Our
mea-surements show that the confinement width and cluster size in
vivo are close to the optimal persistence predicted by the model
(Fig. 5 C, dots indicate in vivo data). The small discrepancy
be-tween the predicted persistence optimum and the experimental
data is likely explained by the fact that confinement also limits
the number of NCCs that can be transported in a given time.
We quantified the proportion of NCCs in a cluster that enters a
target area 150 µm ventral from the initial ventral edge of the
cluster in a 5-h time interval (for transport ratio, see Fig. 5 D).
We found a remarkable coincidence between the predicted
optimum transport ratio and the number of cells in streams of
different width (Fig. 5 D, dots indicate in vivo data). This
opti-mum is also consistent with the stream widths and cell numbers
in avian embryos as previously published (Kulesa and Fraser,
1998). Furthermore, a reduction in NC migration efficiency was
observed in streams where the number of NCCs was reduced by
ablation (Kulesa et al., 2000).
Altogether, our model predicts an optimal confinement
width for a given cluster size. This suggests that during
evolu-tion, the number of migrating NCCs have been optimized
de-pending on the stream width, and it is tempting to speculate that
this mechanism is conserved across species.
Overall, our results show that the width of confinement
within the embryo is not independent of the size of the
migrat-ing cluster. How this coordination is established remains to be
uncovered. One possibility is genetic hard-wiring, whereby
confinement width and the number of differentiating NCCs are
genetically encoded in the developmental program of embryos.
Another possible explanation is a dynamic emergence of
con-finement based on local cell interactions, such as the “chase and
run” phenomenon, whereby the NCCs move by chemotaxis
to-ward the surrounding cells that express the confinement
mole-cules, and these cells actively move away from the NCCs upon
contact (Theveneau et al., 2013). The chase and run mechanism
Figure 5. Effect of confinement width and cluster size. (A) Schematic illustration and examples of maximal projection of a Z-confocal stack used to measure the number of cells in NC streams of different widths. White line illustrates how the stream width was measured. Width (W) and number of cells (N) are shown at the bottom, with SD in parentheses; ne, number of embryos analyzed. (B) Snapshots of simulations with increasing confinement widths (w, cell di-ameters) and cluster size (N, number of cells). (C and D) Cluster persistences and transport ratio (percentage of cells in the cluster migrating at least 150 µm away from the cluster’s edge in 5 h). Heatmaps represent median values from n = 50 simulations. Dots show experimental values for NCs migrating in vivo in zebrafish and Xenopus embryos. Numbers on dots correspond to the same numbers shown in A.
on February 28, 2017
has been demonstrated to operate between NC and placodal
cells and, as demonstrated here, placodes express versican,
suggesting that this interaction could lead to a dynamic
estab-lishment of confinement. When NCC migration is impaired by
VsMO, placodes remain disorganized (Fig. S2 P), similar to
what has been shown in the case of NC ablation (Theveneau
et al., 2013). The dramatic effect caused by knocking down
only a single inhibitory molecule suggests that versican may
also play a direct or indirect role in the organization of cells
ex-pressing any other repellent molecules adjacent to the NC, such
as Ephrin/Eph receptor, Slit/Robo, or semaphorin (Kawasaki et
al., 2002; Baker and Antin, 2003; De Bellard et al., 2003; Jia et
al., 2005; Mellott and Burke, 2008; Roffers-Agarwal and
Gam-mill, 2009; Schwarz et al., 2009; Theveneau and Mayor, 2012).
In conclusion, our data demonstrate for the first time the
relevance of geometrical confinement on collective cell
migra-tion in vivo and identify a candidate molecular mechanism for
this phenomenon during embryogenesis. Indeed, we provide
ev-idence that migration of the NC depends on such confinement,
and we identify the confining molecule, versican, that acts as a
nonpermissive substrate for the NCCs. Our results shed light on
a new fundamental mechanism governing NCC migration and
contribute to a better understanding of the evolutionarily
con-served nature of stream formation during NC migration.
Materials and methods
RNA isolation, cDNA synthesis, and qPCR amplification
Total RNA was isolated from wild-type and versican-knockdown
Xen-opus embryos at different stages of development (stages 5, 18, 27, and
38) for real-time reverse-PCR analysis of versican variants V0–1, V0–2, V1a, V1b, V1c, V2a, V2b, and V3 by using the Omnizol Reagent kit (Euroclone). The first strand of cDNA was synthesized from 1.0 µg total RNA using a high-capacity cDNA Archive kit (Applied Biosystems). β-Actin mRNA was used as an endogenous control to allow the relative quantification of versican and its splicing isoforms. Primers and probes for real-time PCR were designed and supplied by Applied Biosystems.
All probes were labeled with 5′-FAM reporter dye and 3′Black Hole
Quencher1 (Table 1). Real-time PCR reactions were performed in trip-licate and in monoplex on the model 7500 RT-PCR real-time system (Applied Biosystems) using the TaqMan Universal PCR Mastermix kit (Applied Biosystems) as suggested by the manufacturer. The ampli-fied PCR products were quantiampli-fied by measuring the calculated cycle
thresholds of V0–1, V0–2, V1a, V1b, V1c, V2a, V2b, V3, and β-actin
mRNA. The amounts of specific mRNA in samples were calculated by the DDCT (Delta-Delta-Ct) method. The values of the V0–1 gene expression level of the versican wild-type and knockdown embryos at stage 5 were used as a calibrator, and results are expressed as the n-fold difference relative to these values (relative expression levels). Western blotting
For SDS-PAGE and Western blotting, wild-type and versican-knock-down embryos at different stages of development (considered stages: 5, 18, 27, 38, 41, and 45) were washed twice in ice-cold PBS and subse-quently dissolved in SDS sample buffer (62.5 mM Tris-HCl, pH 6.8, 2% wt/vol SDS, 10% glycerol, 50 mM DTT, and 0.01% wt/vol bromophe-nol blue). Aliquots of whole-cell protein extract (10–25 µl/well) were separated by gradient 3–10% gel electrophoresis. The proteins were blotted onto polyvinylidene difluoride membranes (GE Healthcare) using a semidry apparatus (Bio-Rad Laboratories). The membranes were then incubated overnight in a roller bottle with the specific diluted
(1:1,000) primary antibody that recognizes all versican isoforms in 5% BSA, 1× PBS, and 0.1% Tween-20 at 4°C. After being washed in three stages in wash buffer (1× PBS and 0.1% Tween-20), the blots were incubated with the diluted (1:2,500) secondary polyclonal antibody (goat antirabbit conjugated with peroxidase), in TBS/Tween-20 buffer, containing 5% nonfat dried milk. After 45 min of gentle shaking, the blots were washed five times in wash buffer, stained with DAB liquid substrate (Sigma-Aldrich), and subjected to densitometric analyses. Morpholino oligo
One translational MO, coded VsATG MO (Gene Tools, Inc.) was
de-signed based on the sequence of Xenopus versican around the 5′ end
of the gene. The sequence of VsATG MO used was 5′-TCT TGA CCT
TTT AAG GTG ACC TAGT-3′. In addition, two splicing MOs, coded
VsMO1 and VsMO2 (Gene Tools, Inc.), were designed based upon the sequence of the G3 domain at the carboxyl terminus of the
Xeno-pus versican. The sequences of the MOs used were VsMO1 5′-AAG
TAA ATT TGG ATC TTA CCT TGCA-3′; VsMO2 5′-GGG TCT TGA
CCT GAA ATA AGA CATT-3′. A similar phenotype was achieved with
all MOs when 30 ng and 100 ng of the VsMO1/2 and VsATG MO were injected per embryo, respectively. As all the MOs produced a similar phenotype, we mainly used VsMO2. A standard CoMO with
sequence 5′-CCT CTT ACC TCA GTT ACA ATT TATA-3′ was used.
Injection of 30 ng of this CoMO into wild-type Xenopus embryos had no effect. All oligos were dissolved to 8 µg/µl in nuclease-free water and stored at RT. The efficiency of the morpholinos to inhibit splicing was analyzed by performing real-time qPCR and Western blotting analyses. The specificity of the VsMOs was ascertained by rescuing experiments using localized versican protein. In brief, beads
Table 1. Primer and probe sequences
Target Primer and probe sequences
Versican V0-1 Forward: 5′-ACC ATA CCA ACA TTG CCA CC-3′
Reverse: 5′-TGA TAC TTC CAC TTT GGG CC-3′ Probe: 5′-6FAM-CCA CAG TTT TGG TGCC-3′BHQ1
Versican V0-2 Forward: 5′-GCT AGT TGA TGG ATG TCC AAC-3′
Reverse: 5′-AGG AAC TTG TCG AAT GAG AC-3′ Probe: 5′-6FAM-CTT CCC CGC CGA CTTC-3′BHQ1
Versican V1a Forward: 5′-GTC ATT GCC ATG TAC TACC-3′
Reverse: 5′-TTT GGA TCA GTG GAG TTT AGC-3′ Probe: 5′-6FAM-ACT TCA CTG CGG AGG TC-3′BHQ1
Versican V1b Forward: 5′-AGA TCG ATG TGG GTG AAA TC-3′
Reverse: 5′-TGA GAA GTG TCT TTG AGT CC-3′ Probe: 5′-6FAM-CAG GCT TTG TCC AGGC-3′BHQ1
Versican V1c Forward: 5′-GGA ATT TCG CAA CCA TAG CG-3′
Reverse: 5′-CCC AAA GCC AAA TTA CGT GC-3′ Probe: 5′-6FAM-GAC GGT CAA TAT CCA TCC-3′BHQ1
Versican V2a Forward: 5′-GGT GAA TTC CGT TGA ATC CG-3′
Reverse: 5′-ATT CCG GCC GTT ACG CAT AA-3′ Probe: 5′-6FAM-CAC GAT CCC TGC ATTC-3′BHQ1
Versican V2b Forward: 5′-TTG GCT AGG GAA TAC GGG AT-3′
Reverse: 5′-CCC GAA TTC ATA CCG TGA ATT-3′ Probe: 5′-6FAM-GAA CAC TGG GAT AGCG-3′BHQ1
Versican V3 Forward: 5′-TTA AGA AGA GGG CAC CTT GG-3′
Reverse: 5′-AGG AGT GGA CAG TTT CCC AA-3′ Probe: 5′-6FAM-GCA CAG TAA TGC TGCG-3′BHQ1
β-Actin Forward: 5′-GCT TCT CTT CCA GCC ATCG-3′
Reverse: 5′-GAC AGC ACA GTG TTG GCA TA-3′ Probe: 5′-6FAM-TCG GTA TGG AGT CCT GC-3′BHQ1
BHQ1, Black Hole Quencher1.
on February 28, 2017
soaked with versican protein were grafted next to the prospective streams in embryos previously injected with VsMO, followed by analysis of NC migration.
Embryo manipulation and whole-mount in situ hybridization
Xenopus females were stimulated by hCG injections (1,000 U), and
embryos were in vitro fertilized using sperm macerated in 1× MMR
(100 mM NaCl, 2 mM KCl, 1 mM MgSO4, 2 mM CaCl2, 5 mM Hepes,
and 100 µM disodium-EDTA, pH 7.6). Embryos were dejellied in 2% L-cysteine solution to remove the jelly. Embryos were injected and left to recover overnight in normal amphibian medium (NAM) 3/8 with 3% Ficoll. Embryos were transferred and maintained in NAM 1/10 (Beck and Slack, 1999). Embryos were staged according to Nieu-wkoop and Faber (1967). Whole-mount in situ hybridization analysis was performed as described previously (Harland, 1991). The follow-ing probes were used: Eya1 (David et al., 2001), FoxI1C (Pohl et al., 2002), Slug (Mayor et al., 1995), Twist (Hopwood et al., 1989), and
Versican (Casini et al., 2008).
Preparation of embryos for cryosectioning
Wild-type or experimental embryos were fixed for 2 h in MEM FA at RT and rinsed three times with 1× PBS. Embryos were then washed
two times for 5 min in 0.1 M phosphate buffer (PB; 0.2 M NaH2
PO4*H2O and 0.2 M K2HPO4, pH 7.4) and incubated overnight at
4°C in 15% sucrose (Sigma-Aldrich) in 1× PB. A solution of 7.5% of type A gelatin from porcine skin (G9136; Sigma-Aldrich) and 15% sucrose in 1× PB was prepared by dissolving at 42°C until the solu-tion became transparent. The embryos were incubated in the gelatin solution at 42°C for at least 45 min. The bottom of a weighing boat was coated with a layer of gelatin and allowed to set. The samples were placed on the gelatin layer and the mold was filled with gelatin solution to entirely cover the samples. The embryos were oriented and blocks were cut to size under an MZ6 dissecting stereomicro-scope (Leica Biosystems). The blocks containing the embryos were
snap frozen using isopentane prechilled at −80°C. The samples were
sectioned using a CM-3050S cryostat (Leica Biosystems) to yield longitudinal sections of thickness between 30 to 40 µm. Sections were placed onto slides (VWR International) and air-dried overnight at RT. The gelatin was removed by incubating the slides in a water bath at 37°C in 1× PBS for 30 min. All sections were mounted on slides with MoWiol (EMD Millipore).
Sections of in situ hybridization (ISH) presented in Fig. 1 (D and E) and Fig. S1 (D and E) have been inverted and split to separate color channels. The green channel containing most of the ISH signal was contrast enhanced to remove any nonspecific background, blurred (ImageJ, Gaussian blur, 3-pixel radius), squared pixel by pixel (ImageJ, Image Calculator). The processed image was merged in pseudocolor with the blue channel of the inverted ISH image containing only back-ground. The final image was contrast enhanced.
Preparation of NCC cultures
The cephalic NCCs were explanted from stage 18/19 Xenopus em-bryos as previously described (Alfandari et al., 2003; DeSimone et al., 2005). In brief, using an eyebrow knife, the anterior epidermal layer near the neural tube was removed, exposing the NC tissue. The eye-brow knife was then used to gently detach the NC cluster from the surrounding tissues. Once isolated, the NC explant was transferred to a
dish containing 1× Danilchick’s solution (53 mM NaCl, 5 mM Na2CO3,
4.5 mM K-gluconate, 32 mM sodium-gluconate, 1 mM MgSO4, 1 mM
CaCl2, 0.1% BSA, and 50 µg/ml streptomycin, pH 8.3) and divided into
smaller clusters of NC cells, before transferring them to a Petri dish coated with fibronectin (Fn; Sigma-Aldrich).
In vivo bead grafting and NC transplantation assays
Affigel blue agarose beads (100–200 mesh; Bio-Rad Laboratories) were thoroughly washed in 1× PBS and incubated overnight at 4°C with either PBS or the versican V0/V1 protein. Versican V0/V1 pro-tein was used at a concentration of 11 µg/ml. Embryos were demem-braned and allowed to heal for 30 min in NAM 3/8. One single bead was grafted at stage 20 into the preplacodal field near the premigratory NC tissue. The embryos were allowed to heal for 30 min at RT before placing them at 14.5°C until they reached stage 28.
Wild-type, CoMO, or VsMO-injected NC, labeled with fluores-cein-dextran (Invitrogen) were explanted as outlined in Preparation of NCC cultures and transplanted into control or VsMO-injected host em-bryos immobilized in plasticine. The NC explant was held in place with a small glass coverslip for 45 min at RT until the embryos had healed. Once healed the embryos were kept in NAM 3/8 at 14.5°C until they reached stage 28. Experimental embryos from both assays were fixed
in 1× MEM FA (4% formaldehyde, 0.1 M MOPS, 1 mM MgSO4, and
2 mM EGTA) for 1 h at RT and processed for whole-mount in situ hy-bridization in the protocol previously described (Harland, 1991).
To count the number of cells in streams of different width, 3D confocal imaging was performed in TgSox10 :nucRFP /mGFP zebrafish embryos as previously described (Moore et al., 2013) and in Xenopus embryos in which the NCCs were labeled by grafting NC expressing nuclear GFP (Theveneau et al., 2013).
Confrontation and stripe assays
In vitro analysis of NC migration was performed using wild-type NC explants cultured on Fn alone or Fn and versican V0/V1 protein–coated plates. Versican V0/V1 protein coating was performed by incubating 50 × 9–mm plastic Petri dishes at 37°C with a versican/PBS solution at 0.7 µg/ml, mixed with fluorescein-dextran for 1 h, and washed with PBS. Once the dish was coated with versican, two separate assays were prepared. For the confrontational assay, half the versican coating was removed, and the plate was reincubated with 10 µg/ml Fn for 1 h and washed with PBS. For the stripe assay, versican was removed to create alternating stripes, and the plate was reincubated with 10 µg/ml Fn for 1 h and washed with PBS. In order generate a dorsal start point for NC migration, a horizontal line was etched onto the plate. Control dishes were done by incubating Fn and BSA alone. Once the NC had been dissected, it was transferred onto the Fn-coated area and allowed to attach for 30 min at RT before imagining.
Time-lapse video microscopy
For time-lapse recordings, images were captured every 3–5 min for a total of 8 h using Plan Fluor 10×/0.30 DIC L/N1 objectives with DM5500 and DMR XA2 compound microscopes (Leica Biosystems) at 18°C with either a DFC 300FX camera (Leica Biosystems) and LAS acquisition software or an Orca-5G camera (Hamamatsu Photonics) and SimplePCI software. For in vivo imaging, embryos were immo-bilized onto plasticine. Time-lapse and NCC tracking was performed using the ImageJ Manual Tracking plug-in as previously described (Carmona-Fontaine et al., 2008; Matthews et al., 2008). Time-lapse im-aging for CIL and CoA assays was performed at 18°C in Danilchick’s medium using an upright microscope (Eclipse 80i; Nikon) fitted with an objective (Plan Fluor 10×/0.30 DIC L/N1) and a camera (ORCA-05G; Hamamatsu Photonics). Data were acquired using SimplePCI software. Confocal images were acquired at 22°C in Danilchick’s medium using a TCS SPE upright microscope (Leica Biosystems) fitted with a HC PL APO 20×/0.75 IMM CS2 water objective. ISH images were captured at 18°C using a stereomicroscope (MZ FLI II; Leica Biosystems) fitted with a Plan 1.0×/0.125 objective and a camera (DFC420; Leica Biosys-tems). Data were acquired using IM50 v5 software (Leica BiosysBiosys-tems).
on February 28, 2017
Statistics
Normal distributions were described using the mean and either the standard error of the mean or SD as noted for bar graphs with error bars. Nonnormal data distributions were described using median, lower, and upper quartiles, and minimum and maximum values, and represented using bar-and-whisker graphs, where whiskers show mini-mum and maximini-mum values, boxes indicate lower and upper percentile, and bars show the median value. Significance for differences was cal-culated with a two-sided Student’s t test for normally distributed data or a two-sided two-sample Mann-Whitney U test for nonnormal data (***, P < 0.001; **, P < 0.01).
Quantification of dispersion
Dispersion of simulated cell clusters was quantified using the Delaunay triangulation method (Carmona-Fontaine et al., 2011). In brief, the cen-troid position of the cells is used to create a Delaunay tessellation of the cell configuration. The resulting median of the triangle areas are compared at the end of the observation period and at the beginning of the observation period, and the ratio of these values is defined as the dispersion of the population.
Persistence
Movement persistence of trajectories is calculated by measuring the maximum distance along the trajectory and dividing by the total length of the trajectory (Vedel et al., 2013).
CPM of NC migration
Our model of NC migration is based on the CPM (Graner and Glazier, 1992) using the Tissue Simulation Toolkit implementation package (Merks and Glazier, 2005; https ://sourceforge .net /projects /tst /). Cells
are represented as domains on a 2D grid with an integer σ(x) in every
grid point x denoting the ID of the cell occupying that grid point and
σ(x) = 0 designating cell free areas (medium). The same grid is used
to describe the concentration distribution of chemoattractant C3a as
c(x) at every point x. Each configuration ξ is characterized by a scalar
valued function, the Hamiltonian, as
H
(
ξ)
= ∑ i=1 N λ V [ V ( i )−V T ( i ) ] 2 + <x,y>∑ J x,y [1−δ(
x, y)
] .The first sum runs through cells and characterizes the deviation of
cell areas V(i) from a target area VT(i) and is referred to as the volume
term. The second term sums all cell borders with different weights Jx,y
assigned to different boundary types (e.g., cell–cell boundaries, cell– medium boundaries) and is referred to as the adhesion term. Function
δ(x,y) is the Kronecker-delta function: δ(x,y) = 1 if x = y, otherwise δ = 0. Cell movement results from a series of attempts to update the
cell IDs on the grid. In such an update attempt, a target site b and one of its neighbors, a, are selected at random and an attempt is made to
copy the source value σ(a) to target site b. The probability of
over-writing σ(b) with σ(a) is defined as P [ σ ( a ) → b ] = min
(
1, exp { w [ σ( a ) → b ] − ΔH [ σ ( a ) → b ] }
)
. Here, ΔH [ σ ( a ) → b ] is the change inH(ξ) caused by the copy attempt and w[σ(a)→b] is
w [ σ ( a ) → b ] = λ c[ c ( b )−c ( a ) ] ⋅ δ [ σ ( a ) ] ⋅ {1−δ [ σ ( b ) ] } + λ p ∑ i= [ σ ( a ) ,σ ( b ) ] Δ r i p i ____ | p i | + λ m i= [ σ (∑ a ) ,σ ( b ) ] Δ r i ⋅ ∑ j∈ [ n ( i ) ] r i,j ___
|
r i,j|
⋅(
|
r i,j|
−d 0)
. The first term describes cell expansion caused by chemotaxis at freecell boundaries with an affinity of λc (Merks et al., 2008). Again, δ(i) =
1 only if i = 0. The second term enhances cell displacements caused by
the copy attempt (Δri) in the direction of the cell’s internal polarization
direction pi with relative strength λp (Szabó et al., 2010). The third term
describes the bias produced by an elastic mechanical link between cell i
and its linked neighbors n(i), with ri,j = rj− ri (where ri is the position of
cell i) and d0 denoting the diameter of cells. Such links are established
between touching cells with a probability of p+ = 0.1 and are removed
with probability p− = min[1,(|ri,j |− d0)/100] and are responsible for
adjusting the viscosity of the migrating cluster (Czirók et al., 2013; Kuriyama et al., 2014).
The usual time step in the CPM is the Monte Carlo step (MCS), defined as N copy attempts, where N is the number of grid points in the system. After each MCS the polarity vectors are updated with the cell
displacement in that MCS (ΔRi(t)) as p i ( t + 1 ) = ( 1 − δ i ) p i ( t ) + Δ R i ( t ) ,
where δi is the persistence decay coefficient of cell motion (Szabó et al.,
2010), which depends on whether the cell is in contact with any other
cell or not. Whenever two cells are in contact for at least Δt time, the
polarization vector of both cells is additionally updated to represent a repolarization bias away from the contact:
p iCIL ( t + 1 ) = p i ( t + 1 )−λ r
r i,j
___
|
r i,j|
,where λr represents the strength of the repolarization.
To allow a more realistic cluster spreading, we consider insert-ing a cell-free area between cells durinsert-ing a copy attempt (Szabó et al., 2012) with a constant probability of 0.1. In this case, the chemotaxis term is set to zero and only the retracting cell is considered in the other terms. Additionally, when the elementary copy attempt would cause a cell to lose its connectivity (i.e., the cell would be split), an additional
ΔHconn penalty is added to the ΔH function to reduce the probability
of accepting such a copy.
Chemoattractant secretion, diffusion, and decay are simulated using a forward Euler method to solve the discretized diffusion
equa-tion ∂ t c ( t, x ) = D ∇ 2 c ( t, x ) + s c ⋅ δ cell − d c ⋅ c ( t, x ) . Here, D is the
diffu-sion coefficient; secretion only occurs at positions that are occupied
by a cell (expressed by the function δcell = 1 (only at sites occupied by
cells) at a rate sc, whereas decay is described by a decay rate dc. The
diffusion equation is iterated sufficient number of times between each MCS to avoid numerical instabilities caused by high D. The effect of versican is implemented in the model as a stationary chemorepellent. At boundaries, versican is present as a linear gradient spanning a range of 50 µm (10 lattice sites).
Model parameters
Cells with a target area of 25 grid points were initialized in a tightly packed cluster of 50 cells in a system of either 300 × 300 or 70 × 300 grid points to represent unconfined or confined geometries. In confined geometries, 25 grid points were added to the confinement width on both sides with 10 grid sites on both side reserved for the versican boundary. For large clusters, the simulation area was increased to accommodate a cell-free area at least 260 grid points in length from the edge of the cluster. Dorsal boundaries and strict confinement boundaries are non-permissive, and copying onto a boundary site is not allowed for cells. Cell size calibrates our model to 1 grid point = 5 µm, and we chose 1 MCS = 15 s. Simulations are run for 2,400 MCS (10 h), with an additional 500 MCS initial annealing phase without cell propulsion to remove any bias from artificial cell shape initialization and build up a steady-state chemoattractant concentration field. Adhesion values are
set to neutral (Jcell–cell = 1, Jcell–medium = 0.5), and the relative importance
of the terms are set to λV = 1, λc = 0.2, λp = 0.65, λm = 1.25, and λr =
0.05, unless otherwise stated. Repolarization delay is set to Δt = 8 MCS
to obtain a contact duration distribution (Fig. S3 B) that is compati-ble with experimental observations (Woods et al., 2014). The polarity
decay parameter was set to δf = 0.3 for free cells and δC = 0.06 for
cells in contact to achieve realistic persistence of free cells and cells in clusters (Fig. S3 A, Pc = 0.13, Pf = 0.5). Parameters for the diffusion
on February 28, 2017
process were set to mimic the parameters of small diffusing molecules (Belle et al., 2006; Lin and Butcher, 2006) and to provide a
charac-teristic diffusion length of ∼100 µm (Carmona-Fontaine et al., 2011;
Woods et al., 2014): D = 8, dc = 0.006, and secretion is set to sc = 10.
Absorbing boundaries are set for the diffusion process (c = 0), which are also extended for an additional 100 grid points from the cell arena to allow a smooth diffusion field and to avoid mayor boundary effects. DEM model of NC migration
In the following, we describe the DEM model of NC migration used for this study, which is based on the model described and analyzed previously (Woods et al., 2014). Cells in this 2D model are represented as point particles with a position and velocity and a finite contact radius R. If the centers of two cells are within 2R distance, they are considered to be in contact. Cell motion is governed through a secondary dynam-ics, which is integrated using a forward Euler method. For cell i:
v i ( t + 1 ) = v i ( t ) + f i ( t ) ___ m Δt r i ( t + 1 ) = r i( t ) + v i ( t ) Δt,
where vi(t), ri(t), and fi(t) are the velocity, position, and forces acting
on cell i at time t, Δt is the integration time step, and m is the mass of
the cell. The forces acting on the cell depend on the state of the cell, in particular whether it is in contact with other cells or not (free).
Forces acting on free cells ensure that it is attracted to other cells (CoA), it periodically tumbles by abruptly changing its migration di-rection and maintains an approximately constant speed:
f iF ( t ) = κ C ⋅ m α C
|
v i ( t )|
∇ φ i ( t ) + κ T m __ Δt [|
v i ( t )|
n ω−v i ( t ) ] + κ S m α p [ S ^ v i ( t )−v i ( t ) ] .The first term describes CoA, where ∇ φ i ( t ) represents the gradient of
a field of chemoattractant that is diffusing from cells and decaying and is assumed to have reached a steady state. Therefore, the chemoattrac-tant level sensed by cell i is
φ i ( t ) = ∑
j c 0exp
[
− H(
r j−R i)
]
,where Ri = ri + Rsvi(t) is the position of chemoattractant sensing of cell
i with Rs = 18 µm, and H is a parameter constant related to the diffusion
length of the chemoattractant molecule. Concentration levels are
mea-sured in arbitrary units; therefore, we chose c0 = 1. The function κC(t) is
constructed such that it ensures that CoA acts only once every 2 s on the cell. The second term in the equation of the force describes tumbling.
Here, the function κT(t) is constructed such that it ensures that the cell
tumbles once every 5 min. During tumbling, the cell’s direction of
mo-tion is forced to turn in a randomly chosen nω direction. Finally, the last
term forces the cell to assume speed S. v ^ i ( t ) is the unit-vector pointing
in the direction of vi(t).
Forces acting on cells that are in contact are f iC ( t ) = ∑
j {− K δ ij
3/2 ( t )−D √____mK ⋅ δ
ij1/4 ( t ) ⋅ V ij ( t ) + κ R
(
ij)
m α R [ S n CIL−v i ( t ) ] } . The summation runs over all cells other than i. The first term describes an elastic contact force, with K being the effective stiffness parameter of thecells and δij being the overlap between the two cells (δij = 2R − |ri − rj|).
The second term describes a dissipative contact force, with Vij(t) being
the relative velocity of the two cells: Vij(t) = {(vi(t) − vj(t)) nij(t)} nij(t),
where nij(t) is the unit vector pointing from cell i to cell j. Parameter D
describes the effect of contact dampening. The last term describes CIL.
The function κR(ij) is a Heavyside step function with zero value until the
cells i and j have been in continuous contact for 10 min, and it is one after
that. The CIL force acts to turn the velocity vector in the direction of nCIL,
which is chosen randomly from the interval [nij(t) + 0.5π: nij(t) + 1.5 π].
Lateral boundaries are represented as a constant force field
act-ing on cells that enter the boundary region with a strength fB. As in the
CPM implementation, the boundary region is restricted to 50 µm on either side of the corridor. The dorsal boundary is implemented by con-structing a virtual mirror cell on the opposite side of the dorsal bound-ary that acts on the approaching real cell and consequently prevents the real cell to cross the dorsal border.
Parameters are based on the previous study (Woods et al., 2014):
S = 4 × 10⁻⁸, α
p =1, αR = 0.003, αc = 1.5e3, fB = 10−8, H = 6301.338,
m = 10−10, R = 20 µm, K = 0.1124365, D = 2.199, and Δt = 1 ms.
Sim-ulation arena size was chosen to be Lx = 1,800 µm and Ly = 1,000 µm
for unconstrained simulations and Lx = 220 µm and Ly = 1,000 µm
for constrained simulations. A total of 50 cells were initialized in five columns and 10 rows.
Online supplemental material
Fig. S1 shows the expression levels of versican isoforms at various developmental stages and the placodal ectoderm and the pharyngeal endoderm tissues adjacent to the NC. Fig. S2 shows the specificity of the VsMO injections, the effect of VsMO at the later stage 25, CIL and CoA unaffected by VsMO, a rescue experiment using versican-soaked microbeads, quantification of the graft experiments in Fig. 2 (F and G), the effect of VsMO on placode organization, melanocyte numbers, and cartilage formation. Fig. S3 provides further information on the computational model behavior. Videos 1 and 2 show simulations of CPM and DEM models of NC migration with and without confinement. Video 3 contains time-lapse recordings of in vivo grafted NCC and is related to Fig. 4 (A and C). Video 4 shows NC explants plated in scratch assay or on fibronectin and is related to Fig. 4 (L and N). Video 5 shows simulations with varying confinement widths and cell numbers and is related to Fig. 5 B. Online supplemental material is available http ://www .jcb .org /cgi /content /full /jcb .201602083 /DC1.
Acknowledgments
We thank Claudia Linker for comments on the manuscript.
This study was supported by grants from Medical Research Council (M010465 and J000655) and Biotechnology and Biological Sci-ences Research Council (M008517) and Wellcome Trust to R. Mayor and by a Marie Curie Fellowship (329968) to A. Szabó. The authors acknowledge the use of the University College London Legion High Performance Computing Facility, and associated support services, in the completion of this work.
The authors declare no competing financial interests. Submitted: 25 February 2016
Accepted: 12 May 2016
References
Alfandari, D., H. Cousin, A. Gaultier, B.G. Hoffstrom, and D.W. DeSimone. 2003. Integrin α5β1 supports the migration of Xenopus cranial neural crest on fibronectin. Dev. Biol. 260:449–464. http ://dx .doi .org /10 .1016 / S0012 -1606(03)00277 -X
Baker, R.K., and P.B. Antin. 2003. Ephs and ephrins during early stages of chick embryogenesis. Dev. Dyn. 228:128–142. http ://dx .doi .org /10 .1002 /dvdy .10354
Beck, C.W., and J.M. Slack. 1999. A developmental pathway controlling out-growth of the Xenopus tail bud. Development. 126:1611–1620.