Article
Skeletal-Muscle Metabolic Reprogramming in
ALS-SOD1
G93A
Mice Predates Disease Onset and
Is A Promising Therapeutic Target
Silvia
Scaricamazza, Illari
Salvatori,
Giacomo
Giacovazzo, ...,
Roberto
Coccurello,
Cristiana Valle,
Alberto Ferri
[email protected] (C.V.) [email protected] (A.F.) HIGHLIGHTSMetabolic switch use occurs early in the skeletal muscle of SOD1G93Amice
Mitochondrial impairment precedes locomotor deficits and evokes catabolic pathways
Sarcolipin upregulation in presymptomatic SOD1G93Amice precedes hypermetabolism Pharmacological modulation of hypermetabolism improves locomotor performance
Scaricamazza et al., iScience 23, 101087 May 22, 2020ª 2020 The Author(s). https://doi.org/10.1016/ j.isci.2020.101087
OPEN ACCESS
Article
Skeletal-Muscle Metabolic Reprogramming
in ALS-SOD1
G93A
Mice Predates Disease Onset
and Is A Promising Therapeutic Target
Silvia Scaricamazza,
1,2,14Illari Salvatori,
2,14Giacomo Giacovazzo,
2Jean Philippe Loeffler,
3,4Frederique Rene`,
3,4Marco Rosina,
1Cyril Quessada,
3,4Daisy Proietti,
2Constantin Heil,
2Simona Rossi,
1,5Stefania Battistini,
6Fabio Giannini,
6Nila Volpi,
6Frederik J. Steyn,
7,8Shyuan T. Ngo,
8,9,10Elisabetta Ferraro,
11Luca Madaro,
2,12Roberto Coccurello,
2,13Cristiana Valle,
2,5,*
and Alberto Ferri
2,5,15,*
SUMMARY
Patients with ALS show, in addition to the loss of motor neurons in the spinal cord,
brainstem, and cerebral cortex, an abnormal depletion of energy stores
along-side hypermetabolism. In this study, we show that bioenergetic defects and
mus-cle remodeling occur in skeletal musmus-cle of the SOD1
G93Amouse model of ALS
mice prior to disease onset and before the activation of muscle denervation
markers, respectively. These changes in muscle physiology were followed by an
increase in energy expenditure unrelated to physical activity. Finally, chronic
treatment of SOD1
G93Amice with Ranolazine, an FDA-approved inhibitor of fatty
acid b-oxidation, led to a decrease in energy expenditure in symptomatic
SOD1
G93Amice, and this occurred in parallel with a robust, albeit temporary,
re-covery of the pathological phenotype.
INTRODUCTION
Amyotrophic lateral sclerosis (ALS) is characterized by the progressive loss of upper and lower motor neu-rons. The loss of these neurons leads to the concomitant development of skeletal muscle atrophy (Rossi et al., 2015). ALS is a disease of obscure etiology, for which neither a cure nor a therapeutic option is avail-able. ALS is a multifactorial disease and a number of mechanisms have been proposed to underpin disease pathology, including alterations in RNA metabolism, oxidative stress, axonal transport defects, neuroin-flammation, impaired protein homeostasis, alterations in autophagic flux, aberrant cytoplasmic-nuclear shuttling, failure in DNA repair, excitotoxicity, mitochondrial dysfunction, and vesicular transport defects (Mejzini et al., 2019).
In spite of its elusive etiology, some well-described clinical signs in patients with ALS highlight promising lines of investigation to improve our understanding of disease. Notably, hypermetabo-lism (Steyn et al., 2018) and weight loss (Moglia et al., 2019) are associated with worse prognosis. However, weight loss, undernutrition, muscle atrophy, weakness, and reduced physical activity (Ioannides et al., 2016) appear incompatible with clinical studies reporting increased energy expen-diture (EE) in patients with ALS (Bouteloup et al., 2009; Desport et al., 2005; Funalot et al., 2009; Kasarskis et al., 2014). The paradox may be reconciled by assuming that skeletal muscle plays a pathological role in ALS, contributing to defective energy metabolism and a derangement of basal metabolic rate. Indeed, skeletal muscle is a key determinant of whole-body metabolic rate (Zurlo et al., 1990).
In this context, the early events underlying defective muscle metabolism in ALS as well as the major molec-ular mechanisms that cause ALS-associated hypermetabolism are still unknown. We therefore undertook this investigation to provide insights into the early pathological events involved in ALS by examining the mechanisms responsible for maladaptive muscle oxidative metabolism and disease progression. Finally, in this study, we provided evidences to show that pharmacological modulation of metabolism can curtail excessive EE and improve ALS pathology, thereby demonstrating that limiting hypermetabolism could be a promising therapeutic target in ALS.
1University of Rome Tor
Vergata, Department of Biology, Rome, Italy
2IRCCS Fondazione Santa
Lucia, Rome, Italy
3Universite´ de Strasbourg,
UMR_S 1118, Strasbourg, France
4INSERM, U1118, Central and
Peripheral Mechanisms of Neurodegeneration, Strasbourg, France
5National Research Council,
Institute of Translational Pharmacology (IFT), Rome, Italy
6University of Siena,
Department of Medical, Surgical and Neurological Science, Siena, Italy
7School of Biomedical
Sciences, The University of Queensland, Brisbane, QLD, Australia
8Centre for Clinical Research,
The University of
Queensland, Brisbane, QLD, Australia
9Australian Institute for
Bioengineering and Nanotechnology, The University of Queensland, Brisbane, QLD, Australia
10Queensland Brain Institute,
The University of
Queensland, Brisbane, QLD, Australia
11Department of Biology,
University of Pisa, Pisa, Italy
12DAHFMO-Unit of Histology
and Medical Embryology, Sapienza University of Rome, Rome, Italy
13National Research Council,
Institute for Complex System (ISC), Rome, Italy
14These authors contributed
equally 15Lead Contact *Correspondence: [email protected](C.V.), [email protected](A.F.) https://doi.org/10.1016/j.isci. 2020.101087
RESULTS
An Increase in Fatty Acid Oxidation and Glucose Intolerance Precedes Hypermetabolism in SOD1G93AMice
To investigate the whole-body metabolic status and fuel oxidation in SOD1G93Amice, we conducted indi-rect calorimetry over 2 or 3 continuous days. Measures were obtained from animals at the early presymp-tomatic (55 days of age) and symppresymp-tomatic (120 days of age) stages of disease. Hypermetabolism, defined as an increase in total EE or resting energy expenditure (REE), was not detectable in early presymptomatic mice (Figures 1A–1C) but was strongly evident in symptomatic mice (Figures 1D–1F). Analysis of the respi-ratory exchange ratio (RER) revealed a significant genotype effect, with RER being reduced in both early presymptomatic and symptomatic SOD1G93Amice when compared with wild-type control mice (Figures
1G and 1H). These results are indicative of enhanced fatty acid oxidation and predominant use of fatty acids as fuel source in ALS mice.
After confirmed metabolic alteration in presymptomatic SOD1G93Amice and since skeletal muscle is the
major factor affecting EE also at rest (Zurlo et al., 1990) we carried out RNA sequencing to assay gene expression changes in the tibialis anterior (TA) of SOD1G93Amice at the onset stage of disease, when
compared with their wild-type littermate controls. Gene enrichment analysis, using Reactome categories, highlighted that the gene sets most significantly enriched among downregulated genes were associated with glucose metabolism (Figure 1I). In particular, we observed downregulation of key glycolysis pathway genes (Figures 1J and 1K). The decrease in the expression of glycolytic pathway genes was further sup-ported through our assessment of glucose tolerance in SOD1G93Amice. At the early presymptomatic stage,
SOD1G93Amice already show a marked decrease in blood glucose clearance with respect to wild-type
con-trol littermates (Figure 1L, upper panel). This metabolic alteration dramatically worsened with disease pro-gression in SOD1G93Amice (Figure 1L, middle and lower panels).
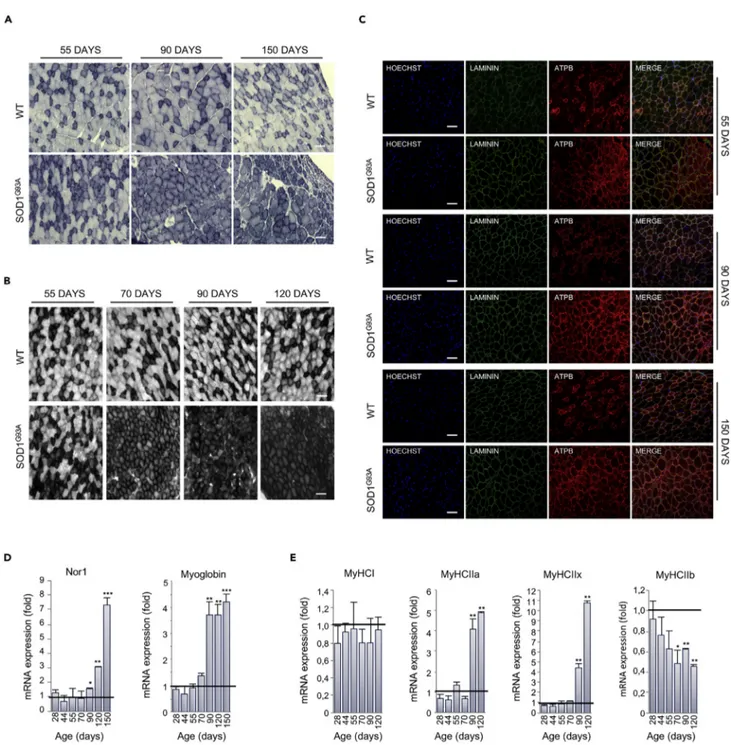
ALS Skeletal Muscles Undergo Metabolic Reprogramming
Based on results obtained through indirect calorimetry and transcriptome analysis, we aimed to define the timing of the onset of metabolic changes in skeletal muscle of SOD1G93Amice by analyzing the oxidative
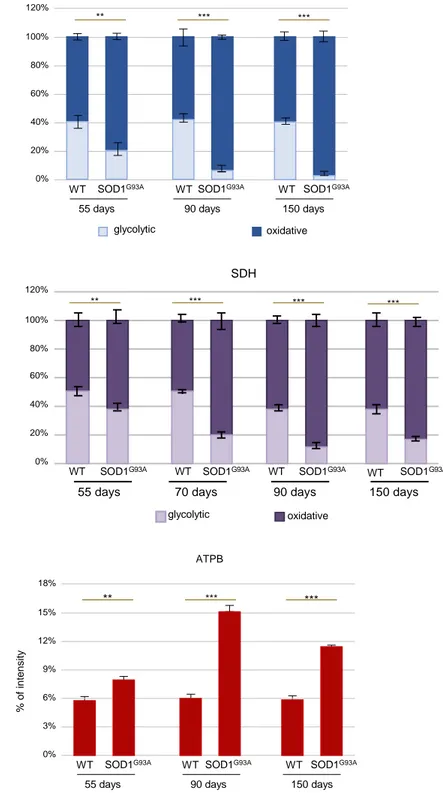
capacity of the glycolytic TA at different time points. We found that in situ NADH-TR and SDH activities were dramatically increased in SOD1G93Amice at the early presymptomatic stage (55 days) and to a higher
degree at the later stages of the disease (Figures 2A, 2B,S1A, and S1B).
In line with the rise in muscle oxidative capacity, we detected, by immunofluorescence analysis, a consistent increase in the intensity of ATPB, a known mitochondrial marker, in the TA muscle of SOD1G93Amice (
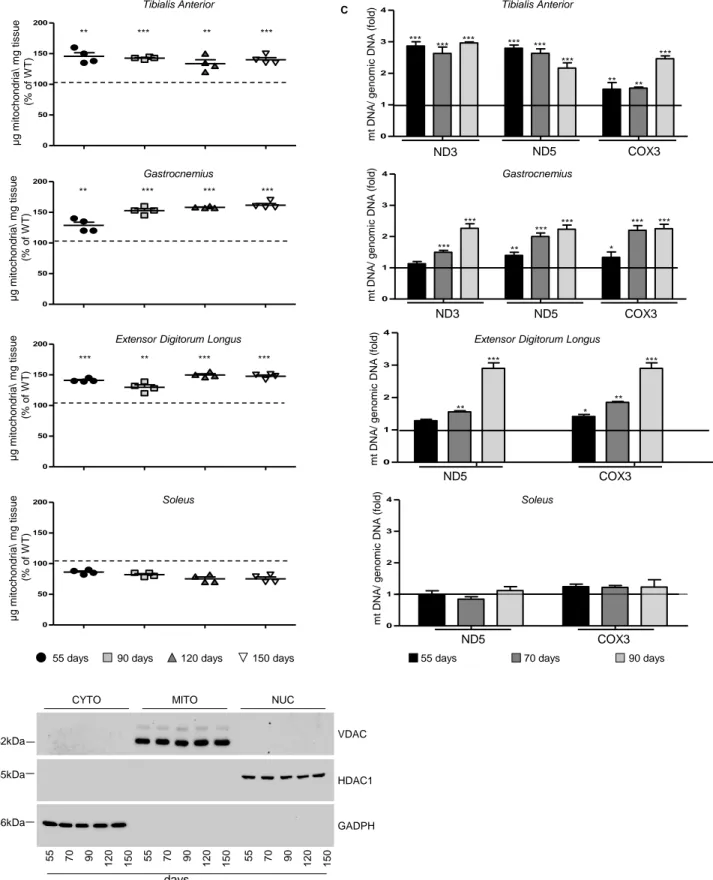
Fig-ures 2C andS1C). Accordingly, a striking increase in mitochondrial mass was observed, defined by an in-crease in the amount (mg) of mitochondria per milligram of tissue as well as an increase in the content of mitochondrial DNA, in different muscles of SOD1G93Amice during the course of the disease (Figures
S2A–S2C). Interestingly, this phenomenon occurred mainly in glycolytic muscles and not in the oxidative soleus muscle.
The switching of skeletal muscle metabolism toward an oxidative phenotype in SOD1G93Amice was further
corroborated by the upregulation in neuron-derived orphan nuclear receptor (Nor1) mRNA in the TA ( Fig-ure 2D). This transcription factor is known to promote muscle remodeling toward oxidative metabolism by activating pathways critical for adaptation to exercise or energy deficit (Goode et al., 2016). The upregula-tion of Nor1 in SOD1G93Amice occurred alongside an upregulation in mRNA encoding for myoglobin (
Fig-ure 2D) (Pearen et al., 2013). Moreover, we found significant alterations in the expression of mRNAs encod-ing myosin heavy chain isoforms. Specifically, we observed a reduction in the expression of the glycolytic isoform MyCHIIb and an increase in the expression of the oxidative/intermediate isoforms MyHCIIa and MyHCIIx (Figure 2E). No significant alterations were observed in the expression of the oxidative isoform MyHCI (Figure 2E). Overall, these data show that, in SOD1G93Amice, glycolytic muscles undergo a
pro-found rearrangement in their physiology throughout the course of disease.
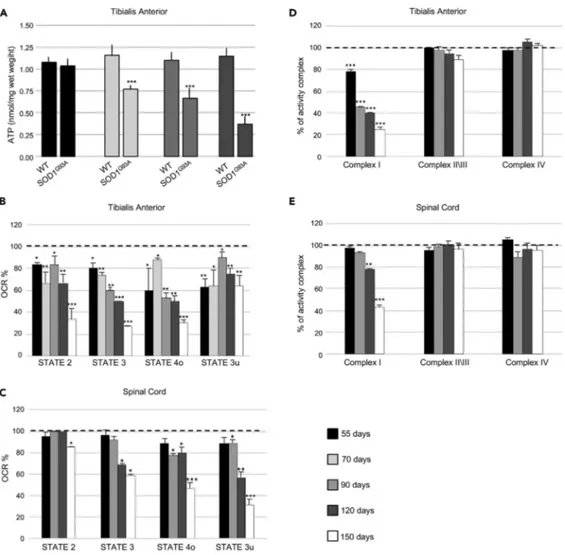
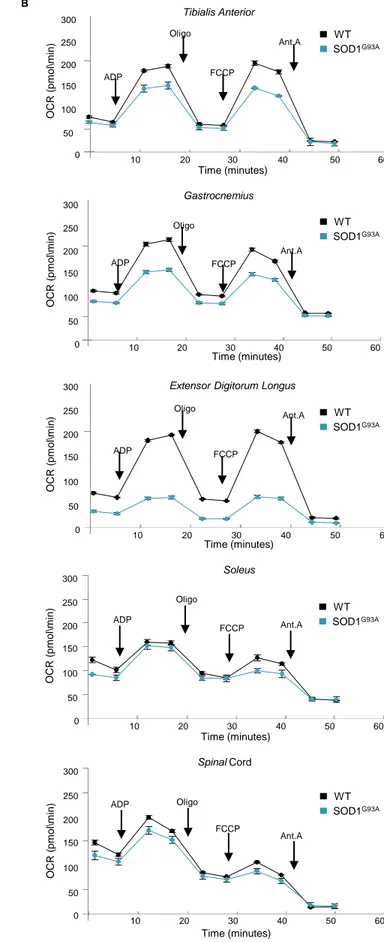
Mitochondrial Bioenergetics Are Perturbed in Skeletal Muscle of Early Presymptomatic SOD1G93AMice
The metabolic modifications of skeletal muscle observed in SOD1G93Aanimals mirror adaptations to endurance training, wherein a switch from glycolytic to oxidative metabolism occurs (Granata et al.,
2018; Widmann et al., 2019). During endurance training, this metabolic switch is accompanied by an in-crease in mitochondrial mass alongside significant remodeling of myofibers and a preferential use of fatty acids as fuel (Granata et al., 2018; Widmann et al., 2019). Although we found that mitochondrial mass in glycolytic TA muscle of SOD1G93Amice increased during the disease course, we also noted an early mito-chondrial bioenergetic defect. In this regard, we found that total ATP was significantly lower in the TA of SOD1G93Amice at the early symptomatic through to the mid-stage of disease when compared with age-matched wild-type control mice (Figure 3A). Moreover, we observed a marked reduction in all mitochon-drial functionalities in the TA of SOD1G93Amice at the early presymptomatic phase of the disease. Similarly,
early reductions in mitochondrial function were also observed in other glycolytic muscles, gastrocnemius (GNM) and extensor digitorum longus (EDL) (Figures S3A and S3B). Interestingly, bioenergetic defects only become detectable in the spinal cord at onset of the pathology (Figures 3C andS3B).
To further investigate the mitochondrial bioenergetic deficit in SOD1G93A mice, we assessed respira-tion states of mitochondria isolated from skeletal muscle and spinal cord of SOD1G93A mice and
wild-type litter matched controls. We observed a decrease in maximally coupled respiration (state 2), thereby confirming the impairment in ATP production. Moreover, maximal respiration (state 4), determined through the addition of the uncoupling agent FCCP, appeared to be significantly compro-mised in mitochondria obtained from glycolytic TA, GNM, and EDL of presymptomatic SOD1G93Amice (Figures 3B,S3A, and S3B). Interestingly, mitochondria purified from a purely oxidative muscle, the so-leus, were not affected (Figures S3A and S3B). With the aim of characterizing the alterations in the electron transport chain, we performed a spectrophotometric analysis of the functional activities of the mitochondrial complexes and observed a specific impairment in Complex I in mitochondria puri-fied from the TA (Figure 3D) and GNM (not shown) of early presymptomatic SOD1G93Amice. Again,
this dysfunction was evident in skeletal muscle from early presymptomatic SOD1G93A mice, whereas
defects in Complex I activity were only observed in the spinal cords of SOD1G93Amice at the
symp-tomatic and end stage of disease (Figure 3E).
Next, we performed Blue Native polyacrylamide gel electrophoresis (BN-PAGE) analysis of digitonin-extracted mitochondrial membranes obtained from the TA of SOD1G93Amice and their wild-type con-trol littermates at different ages (Figure S3C). We found no difference in the assembly of electron transport chain complexes or supercomplexes in mitochondria obtained from SOD1G93A mice when
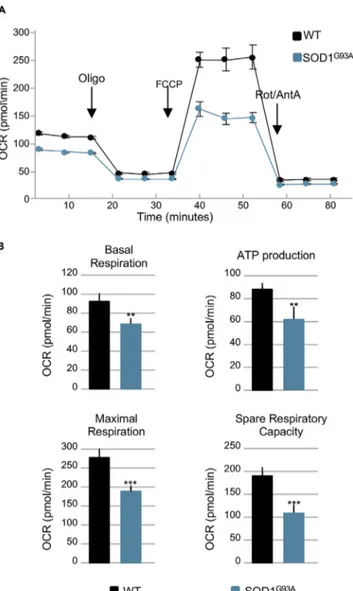
compared with age-matched controls. Finally, bioenergetic assessment of primary cultures of skeletal muscle satellite cells isolated from early presymptomatic SOD1G93Amice (55 days of age) revealed
sig-nificant decreases in basal respiration, ATP production, maximal respiration, and spare respiratory ca-pacity when compared with those isolated from their wild-type control littermates (Figures 4A and 4B). The decline in maximal respiration and spare respiratory capacity suggests that ALS may inhibit the rapid adaptation of skeletal muscle satellite cells to metabolic changes. Thus, although the number of mitochondria in the whole muscle appears to increase in SOD1G93Amice, mitochondrial metabolism is compromised early in the course of the disease, leading to ATP deficit and impairments in OXPHOS functionality.
Muscle Mitochondrial Deficit in SOD1G93AMice Occurs in Parallel with an Activation of
Molecular Pathways that Compensate for Energy Failure
In normal physiology, a decrease in ATP production (mitochondrial alterations) leads to an enhancement in AMPK activity to promote the binding of AMP (and ADP) to the kinase subunit. This in turn induces the phosphorylation of a wide range of downstream proteins that eventually lead to the activation of catabolic pathways (Hardie et al., 2016). In particular, pharmacological or genetic inhibition of Complex I is sufficient to activate AMPK (Hardie et al., 2016; Thomas et al., 2018). Therefore, in light of the bioenergetic defects
Figure 1. Energy Expenditure and Metabolic Profile of WT and SOD1G93AMice
(A–L) (A) Energy expenditure profiles of early presymptomatic SOD1G93Amice (55 days) and their wild-type control littermates (WT). Black bar indicates dark
cycle period. Mean (B) energy expenditure (EE) and (C) resting energy expenditure (REE) calculated from (A). (D) Energy expenditure profiles of symptomatic
SOD1G93Amice (120 days) and their wild-type control littermates (WT). Mean (E) EE and (F) REE calculated from (D). (G and H) Mean RER from (A) and (D),
respectively. (I) Gene expression changes in the tibialis anterior (TA) muscle from SOD1G93Amice and their wild-type control littermates. (J) Heatmap
depicting expression of genes from the Reactome category ‘‘Glycolysis.’’ Shown genes are differentially expressed with adjusted p < 0.05. (K) Network plot of the "Pyruvate metabolism and Citric Acid (TCA) cycle" pathways. Nodes are genes colored based on log2FC, edges are knowledge-based interactions
annotated by Reactome. (L) Glucose tolerance test performed in SOD1G93Aand in their wild-type control littermates (WT) at 55, 90, and 120 days of age,
Figure 2. Muscle Metabolism Switches from Glycolytic to Oxidative in SOD1G93AMice
(A) Representative NADH-tetrazolium reductase activity staining on tibialis anterior (TA) cross sections obtained from 55-, 90-, and 150-day-old SOD1G93A
mice and their wild-type control littermates (WT). Scale bar, 100mm, n = 3.
(B) Representative SDH activity staining on TA cross sections of 55-, 70-, 90-, and 120-day-old SOD1G93Amice and their wild-type control littermates (WT).
The darker color indicates the site of SDH activity. Scale bar, 100mm, n = 3.
(C–E) (C) Representative images of TA sections from 55-, 90-, and 150-day-old SOD1G93Aand wild-type (WT) mice, immunostained with laminin (green) and
the mitochondrial marker ATPB (red); nuclei were detected with Hoechst 33342 (blue). Scale bar, 100mm, n = 3. Expression level of mRNAs coding for (D)
Nor1 and Myoglobin and (E) MyHCI, MyHCIIa, MyHCIIIx, and MyHCIIb in TA sections obtained from SOD1G93Aat the indicated ages (at least n = 4). Data are
presented as meanG SEM, *p < 0.05, **p < 0.001, ***p < 0.0001, compared with wild-type control littermates at the same age (arbitrarily set at 1), unpaired
Student’s t test.
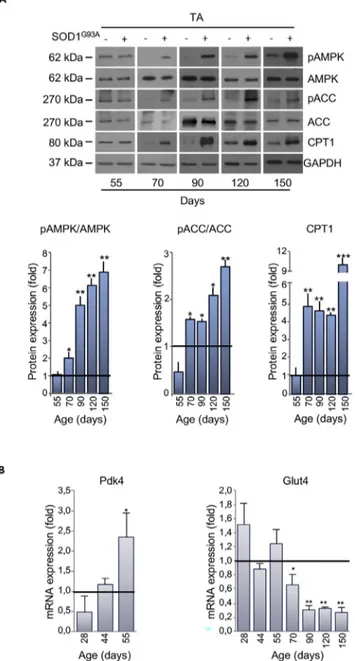
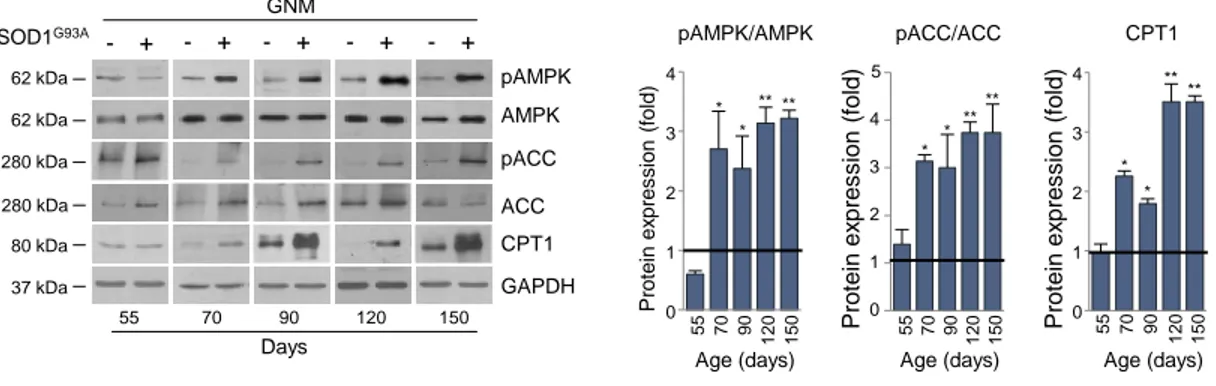
observed in early presymptomatic mice and the specific impairment of Complex I activity, we analyzed the extent of AMPK activation in ALS mice.
Glycolytic skeletal muscles from SOD1G93Amice displayed a robust activation of AMPK, long before the appearance of locomotor symptoms (Figures 5A andS4). AMPK activation occurred in parallel with the phosphorylation/inactivation of the AMPK downstream target Acetyl-CoA Carboxylase (ACC), which cat-alyzes the first step of fatty acid synthesis (Figures 5A andS4). Moreover, we found an upregulation in carni-tine palmitoyltransferase 1 (CPT1) in the skeletal muscle of presymptomatic SOD1G93Amice (Figures 5A
Figure 3. Mitochondrial Bioenergetic Failure Occurs in Skeletal Muscle of Early Presymptomatic SOD1G93AMice
(A) Fluorometric measurements of total ATP in the tibialis anterior (TA) muscle from SOD1G93Aand wild-type
age-matched control mice (WT) at different ages. Data were analyzed by unpaired t test and presented as meanG SEM,
***p < 0.0001 compared with age-matched WT mice (n = 4 independent experiments). (B) Coupling assay on isolated mitochondria purified from TA.
(C) Spinal Cord of SOD1G93Amice at the indicated ages. Mitochondrial respiration stages are reported as basal
respiration (state 2), maximal coupled respiration (state 3), respiration due to proton leak (state 4o), and maximal uncoupled respiration (state 3u). Data are expressed as % Oxygen Consumption Rate (OCR), and 100% was arbitrarily assigned to values obtained from age-matched wild-type mice, *p < 0.05, **p < 0.001, ***p < 0.0001, unpaired Student’s t test (n = 5 independent experiments).
(D) Activity of electron transport chain complexes I, II\III, and IV of mitochondria obtained from TA.
(E) Spinal Cord of SOD1G93Aand wild-type (WT) mice at the indicated ages. Values were normalized to citrate synthase
activity and presented as meanG SEM, **p < 0.001, ***p < 0.0001 compared with age-matched WT mice (arbitrarily set at
100%), unpaired Student’s t test (n = 5 independent experiments).
andS4). Finally, in support of a metabolic shift toward lipid use, we observed a decrease in the expression of Glucose Transporter type 4 (Glut4) mRNA and the concomitant increase in pyruvate dehydrogenase ki-nase 4 (Pdk4) mRNA in skeletal muscle of presymptomatic mice (Figure 5B).
Sarcolipin Is an Early Player in ALS Metabolic Alterations
Recent studies have outlined the pivotal role of sarcolipin (SLN) in orchestrating the transition toward oxidative metabolism in skeletal muscle (Maurya et al., 2018). In line with the literature (Babu et al., 2007), we found that SLN is highly expressed in the TA of wild-type control mice until 14 days of age, after which it gradually declines (Figure 6A). By contrast, in SOD1G93Amice, the expression level of SLN re-mained detectable in TA beyond 14 days of age, increasing during the course of the disease (Figure 6A). Indeed, in SOD1G93Amice, SLN overexpression was strongly upregulated through to the end stage of dis-ease in all glycolytic and oxidative muscles assessed. This is in contrast to the expression profile of SLN in
Figure 4. Mitochondrial Bioenergetics Failure Occurs in Skeletal Muscle Satellite Cells Isolated from Early Presymptomatic SOD1G93AMice
(A) Representative trace of oxygen consumption rate (OCR) in skeletal muscle satellite cells isolated from early
presymptomatic SOD1G93Amice (55 days) and their wild-type control littermates (WT).
(B) Individual parameters obtained for basal respiration, ATP production, maximal respiration, and spare respiratory
capacity. Each data point represents an OCR measurement. Data are presented as meanG SEM, **p < 0.001, ***p <
0.0001 relative to WT control, p values obtained from unpaired Student’s t test. Data from four independent experiments, with each sample tested in quadruplicate.
age-matched wild-type control mice, where SLN was only detectable in the oxidative soleus (Figure 6B). Of note, we did not observe any significant variation in mRNA expression of phospholamban (PLN) or myor-egulin (MLN) (Figure S5A), muscular micropeptides that function similarly to SLN. Thus, our data suggest that SLN is the only SERCA-regulatory micropeptide involved in ALS.
Figure 5. Alterations in Expression of Metabolic Targets Occurs Early in the tibialis anterior (TA) of SOD1G93A Mice
(A) Representative western blot images of pAMPK, AMPK, pACC, ACC, and CPT1 (upper panel) in the TA of SOD1G93A
and wild-type mice at 55 days of age. GAPDH was used as loading control. Densitometric analysis of pAMPK/AMPK and pACC/ACC ratios and CPT1 expression (lower panel) from n = 4 independent experiments.
(B) Expression of mRNAs coding for Pdk4 and Glut4 in the TA of SOD1G93Amice relative to wild-type litter-matched
controls. Data presented as meanG SEM, *p < 0.05, **p < 0.001, ***p < 0.0001 when compared with control littermates at
the same age (arbitrarily set at 1), unpaired Student’s t test.
An upregulation in SLN is known to trigger an increase in cytosolic calcium concentration in skeletal muscle (Maurya and Periasamy, 2015). To this end, we found a significant activation of Ca2+/calmodulin-dependent
protein kinase II (CaMKII) in skeletal muscle of SOD1G93Aat the presymptomatic stage of the disease, when the glycolytic muscle was highly oxidative (Figure 6C). Moreover, we observed a significant increase in PGC-1a protein expression in the TA of SOD1G93A mice at the presymptomatic phase of disease
(70 days of age) as well as throughout the course of the disease (Figure S5B).
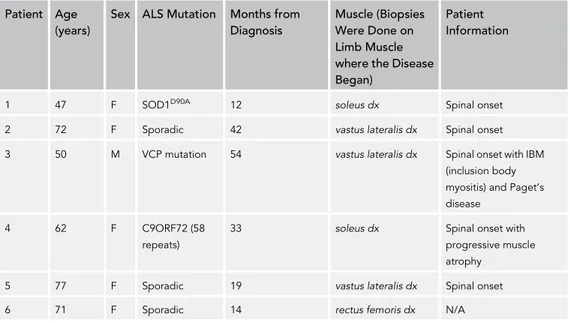
The expression pattern of mRNAs coding for different isoforms of SERCA pumps reflects the metabolic profile of muscle. SERCA2a and SERCA2b isoforms that are normally associated with oxidative muscle, were more highly expressed in the TA from SOD1G93Amice, whereas the glycolytic muscle-associated SERCA1 isoform was downregulated at the presymptomatic stage (Figure S5C). It is noteworthy that SLN selectively binds SERCA2 isoforms, interacting with these to trigger the transition of skeletal muscle from glycolytic to oxidative metabolism (Anderson et al., 2016). Finally, highly relevant was the finding that SLN expression was upregulated in muscle biopsies obtained from six patients affected by different forms of ALS (for details seeTable 1). Indeed, all ALS biopsies showed higher expression levels of SLN when compared with control patients affected by other muscular disorders (Figures 6D and 6E). Sarcolipin Overexpression in SOD1G93AMice Is Not Related to Muscle Denervation
Several pathological conditions that lead to skeletal muscle disuse and subsequent atrophy affect not only muscle mass but also muscle metabolism (Tintignac et al., 2015). SLN has been described to be a key medi-ator of metabolic modifications occurring in unloaded/disused muscle (Fajardo et al., 2017). Thus, to discriminate whether SLN upregulation is causally linked to the altered metabolic state observed in ALS mice, or whether it is merely a consequence of early denervation, we analyzed the expression levels of several denervation/atrophy markers. Our results demonstrate that, in TA from SOD1G93Amice, SLN is
up-regulated at the early presymptomatic stage, whereas mRNAs coding for Hdac4, Nav1.5, Myogenin, AchRε, AchRa, Murf1, and Myostatin, all associated with the denervation process, are only increased at the later stages of disease (Figure 6F).
In order to further decipher the relationship between denervation and metabolic alterations in skeletal muscle from ALS mice, we used an experimental paradigm of acute denervation. As shown inFigure 6G, sciatic nerve axotomy in control mice evoked an upregulation in denervation markers after 3 days, whereas SLN was only found to increase after 15 days. Overall, our data strongly suggest that, in ALS, muscle meta-bolic reprogramming is orchestrated by SLN and this occurs independent of denervation.
Altered Muscle Performance in SOD1G93AMice Is Related to Hypermetabolism
Given the altered bioenergetic profiles observed in SOD1G93Amice, we next tested whether
pharmacolog-ical targeting of altered energy metabolism could be a beneficial therapeutic approach in ALS. To address this aim, we chronically administered ranolazine (RAN) to SOD1G93Amice. RAN is a US Food and Drug
Administration (FDA)-approved drug that is used to treat ventricular hypertrophy, and it has been shown to exert cardioprotective effects by facilitating higher energy production under conditions of lower oxygen
Figure 6. Upregulation of Sarcolipin in ALS Occurs before Denervation in SOD1G93AMice
(A and B) Representative western blots of sarcolipin (SLN) protein expression in the (A) tibialis anterior (TA) or (B) Extensor digitorum longus (EDL),
gastrocnemius (GNM), and soleus muscle of SOD1G93A(+) and wild-type mice ( ) at the indicated ages.
(C) Western blot of pCaMKII and CaMKII in the TA of SOD1G93A(+) and wild type mice ( ) at the indicated ages; GAPDH was used as loading control in (A–C).
(D) SLN protein expression in different muscle biopsies derived from MELAS, neuropathy (N), not Limb Girdle Muscle Dystrophy (LGMD) and patients with
ALS (1 = SOD1D90Amutation, soleus; 2 = sporadic, vastus lateralis; 3 = Valosin Containing Protein (VCP) mutation, vastus lateralis; 4 = C9ORF72 repeat
expansions, soleus; 5 = sporadic, vastus lateralis; 6 = sporadic, rectus femoralis).
(E) Densitometric analysis of (D) normalized to GAPDH protein expression. Data are presented as a percentage, where an arbitrary value of 100% was assigned to patients with ALS, ***p < 0.0001, one-way parametric ANOVA and Tukey’s post hoc test.
(F) Expression of mRNAs coding for Sarcolipin (Sln), Acetylcholine Receptora subunit (Achra), Acetylcholine Receptor e subunit (Achre), Voltage-gated Na
channels 1.5 (Nav1.5), Histone Deacetylase 4 (Hdac4), Myogenin, MuscleRING Finger-1 (Murf1), and Myostatin in the TA of SOD1G93Amice relative to their
wild-type control littermates, *p < 0.05, **p < 0.001 ***p < 0.0001 when compared with age control littermates (arbitrarily set at 1).
(G) Expression of mRNAs coding for Sln and denervation markers (Achra, Nav1.5, Hdac4, and Myogenin) in the TA of wild-type mice 3 and 15 days after
sciatic nerve axotomy. Data are expressed as the ratio between the average of values from not axotomized and axotomized mice, *p < 0.05, **p < 0.001 when
compared with control not axotomized mice (arbitrarily set on at 1), and##p < 0.001 between mice after 3 and 15 days from axotomy. All data are presented
as meanG SEM, unpaired Student’s t test (E) and parametric ANOVA and a Bonferroni post hoc test (F), n = 3 or 4 independent experiments.
supply (Stanley, 2002). This drug decreasesb-oxidation, thereby restoring the use of glucose as fuel ( Mc-Cormack et al., 1998).
In a preliminary dose-response study, a small cohort of SOD1G93Amice and age-matched wild-type control
mice received daily intraperitoneal (i.p.) injections, for seven consecutive days, of three different doses of RAN (25, 50, 100 mg/kg). Treatment commenced at an age that corresponds to the symptomatic stage of the disease in SOD1G93Amice (110 days). Bioavailability of RAN in plasma was assessed by high-perfor-mance liquid chromatography (HPLC), and results confirmed a dose-dependent increase (Table 2). RAN concentration values were consistent with those registered in more extended pharmacokinetics and phar-macodynamics studies reported by others (Patel and Hasumati, 2015). Analysis of grip strength and SLN expression were used as readouts to determine the efficacy of RAN treatment. Strikingly, SOD1G93A
mice receiving 50 and 100 mg/kg of RAN showed a marked increase in muscular strength after 2 days of treatment. This improvement was maintained throughout the 7-day treatment period (Figure S6A). Similar results were obtained with a lower dose of RAN (25 mg/kg), which showed a significant, although delayed, efficacy. Furthermore, in the TA muscle of SOD1G93Amice, SLN expression was reduced after 7 days of
treatment. This was most evident at a RAN dose of 50 mg/kg (Figure S6B). As such, 50 mg/kg of RAN was selected as the most effective dose.
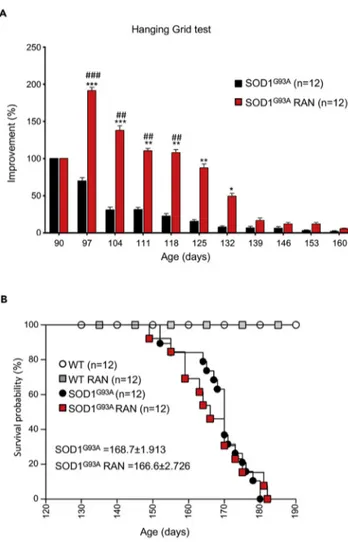
A second, larger cohort of SOD1G93Amice received 50 mg/kg RAN from the onset stage of disease
(90 days) through the end stage of disease. As shown inFigure 7A, RAN treatment improved hanging grid performance in SOD1G93Amice up until the fully symptomatic stage of the disease (132 days).
Howev-er, this improvement was not sustained; hanging grid performance in RAN-treated SOD1G93Amice was
comparable with that of non-treated SOD1G93Amice by the end stage of disease (Figure 7A). Interestingly,
RAN exerted similar effects on wild-type mice (Figure S7). Despite improving hanging grid performance in SOD1G93Amice, RAN failed to improve survival (Figure 7B) and it did not provide weight changes (data not shown). Interestingly, RAN treatment improves glycemia and reverses glucose intolerance in murine models of metabolic alterations without modifying body weight development (Batran et al., 2019; Ning et al., 2011).
It is noteworthy that treatment efficacy followed the trend of expression/activation of muscle metabolic markers. Indeed, after 30 days of treatment with RAN, SLN was markedly downregulated and CaMKII and AMPK were inactivated by dephosphorylation, whereas the AMPK target, ACC, was dephosphorylated and hence reactivated (Figures 8A and 8B). Similarly, expression levels of mRNAs encoding myosin sub-types and SERCA pumps were decreased in response to RAN (Figure 8C), whereas mRNAs encoding Nor1 and Glut4 returned to levels similar to that observed in wild-type control mice (Figure 8C). In line
Patient Age (years)
Sex ALS Mutation Months from Diagnosis
Muscle (Biopsies Were Done on Limb Muscle where the Disease Began)
Patient Information
1 47 F SOD1D90A 12 soleus dx Spinal onset
2 72 F Sporadic 42 vastus lateralis dx Spinal onset
3 50 M VCP mutation 54 vastus lateralis dx Spinal onset with IBM
(inclusion body myositis) and Paget’s disease
4 62 F C9ORF72 (58
repeats)
33 soleus dx Spinal onset with
progressive muscle atrophy
5 77 F Sporadic 19 vastus lateralis dx Spinal onset
6 71 F Sporadic 14 rectus femoris dx N/A
with RAN’s known mechanism of action in improving glucose metabolism, fluorometric determination of total ATP content showed a net increase in ATP concentration in the TA from symptomatic, 120-day-old SOD1G93Amice when compared with their wild-type control littermates (Figure 8D).
Given that progressive changes in muscle metabolic markers in SOD1G93Amice occurred alongside the
presentation of hypermetabolism, we next aimed to determine whether RAN would attenuate hyperme-tabolism in SOD1G93A mice. Indeed, indirect calorimetry analysis showed that hypermetabolism was
partially abrogated after treatment with RAN (Figures 8E and 8F). RAN restored EE (Figure 8G) and REE (Figure 8H) but had no effect on RER (Figure 8I). Surprisingly, the weakening of RAN effects during the end stage of the disease was paralleled with an increase in the expression of SLN, the reactivation of CaM-KII and AMPK, and thus ACC inactivation (Figures 8, 8J, and 8K). Overall, these results show that decreasing EE is linked to an improvement in grip strength in SOD1G93Amice. Our data highlight the potential
rele-vance of pharmacological interventions aimed at counteracting hypermetabolism in ALS.
DISCUSSION
In this study, we detail the existence of early events responsible for the remodeling of myofiber-type composition and defective energy metabolism in the SOD1G93Amouse model of ALS. Our observations
are in agreement with previous work demonstrating a shift in fast-to-slow muscle fiber type composition (Peggion et al., 2017), as well as aberrant mitochondrial metabolism (Salvatori et al., 2017) and alterations in muscle glucose metabolism in response to muscle-restricted overexpression of SOD1G93A(Dobrowolny
et al., 2008, 2018). Moreover, in line with the derangement in whole-body EE that we identified in symptom-atic SOD1G93Amice, hypermetabolism has been described in many patients with ALS (Bouteloup et al.,
2009; Desport et al., 2005; Funalot et al., 2009; Je´sus et al., 2018; Steyn et al., 2018) and often associated with dyslipidemia (Dupuis et al., 2008). Notably, prognosis is less favorable in hypermetabolic patients (Steyn et al., 2018), whereas dyslipidemia/hyperlipidemia may confer protection and increase survival ( Du-puis et al., 2008).
Given that skeletal muscle is a major determinant of whole-body energy metabolism (Zurlo et al., 1990), we focused our investigation on the contribution of skeletal muscle to SOD1G93A metabolic
dysfunction. Indeed, we found some prodromal molecular signatures of oxidative metabolism at 55 days of age, including an initial increase in NADH-TR and SDH activities and an increase in mito-chondrial mass in fast-twitch glycolytic muscles. Thus, we identified a fast-to-slow skeletal muscle fiber transition in the early presymptomatic stage; this pathological rearrangement of muscle phenotype might partially account for the marked increase of fatty acid b-oxidation observed before disease onset. However, according to previous evidence (Doshi et al., 2017), hypermetabolism occurs in SOD1 G93A mice only at a symptomatic stage of the disease, whereas it is undetectable at 55 days of age. It should be considered that, around 55 days of postnatal life, the skeletal muscle of SOD1 G93A mice are not yet fully oxidative.
Skeletal muscle is a dynamic tissue that is highly adaptable to environmental changes and to alter-ations in energy need. Physical exercise is a key modulator of muscle plasticity, as enduring contractile activity, it is a powerful stimulus for enhancing mitochondrial biogenesis (Hood, 2009). This condition upregulates mitochondrial enzymes involved in fatty acid b-oxidation (Lundsgaard et al., 2018) to pro-mote myofiber switching from fast (glycolytic) to slow (oxidative) fiber types (Flu¨ck, 2006). In this view, the muscle alterations that we have observed in SOD1G93Amice appear to mimic a state of
long-last-ing endurance exercise. Indeed, Palamiuc et al. (2015) have previously reported increased endurance capacity in SOD1G86Rmice at an advanced phase of disease. Although it remains unknown as to why
RAN Dose (mg/kg) WT (mM) SOD1G93A
(mM)
25 0.63G 0.16 0.79G 0.11
50 1.22G 0.20 1.30G 0.18
100 3.33G 0.21 2.87G 0.17
Table 2. HPLC Determination of Ranolazine (RAN) Plasma Concentrations 12 h after i.p. Administration of Ranolazine at 25, 50, or 100 mg/kg
there is a shift in muscle fiber type, and enhanced fatty acid utilization in the absence of environ-mental pressure and/or physical exercise in SOD1G93A mice, this exercise-mimetic phenotype may be associated with aberrant energy needs that may be associated with early mitochondrial dysfunction and/or SLN overexpression.
Mitochondrial Dysfunction
In light of the critical role that mitochondria play in muscle metabolism and plasticity, it is conceivable that early alterations in muscle mitochondria might contribute to altered energy homeostasis in ALS. In agree-ment with this hypothesis, we report mitochondrial impairagree-ments in skeletal muscle in early presymptomatic SOD1G93Amice, which occur prior to the presentation of motor symptoms. Recently, an association
be-tween myopathy and defective mitochondrial function has been described in a different ALS mouse model
Figure 7. Ranolazine Improves Locomotor Abilities but Does Not Affect Survival
(A) Locomotor abilities of SOD1G93Amice receiving daily intraperitoneal injections of Ranolazine 50 mg/kg (SOD1G93A
RAN) or physiological solution (SOD1G93A) evaluated by hanging grid test at the indicated days. Performance was
evaluated from 90 days of age (start of treatment) to the end stage of disease. Data are presented as meanG SEM, *p <
0.05 **p < 0.001 ***p < 0.0001 when compared with age-matched SOD1G93Auntreated mice, and#p < 0.05##p < 0.01
###p < 0.0001 when compared with SOD1G93Amice at the beginning of treatment. (n = 12 SOD1G93A, n = 12 SOD1G93A+
RAN).
(B) Kaplan-Meier survival curve of SOD1G93Amice and their wild-type control littermates (WT) receiving daily
intraperitoneal injections of Ranolazine 50 mg/kg (SOD1G93ARAN and WT RAN) or physiological solution (SOD1G93Aand
WT). p Values were obtained using parametric two-way ANOVA with Bonferroni post hoc test (A) or one-way ANOVA with Bonferroni post hoc test (B).
(Genin et al., 2019), thus underlining the importance of muscle bioenergetics in neuron motor disease. In line with premature atrophy and loss of function of fast-twitch fibers (Hegedus et al., 2008; Palamiuc et al., 2015; Peggion et al., 2017), we detected early mitochondrial metabolic alterations in glycolytic EDL, TA, and GNM but not in oxidative soleus. Interestingly, skeletal muscle satellite cells isolated from early pre-symptomatic SOD1G93Amice also exhibited defective bioenergetic profiles. The drop in energy
produc-tion in these skeletal muscle stem cells and their inability to respond to metabolic changes might affect muscle regeneration in response to denervation as previously described in ALS pathology (Tsitkanou et al., 2016; Yin et al., 2013).
We found an early impairment of Complex I activity in skeletal muscle of SOD1G93Amice. An impairment of
Complex I activity has previously been described in muscle biopsies from patients with sporadic ALS ( Wie-demann et al., 1998). Moreover, functional alterations of the Complex I has been observed in GNM isolated from SOD1G93Amice at 7 weeks of age (Capitanio et al., 2012). Collectively, these observations corroborate the hypothesis that, in patients with ALS (Ghiasi et al., 2012) and in preclinical models (Salvatori et al., 2018; Wang et al., 2016), Complex I activity is a selective target of different ALS-related proteins. Complex I can be considered as an energy-transducing enzyme whose activity regulates cell energy request and activates catabolic pathways following the failure of its activity (Hunter et al., 2018; Leonard et al., 2017). Accordingly, pharmacological inhibition or a failure in Complex I activity triggers the activation of the AMPK (Hu et al., 2017; Hunter et al., 2018). AMPK activation promotes catabolic pathways, such as lipid oxidation in skeletal muscle (Merrill et al., 1997; O’Neill et al., 2013). This known action of AMPK is in line with the increase in lipid oxidation and inhibition of glucose utilization that we observed here in early presymptomatic mice. In the context of ALS, mitochondrial failure could drive an increase in the use of lipids as primary fuel substrate to compensate for energy deficit and a decline in ATP synthesis. Subsequent to this, excess ROS generation as a result of excessive mitochondrial lipid oxidation may further aggravate mitochondrial dysfunction ( Qui-jano et al., 2016; Rosca et al., 2012).
SLN Overexpression
SLN is a micropeptide inhibitor of SERCA activity that uncouples Ca2+transport from ATP hydrolysis (Bal
et al., 2012; Smith et al., 2002). Thus, SLN has a critical role in determining metabolic rate, EE, and muscle-derived thermogenesis (Bal et al., 2012; Maurya and Periasamy, 2015; Maurya et al., 2018). Notably, selec-tive SLN overexpression in fast-twitch glycolytic muscle has been shown to reprogram mitochondria and induce an oxidative phenotype (Maurya et al., 2018). The expression of SLN is tightly regulated during development, and in rodents, its expression is detectable in skeletal muscle during late embryonic
Mid-term evaluation (120 days) of SOD1G93Amice receiving daily RAN (50 mg/kg i.p.) from 90 days of age.
(A) Western blot analysis of SLN, pCaMKII, CaMKII, pAMPK, AMPK, pACC, and ACC in the tibialis anterior (TA) of SOD1G93Amice (+) and wild-type control
littermates ( ) receiving daily RAN (+) or vehicle ( ) at 120 days of age. GAPDH was used as loading control.
(B) Densitometric analysis of data obtained in (A). Data are presented as meanG SEM, *p < 0.05, **p < 0.001 when compared with wild-type untreated mice
(arbitrarily set on at 1) and#p < 0.05##p < 0.001 when compared with SOD1G93Auntreated mice (n = 6 independent experiments), parametric one-way
ANOVA and a Bonferroni post hoc test.
(C) Expression of mRNAs coding for Nor1, Glut4, Serca1, Serca2a, Serca2b, MyHCI, MyHCIIa, MyHCIIx, MyHCIIb in the TA of SOD1G93Amice and wild-type
control littermates treated with RAN (SOD1G93A,RAN and WT RAN) or not treated with RAN (SOD1G93Aand WT) at 120 days of age (n = 4 for each genotype/
treatment). Data are presented as meanG SEM, **p < 0.001 when compared with wild-type untreated mice (arbitrarily set on at 1) and#p < 0.05 when
compared with SOD1G93Auntreated mice (n = 6 independent experiments), parametric one-way ANOVA and a Bonferroni post hoc test.
(D) Fluorometric measurement of total ATP in the TA of SOD1G93Amice and wild-type control littermates receiving daily RAN (+) or vehicle ( ) at 120 days of
age. Data were analyzed by one-way ANOVA with multiple comparisons using Dunnet’s t test and Tukey’s HSD (Honestly Significantly Different) post hoc
test. Data presented as meanG SEM, ***p < 0.0001 when compared with WT untreated mice and##p < 0.001 when compared with SOD1G93Auntreated mice
(n = 4 independent experiments).
(E) Energy expenditure profile (EE) of WT and SOD1G93Atreated with RAN or vehicle at 120 days of age. Black bar indicates the dark cycle period.
(F–H) (F) Percentage of increase in EE between 55 and 120days of age, and effects of RAN treatment (initiation of treatment marked with an arrow) from day
90 onward. Mean of (G) EE and (H) Resting EE (REE) obtained from WT and SOD1G93Amice in (E). Data are presented as meanG SEM, ***p < 0.0001 when
compared with WT mice;###p < 0.0001 when compared with SOD1G93Amice (at least n = 4 animals), two-way ANOVA with Tukey post hoc test.
(I–K) (I) Respiratory exchange ratio (RER) demonstrating the extent of lipid versus carbohydrate oxidation. Data are presented as meanG SEM, ***p < 0.0001
when compared with WT mice; (at least n = 4 animals), two-way ANOVA with Tukey post hoc test. Long-term evaluation (150 days) of RAN treatment started
at 90 days of age: (J) western blot analysis of SLN, pCaMKII, CaMKII, pAMPK, AMPK, pACC, and ACC in the TA of SOD1G93A(+) and wild-type ( )
RAN-treated (+) or unRAN-treated ( ) mice. GAPDH was used as loading control. (K) Densitometric analysis of data in (I). Data are presented as meanG SEM,
**p < 0.001 when compared with WT untreated mice (arbitrarily set on at 1) and#p < 0.05 when compared with SOD1G93Auntreated (n = 6 independent
development and early neonatal life (Babu et al., 2007). Accordingly, in control mice SLN expression was downregulated in glycolytic muscle by postnatal day 15, whereas its expression was highly upregulated in the same muscle during the entire life course of SOD1G93Amice. More interestingly, we found marked
SLN overexpression in muscle biopsies from patients affected by genetic and sporadic forms of ALS. Although SLN has already been viewed as a feasible prognostic or early diagnostic biomarker in ALS, its upregulation has been associated with disease-specific denervation (Calvo et al., 2012) rather than specific metabolic signatures. In contrast to this, our results indicate that SLN is overexpressed before the upregu-lation of any denervation markers. Although our data do not pinpoint SLN upreguupregu-lation as being the pri-mary ‘‘source’’ of hypermetabolism in ALS, early mitochondrial failure and energy deficit could underlie SLN overexpression and activate compensatory oxidative metabolism. Indeed, SLN plays a central role in the adaptive mechanisms that couple increased energy request (e.g., diet-induced obesity), cold accli-matization, and exercise with mitochondrial ATP and energy production (Maurya et al., 2018). Thus, the in-crease of SLN expression in ALS might represent a classical adaptation to inin-creased energy demand, lead-ing to a shift in substrate utilization, mitochondrial biogenesis, and oxidative metabolism in glycolytic muscle.
RAN Treatment
To determine whether decreasing energy demand and re-balancing substrate utilization might be of benefit in ALS, we aimed to assess the potential therapeutic role of RAN, an FDA-approved fatty acid oxidation inhibitor that is used for the management of cardiac dysfunction (Bhandari and Subramanian, 2007; Stanley, 2002). We demonstrate that chronic RAN treatment in SOD1G93Amice significantly improves
motor function in SOD1G93Aby slowing the decline in muscle strength over a 6-week treatment period.
Moreover, during mid-term treatment evaluation (120 days of age), we found that RAN attenuated exces-sive whole-body EE in SOD1G93Amice, and although it did not offset increased fatty acidb-oxidation, RAN
treatment improved energy metabolism by increasing muscle ATP content.
Interestingly, we found that, by the end stage of disease (at 150 days), RAN had lost its efficacy and there was a re-emergence of hypermetabolism. It should be noted that, in patients with stable angina pectoris, the recommended posology includes the escalation of drug dosage during therapy (www.ema.europa.eu/ ema/index.jsp?curl=pages/medicines/human/medicines/000805/human_med_001009.
jsp&mid=WC0b01ac058001d124). This suggests that the re-emergence of pathology at the end stage of disease in SOD1G93Amice may be attributed to the loss of RAN efficacy rather than disease exacerbation. Of interest, RAN also acts as an inhibitor of late inward sodium currents (IpNa) during cardiac repolarization (Belardinelli et al., 2013). Hence, we cannot rule out that sodium channel facilitation of membrane repolar-ization might decrease cell energy demand to compensate for mitochondrial failure in skeletal muscle and neurons of SOD1G93Amice.
Conclusions
Our study provides compelling evidence to demonstrate specific metabolic dysfunction and mitochondrial failure as early pathophysiological events in ALS. Here, we may consider that a slight drop in ATP produc-tion via mitochondrial impairment or SLN overexpression may become pathologically relevant when en-ergy demand increases as a result of lifestyle changes or during aging. In this scenario, a timely pharmaco-logical intervention impinging on hypermetabolism may be a promising therapeutic option to improve quality of life.
Limitations of the Study
In this study we use an FDA-approved drug, Ranolazine, to counteract hypermetabolism in an ALS mouse model. In our hands, Ranolazine ameliorates locomotor symptoms of fully symptomatic ALS mice, but its effect is temporary. In this regard, RAN does not improve life span in SOD1G93Amice. Given that we
have observed temporary restoration and recovery of metabolic indicators, the loss of effectiveness of Ra-nolazine requires further investigation through extended pharmacokinetics and pharmacodynamics studies. From our study, we provide proof of concept that hypermetabolism appears to be considered a viable therapeutic target in ALS. As such, alternate drugs that are known to modulate metabolism should also be considered.
METHODS
All methods can be found in the accompanyingTransparent Methods supplemental file.
SUPPLEMENTAL INFORMATION
Supplemental Information can be found online athttps://doi.org/10.1016/j.isci.2020.101087.
ACKNOWLEDGMENTS
This work was supported by AriSLA through HyperALS project (A.F.); Telethon project n. 2018; AFM-Telethon project n. 21021 (J.P.L. and A.F.); the National Health and Medical Research Council (1101085 and 1185427 to F.J.S. and S.T.N.); Scott Sullivan MND Research Fellowship (Queensland Brain Institute, the Royal Brisbane & Women’s Hospital Foundation, The MND and Me Foundation) (S.T.N.); and Australian Institute for Bioengineering and Nanotechnology (S.T.N.).
This work is dedicated to the memory of our dear Mentor and Friend Maria Teresa Carrı`.
AUTHOR CONTRIBUTIONS
S.S. and I.S. designed and performed experiments. R.C. designed and G.G. performed the indirect calo-rimetry experiments. E.F., L.M., C.Q., and D.P. performed histological analysis. C.H. performed bioinfor-matics analyses, M.R. performed experiments on cells. S.R., E.F., and L.M. expanded and completed the study. S.B., N.V., and F.G. provided clinical samples. J.P.L., F.R., F.J.S., R.C., E.F., L.M., and S.T.N. designed the experiments and critically revised the manuscript. A.F. and C.V. designed the study and wrote the paper.
DECLARATION OF INTERESTS
The authors declare that they have no conflict of interest.
Received: October 22, 2019 Revised: March 13, 2020 Accepted: April 15, 2020 Published: May 22, 2020
REFERENCES
Anderson, D.M., Makarewich, C.A., Anderson, K.M., Shelton, J.M., Bezprozvannaya, S., Bassel-Duby, R., and Olson, E.N. (2016). Widespread control of calcium signaling by a family of SERCA-inhibiting micropeptides. Sci. Signal. 9, ra119. Babu, G.J., Bhupathy, P., Carnes, C.A., Billman, G.E., and Periasamy, M. (2007). Differential expression of sarcolipin protein during muscle development and cardiac pathophysiology. J. Mol. Cell. Cardiol. 43, 215–222.
Bal, N.C., Maurya, S.K., Sopariwala, D.H., Sahoo, S.K., Gupta, S.C., Shaikh, S.A., Pant, M., Rowland, L.A., Goonasekera, S.A., Molkentin, J.D., et al. (2012). Sarcolipin is a newly identified regulator of muscle-based thermogenesis in mammals. Nat. Med. 18, 1575–1579.
Batran, R. Al, Gopal, K., Aburasayn, H., Eshreif, A., Almutairi, M., Greenwell, A.A., Campbell, S.A., Saleme, B., Court, E.A., Eaton, F., et al. (2019). The antianginal ranolazine mitigates obesity-induced nonalcoholic fatty liver disease and increases hepatic pyruvate dehydrogenase activity. JCI Insight 4, e124643.
Belardinelli, Liu, Smith-Maxwell, Wang, El-Bizri, Hirakawa, Karpinski, Li, Hu, Li, Crumb, Wu, Koltun, Zablocki, Yao, Dhalla, Rajamani, and
Shryock. (2013). J. Pharmacol. Exp Ther.https://
doi.org/10.1124/jpet.112.198887.
Bhandari, B., and Subramanian, L. (2007). Ranolazine, a partial fatty acid oxidation inhibitor, its potential benefit in angina and other cardiovascular disorders. Recent Pat. Cardiovasc. Drug Discov. 2, 35–39.
Bouteloup, C., Desport, J.-C., Clavelou, P., Guy, N., Derumeaux-Burel, H., Ferrier, A., and Couratier, P. (2009). Hypermetabolism in ALS patients: an early and persistent phenomenon. J. Neurol. 256, 1236–1242.
Calvo, A.C., Manzano, R., Atencia-Cibreiro, G., Oliva´n, S., Mun˜oz, M.J., Zaragoza, P., Cordero-Va´zquez, P., Esteban-Pe´rez, J., Garcı´a-Redondo, A., and Osta, R. (2012). Genetic biomarkers for ALS disease in transgenic SOD1(G93A) mice. PLoS One 7, e32632.
Capitanio, D., Vasso, M., Ratti, A., Grignaschi, G., Volta, M., Moriggi, M., Daleno, C., Bendotti, C., Silani, V., and Gelfi, C. (2012). Molecular signatures of amyotrophic lateral sclerosis disease progression in hind and forelimb muscles of an SOD1G93A mouse model. Antioxid. Redox Signal. 17, 1333–1350.
Desport, J.-C., Torny, F., Lacoste, M., Preux, P.-M., and Couratier, P. (2005). Hypermetabolism in ALS: correlations with clinical and paraclinical parameters. Neurodegener. Dis. 2, 202–207. Dobrowolny, G., Aucello, M., Rizzuto, E., Beccafico, S., Mammucari, C., Boncompagni, S., Bonconpagni, S., Belia, S., Wannenes, F., Nicoletti, C., et al. (2008). Skeletal muscle is a primary target of SOD1G93A-mediated toxicity. Cell Metab. 8, 425–436.
Dobrowolny, G., Lepore, E., Martini, M., Barberi, L., Nunn, A., Scicchitano, B.M., and Musaro`, A. (2018). Metabolic changes associated with muscle expression of SOD1 (G93A). Front. Physiol. 9, 831.
Doshi, S., Gupta, P., and Kalb, R.G. (2017). Genetic induction of hypometabolism by ablation of MC4R does not suppress ALS-like phenotypes in the G93A mutant SOD1 mouse model. Sci. Rep. 7, 13150.
Dupuis, L., Corcia, P., Fergani, A., Gonzalez De Aguilar, J.L., Bonnefont-Rousselot, D., Bittar, R., Seilhean, D., Hauw, J.J., Lacomblez, L., Loeffler, J.P., et al. (2008). Dyslipidemia is a protective factor in amyotrophic lateral sclerosis symbol. Neurology 70, 1004–1009.
Fajardo, V.A., Rietze, B.A., Chambers, P.J., Bellissimo, C., Bombardier, E., Quadrilatero, J., and Tupling, A.R. (2017). Effects of sarcolipin deletion on skeletal muscle adaptive responses to functional overload and unload. Am. J. Physiol. Cell Physiol. 313, C154–C161.
Flu¨ck, M. (2006). Functional, structural and molecular plasticity of mammalian skeletal muscle in response to exercise stimuli. J. Exp. Biol. 209, 2239–2248.
Funalot, B., Desport, J.-C., Sturtz, F., Camu, W., and Couratier, P. (2009). High metabolic level in patients with familial amyotrophic lateral sclerosis. Amyotroph. Lateral Scler. 10, 113–117. Genin, E.C., Madji Hounoum, B., Bannwarth, S., Fragaki, K., Lacas-Gervais, S., Mauri-Crouzet, A., Lespinasse, F., Neveu, J., Ropert, B., Auge´, G., et al. (2019). Mitochondrial defect in muscle precedes neuromuscular junction degeneration and motor neuron death in CHCHD10 S59L/+ mouse. Acta Neuropathol. 138, 123–145. Ghiasi, P., Hosseinkhani, S., Noori, A., Nafissi, S., and Khajeh, K. (2012). Mitochondrial complex I deficiency and ATP/ADP ratio in lymphocytes of amyotrophic lateral sclerosis patients. Neurol. Res. 34, 297–303.
Goode, J.M., Pearen, M.A., Tuong, Z.K., Wang, S.C.M., Oh, T.G., Shao, E.X., and Muscat, G.E.O. (2016). The nuclear receptor, Nor-1, induces the physiological responses associated with exercise. Mol. Endocrinol. 30, 660–676.
Granata, C., Jamnick, N.A., and Bishop, D.J. (2018). Training-induced changes in
mitochondrial content and respiratory function in human skeletal muscle. Sports Med. 48, 1809– 1828.
Hardie, D.G., Schaffer, B.E., and Brunet, A. (2016). AMPK: an energy-sensing pathway with multiple inputs and outputs. Trends Cell Biol. 26, 190–201. Hegedus, J., Putman, C.T., Tyreman, N., and Gordon, T. (2008). Preferential motor unit loss in the SOD1 G93A transgenic mouse model of amyotrophic lateral sclerosis. J. Physiol. 586, 3337–3351.
Hood, D.A. (2009). Mechanisms of exercise-induced mitochondrial biogenesis in skeletal muscle. Appl. Physiol. Nutr. Metab. 34, 465–472. Hu, R., Yan, H., Fei, X., Liu, H., and Wu, J. (2017). Modulation of glucose metabolism by a natural compound from Chloranthus japonicus via activation of AMP-activated protein kinase. Sci. Rep. 7, 778.
Hunter, R.W., Hughey, C.C., Lantier, L., Sundelin, E.I., Peggie, M., Zeqiraj, E., Sicheri, F., Jessen, N., Wasserman, D.H., and Sakamoto, K. (2018). Metformin reduces liver glucose production by inhibition of fructose-1-6-bisphosphatase. Nat. Med. 24, 1395–1406.
Ioannides, Z.A., Ngo, T., and Henderson, D. (2016). Altered metabolic homeostasis in amyotrophic lateral sclerosis: mechanisms of energy imbalance and contribution to disease progression. Neurodegener. Dis. 16, 382–397. Je´sus, P., Fayemendy, P., Nicol, M., Lautrette, G., Sourisseau, H., Preux, P.-M., Desport, J.-C., Marin, B., and Couratier, P. (2018).
Hypermetabolism is a deleterious prognostic factor in patients with amyotrophic lateral sclerosis. Eur. J. Neurol. 25, 97–104.
Kasarskis, E.J., Mendiondo, M.S., Matthews, D.E., Mitsumoto, H., Tandan, R., Simmons, Z., Bromberg, M.B., and Kryscio, R.J. (2014). Estimating daily energy expenditure in individuals with amyotrophic lateral sclerosis. Am. J. Clin. Nutr. 99, 792–803.
Leonard, S., Tobin, L.M., and Findlay, J.B.C. (2017). The signalling mechanisms of a novel mitochondrial complex I inhibitor prevent lipid accumulation and attenuate TNF-a-induced insulin resistance in vitro. Eur. J. Pharmacol. 800, 1–8.
Lundsgaard, A.-M., Fritzen, A.M., and Kiens, B. (2018). Molecular regulation of fatty acid oxidation in skeletal muscle during aerobic exercise. Trends Endocrinol. Metab. 29, 18–30. Maurya, S.K., and Periasamy, M. (2015). Sarcolipin is a novel regulator of muscle metabolism and obesity. Pharmacol. Res. 102, 270–275. Maurya, S.K., Herrera, J.L., Sahoo, S.K., Reis, F.C.G., Vega, R.B., Kelly, D.P., and Periasamy, M. (2018). Sarcolipin signaling promotes
mitochondrial biogenesis and oxidative metabolism in skeletal muscle. Cell Rep. 24, 2919–2931.
McCormack, J.G., Stanley, W.C., and Wolff, A.A. (1998). Ranolazine: a novel metabolic modulator for the treatment of angina. Gen. Pharmacol. 30, 639–645.
Mejzini, R., Flynn, L.L., Pitout, I.L., Fletcher, S., Wilton, S.D., and Akkari, P.A. (2019). ALS genetics, mechanisms, and therapeutics: where are we now? Front. Neurosci. 13, 1310. Merrill, G.F., Kurth, E.J., Hardie, D.G., and Winder, W.W. (1997). AICA riboside increases AMP-activated protein kinase, fatty acid oxidation, and glucose uptake in rat muscle. Am. J. Physiol. Endocrinol. Metab. 273, E1107–E1112. Moglia, C., Calvo, A., Grassano, M., Canosa, A., Manera, U., D’ovidio, F., Bombaci, A., Bersano, E., Mazzini, L., Mora, G., et al. (2019). Early weight loss in amyotrophic lateral sclerosis: outcome relevance and clinical correlates in a population-based cohort. J. Neurol. Neurosurg. Psychiatry 90, 666–673.
Ning, Y., Zhen, W., Fu, Z., Jiang, J., Liu, D., Belardinelli, L., and Dhalla, A.K. (2011). Ranolazine increasesb-cell survival and improves glucose homeostasis in low-dose streptozotocin-induced diabetes in mice. J. Pharmacol. Exp. Ther. 337, 50–58.
O’Neill, H.M., Holloway, G.P., and Steinberg, G.R. (2013). AMPK regulation of fatty acid metabolism and mitochondrial biogenesis: implications for obesity. Mol. Cell. Endocrinol. 366, 135–151. Palamiuc, L., Schlagowski, A., Ngo, S.T., Vernay, A., Dirrig-Grosch, S., Henriques, A., Boutillier, A.-L., Zoll, J., Echaniz-Laguna, A., Loeffler, J.-P., et al. (2015). A metabolic switch toward lipid use in glycolytic muscle is an early pathologic event in a mouse model of amyotrophic lateral sclerosis. EMBO Mol. Med. 7, 526–546.
Patel, V.D., and Hasumati, R. (2015). Ranolazine: a review on analytical method and its
determination in synthetic mixture. Asian J. Pharm. Anal. 5, 214.
Pearen, M.A., Goode, J.M., Fitzsimmons, R.L., Eriksson, N.A., Thomas, G.P., Cowin, G.J., Mary Wang, S.C., Tuong, Z.K., and Muscat, G.E.O. (2013). Transgenic muscle-specific Nor-1 expression regulates multiple pathways that effect adiposity, metabolism, and endurance. Mol. Endocrinol. 27, 1897–1917.
Peggion, C., Massimino, M.L., Biancotto, G., Angeletti, R., Reggiani, C., Sorgato, M.C., Bertoli, A., Stella, R., and Stella, R. (2017). Absolute quantification of myosin heavy chain isoforms by selected reaction monitoring can underscore skeletal muscle changes in a mouse model of amyotrophic lateral sclerosis. Anal. Bioanal. Chem. 409, 2143–2153.
Quijano, C., Trujillo, M., Castro, L., and Trostchansky, A. (2016). Interplay between oxidant species and energy metabolism. Redox Biol. 8, 28–42.
Rosca, M.G., Vazquez, E.J., Chen, Q., Kerner, J., Kern, T.S., and Hoppel, C.L. (2012). Oxidation of fatty acids is the source of increased
mitochondrial reactive oxygen species production in kidney cortical tubules in early diabetes. Diabetes 61, 2074–2083.
Rossi, S., Serrano, A., Gerbino, V., Giorgi, A., Di Francesco, L., Nencini, M., Bozzo, F., Schinina`, M.E., Bagni, C., Cestra, G., et al. (2015). Nuclear accumulation of mRNAs underlies G4C2-repeat-induced translational repression in a cellular model of C9orf72 ALS. J. Cell Sci. 128, 1787–1799. Salvatori, I., Valle, C., Ferri, A., and Carrı`, M.T. (2017). SIRT3 and mitochondrial metabolism in neurodegenerative diseases. Neurochem. Int. 109, 184–192.
Salvatori, I., Ferri, A., Scaricamazza, S., Giovannelli, I., Serrano, A., Rossi, S., D’Ambrosi, N., Cozzolino, M., Di Giulio, A., Moreno, S., et al. (2018). Differential toxicity of TAR DNA-binding protein 43 isoforms depends on their submitochondrial localization in neuronal cells. J. Neurochem. 146, 585–597.
Smith, W.S., Broadbridge, R., East, J.M., and Lee, A.G. (2002). Sarcolipin uncouples hydrolysis of ATP from accumulation of Ca2+ by the Ca2+-ATPase of skeletal-muscle sarcoplasmic reticulum. Biochem. J. 361, 277–286. Stanley, W.C. (2002). Partial fatty acid oxidation inhibitors for stable angina. Expert Opin. Investig. Drugs 11, 615–629.
Steyn, F.J., Ioannides, Z.A., Van Eijk, R.P.A., Heggie, S., Thorpe, K.A., Ceslis, A., Heshmat, S., Henders, A.K., Wray, N.R., Van Den Berg, L.H., et al. (2018). Hypermetabolism in ALS is associated with greater functional decline and shorter survival. J. Neurol. Neurosurg. Psychiatry 89, 1016–1023.
Thomas, H.E., Zhang, Y., Stefely, J.A., Veiga, S.R., Thomas, G., Kozma, S.C., and Mercer, C.A. (2018). Mitochondrial complex I activity is required for maximal autophagy. Cell Rep. 24, 2404–2417.e8. Tintignac, L.A., Brenner, H.R., and Ru¨egg, M.A. (2015). Mechanisms regulating neuromuscular
muscle wasting. Physiol. Rev. 95, 809–852. Tsitkanou, S., Gatta, P.A.D., and Russell, A.P. (2016). Skeletal muscle satellite cells,
mitochondria, and MicroRNAs: their involvement in the pathogenesis of ALS. Front. Physiol. 7, 403. Wang, W., Wang, L., Lu, J., Siedlak, S.L., Fujioka, H., Liang, J., Jiang, S., Ma, X., Jiang, Z., Da Rocha, E.L., et al. (2016). The inhibition of TDP-43
toxicity. Nat. Med. 22, 869–878.
Widmann, M., Nieß, A.M., and Munz, B. (2019). Physical exercise and epigenetic modifications in skeletal muscle. Sports Med. 49, 509–523. Wiedemann, F.R., Winkler, K., Kuznetsov, A.V., Bartels, C., Vielhaber, S., Feistner, H., and Kunz, W.S. (1998). Impairment of mitochondrial function in skeletal muscle of patients with
156, 65–72.
Yin, H., Price, F., and Rudnicki, M.A. (2013). Satellite cells and the muscle stem cell niche. Physiol. Rev. 93, 23–67.
Zurlo, F., Larson, K., Bogardus, C., and Ravussin, E. (1990). Skeletal muscle metabolism is a major determinant of resting energy expenditure. J. Clin. Invest. 86, 1423–1427.
Supplemental Information
Skeletal-Muscle Metabolic Reprogramming
in ALS-SOD1
G93A
Mice Predates Disease Onset
and Is A Promising Therapeutic Target
Silvia
Scaricamazza,
Illari
Salvatori,
Giacomo
Giacovazzo,
Jean
Philippe
Loef
fler, Frederique Renè, Marco Rosina, Cyril Quessada, Daisy Proietti, Constantin
Heil, Simona Rossi, Stefania Battistini, Fabio Giannini, Nila Volpi, Frederik J.
Steyn, Shyuan T. Ngo, Elisabetta Ferraro, Luca Madaro, Roberto Coccurello, Cristiana
Valle, and Alberto Ferri
B
Figure S1. Quantification of muscle oxidative markers, Related to Figure 2. (A-B) Percentages of the dark areas (Blue
for NADH-Tr activity and Purple for SDH activity, respectively) measured using ImageJ and normalized against total area.
(C) Percentages of the red areas (ATBP fluorescent signal) measured using ImageJ and normalized against total area.
Calculations were performed on tibialis anterior (TA) cryosections (3 for each mouse) from 3 to 4 different mice at each
age. Data presented as means
± SEM, **P<0,001, ***P<0,0001 with respect to wild-type control littermates at the same
age, unpaired Student’s t tes.
C 0% 20% 40% 60% 80% 100% 55 days SOD1G93A WT 90 days SOD1G93A WT 150 days SOD1G93A WT glycolytic oxidative 0% 3% 6% 9% 12% 15% 55 days SOD1G93A WT 90 days SOD1G93A WT 150 days SOD1G93A WT 18% % o f int e n sity ATPB ** *** *** 120% 0% 20% 40% 60% 80% 100%
glycolitic
oxidative
55 days
SOD1G93A WT90 days
SOD1G93A WT70 days
SOD1G93A WTSDH
150 days
SOD1G93A WT 120% 0% 20% 40% 60% 80% 100% glycolitic oxidative 55 days SOD1G93A WT 90 days SOD1G93A WT 70 days SOD1G93A WT SDH 150 days SOD1G93A WT ** *** *** *** 120% 0% 20% 40% 60% 80% 100% glycolitic oxidative 55 days SOD1G93A WT 90 days SOD1G93A WT 70 days SOD1G93A WT SDH 150 days SOD1G93A WT glycolytic oxidative55 days 70 days 90 days
55 days 90 days 120 days 150 days
µ g m ito ch o n d ria \ m g tissu e (% o f W T ) 0 50 100 150 200 *** ** *** *** µ g m ito ch o n d ria \ m g tissu e (% o f W T ) 0 50 100 150 200 ** *** *** *** 0 50 100 150 200 µ g m ito ch o n d ria \ m g tissu e (% o f W T ) B m t DN A / g e n o m ic DN A ( 0 1 2 3 ND3 ND5 COX3 *** *** ** ** *** *** *** *** *** ND3 ND5 COX3 0 1 2 3 4 *** *** ** *** *** * *** *** m t DN A / g e n o m ic DN A ( fo ld) Gastrocnemius ND5 COX3 0 1 2 3 4 *** *** ** ** * m t DNA/ g e n o m ic DNA (f o ld )
Extensor Digitorum Longus
m t DN A / g e n o m ic DN A ( fo ld) ND5 COX3 0 1 2 3 4 Soleus
Figure S2. The mass of mitochondria increases during disease course, Related to Figure 2. Mitochondrial amount
was determined at 55, 90, 120 and 150 days of age by assessing: (A) The ratio between ug of purified mitochondria and
mg of tissue used for purification; tibialis anterior (TA), gastrocnemius (GNM), extensor digitorum longus (EDL) and
soleus. Data are reported as percentage, with 100% being assigned to values obtained from age-matched wild-type
control mice (WT), n = 4 independent experiments. (B) Western blot analysis of cytosolic (CYTO), mitochondrial (MITO)
and nuclear (NUC) subcellular fractions obtained from the TA of WT mice from 55 to 150 days of age. Fractions were
verified for the presence of specific markers using antibodies against GADPH for the cytosolic fraction, VDAC for the
mitochondrial fraction and HDAC1 for the nuclear fraction. A representative immunoblot is shown. (C) RT‐qPCR
quantification of ND3, ND5 and COX3 genes encoded by mitochondrial DNA in the TA, GNM, EDL and soleus muscle.
Genomic DNA was used as internal standard and values of age-matched wild-type control mice was arbitrary set at 1.
Data are presented as mean ± SEM, *P<0,05, **P<0,001, ***P<0,0001, unpaired Student’s t test, n=4 different mice for
0 50 100 150 *** ** *** ** µ g m ito ch o n d ria \ m g tissu (% o f W T ) Gastrocnemius
Extensor Digitorum Longus
Soleus
CYTO MITO NUC
55 70 90 150 120 VDAC GADPH HDAC1 days 55 70 90 150 120 55 70 90 150 120 65kDa 32kDa 36kDa
OCR %
STATE 2 STATE 3 STATE 4o STATE 3u
0 20 40 60 80 * ** ** ** ** *** *** *** *** *** ** ** *** *** ** ** ** ** ** ***
Extensor Digitorum Longus
STATE 2 STATE 3 STATE 4o STATE 3u
** ** *** *** *** *** *** *** *** *** *** *** OCR % 0 20 40 60 80 100 120 Soleus
STATE 2 STATE 3 STATE 4o STATE 3u
OCR % 0 20 40 60 80 100 120
55 days 70 days 90 days 120 days 150 days
C ADP FCCP 200 150 100 0 OCR ( p m o l\ m 60 50 40 30 20 10 Time (minutes) 50 60 50 40 30 20 10 Time (minutes) 300 250 200 150 100 50 0 OCR ( p m o l\ m in) ADP FCCP Oligo Ant.A Soleus WT SOD1G93A 300 250 200 150 100 50 0 OCR ( p m o l\ m in ) 60 50 40 30 20 10 Time (minutes) ADP FCCP Oligo Ant.A Spinal Cord WT SOD1G93A 300 250 200 150 100 50 0 OCR ( p m o l\ m in ) 60 50 40 30 20 10 ADP Oligo FCCP Ant.A Gastrocnemius WT SOD1G93A Time (minutes) 60 50 40 30 20 10 Time (minutes) 0 300 250 200 150 100 50 OCR ( p m o l\ m in ) ADP FCCP Oligo Ant.A Extensor Digitorum Longus
WT SOD1G93A
Figure S3. Mitochondrial bioenergetic failure occurs in skeletal muscle of early presymptomatic SOD1 G93A mice,
Related to Figure 3. (A) Coupling assay on isolated mitochondria purified from different tissues of SOD1
G93Amice at the
indicated ages. Mitochondrial respiration stages are reported: basal respiration (State 2), maximally coupled respiration (State
3), respiration due to proton leak (State 4o) and maximal uncoupled respiration (State 3u). Data are expressed as % of Oxygen
Consumption Rate (OCR) and 100% was arbitrarily assigned to values obtained from age-matched wild-type mice. *P<0,05,
**P<0,001, ***P<0,0001, unpaired
Student’s t test. (B) Representative Coupling Assay profiles performed on mitochondria
isolated from the indicated tissues of 55 day old SOD1
G93Amice and their wild-type control littermates. The injection of ADP,
(-) (+) (-) (+) 480 1048 720 1236 242 90 DAYS 120 DAYS Complex I Complex Va Complex III Pseudo-complex C Complex IV Complex II Pseudo-complex A/B 146 kDa
pAMPK AMPK pACC GAPDH ACC CPT1 90 120 55 70 150 SOD1G93A 80 kDa 62 kDa 62 kDa 37 kDa 280 kDa 280 kDa - + GNM - + - + - + - + Days 0 1 2 3 4 55 70 90 120 150 Age (days) * * ** ** pAMPK/AMPK 1 2 0 3 4 P ro te in e x p re ss io n ( fo ld ) 0 1 2 3 4 5 Age (days) * * ** ** pACC/ACC 55 70 90 120 150 1 2 0 3 4 P ro te in e x p re s s ion ( fo ld) 5 0 1 2 3 4 Age (days) * * ** ** CPT1 55 70 90 120 150 1 2 0 3 4 P ro te in e x p re s s ion ( fo ld)