R E S E A R C H
Open Access
Rational design of modular circuits for gene
transcription: A test of the bottom-up approach
Francesca Ceroni
1,2*, Simone Furini
3, Emanuele Giordano
1,4, Silvio Cavalcanti
1,2†Abstract
Background: Most of synthetic circuits developed so far have been designed by an ad hoc approach, using a small number of components (i.e. LacI, TetR) and a trial and error strategy. We are at the point where an increasing number of modular, inter-changeable and well-characterized components is needed to expand the construction of synthetic devices and to allow a rational approach to the design.
Results: We used interchangeable modular biological parts to create a set of novel synthetic devices for
controlling gene transcription, and we developed a mathematical model of the modular circuits. Model parameters were identified by experimental measurements from a subset of modular combinations. The model revealed an unexpected feature of the lactose repressor system, i.e. a residual binding affinity for the operator site by induced lactose repressor molecules. Once this residual affinity was taken into account, the model properly reproduced the experimental data from the training set. The parameters identified in the training set allowed the prediction of the behavior of networks not included in the identification procedure.
Conclusions: This study provides new quantitative evidences that the use of independent and well-characterized biological parts and mathematical modeling, what is called a bottom-up approach to the construction of gene networks, can allow the design of new and different devices re-using the same modular parts.
Background
Synthetic biology has evolved to the point where the design of gene circuits with complex functionalities has become a real option [1]. Inside living cells, complex behaviors arise from molecular interplays in compli-cated regulatory networks. In the first instance, the abil-ity to isolate single elements from these regulatory networks and to use them as independent modules -makes synthetic biology possible [2]. Synthetic gene cir-cuits are thus created by assembling elementary mod-ules together. The increasing complexity of these synthetic gene networks asks for a rational approach to design gene circuits [3]. A possible strategy to tackle this complexity is the bottom-up approach [4-7]. In bot-tom-up design, the behavior of a complicated system is predicted from the characteristics of its elementary parts. Such a prediction requires well-characterized
mathematical models of these elementary parts, and of how they behave when assembled together. In the pre-sent study, we tested if it is possible to predict by mathematical modeling the behavior of a modular gene circuit, using as inputs the properties of its ele-mentary parts.
In the last decade, many elementary devices have been implemented both in prokaryotic and in eukaryotic cells [8-11], including logical gates [12], toggle switches [13], oscillators [14,15], band pass filters [14] and counters [16]. However, most of the circuits developed so far have been designed by an ad hoc approach, using speci-fic gene components and a trial and error strategy. In order to make the design of synthetic systems easier, great efforts are today directed to extend to synthetic biology the engineering concepts of standardization, modularity, and abstraction [17,18]. In this context, the Registry of Standard Biological Parts http://www.parts-registry.org, maintained by the Massachusetts Institute of Technology (MIT), distributes thousands of standard parts, named BioBricks. The BioBricks are only standar-dized in terms of how these individual parts can be
* Correspondence: [email protected] † Contributed equally
1
Laboratory of Cellular and Molecular Engineering, University of Bologna, I-47521 Cesena, Italy
Full list of author information is available at the end of the article
© 2010 Ceroni et al; licensee BioMed Central Ltd. This is an Open Access article distributed under the terms of the Creative Commons Attribution License (http://creativecommons.org/licenses/by/2.0), which permits unrestricted use, distribution, and reproduction in any medium, provided the original work is properly cited.
physically assembled into more complicated systems, whilst most of them remain not tested in terms of their functionality and biological behavior [19].
The option to use modular parts in large-scale networks will be highly facilitated by a detailed characterization of their functional properties shared by the synthetic biology community. This implies the standardization of tools, techniques, and measurement units used by different laboratories [19-21], and the definition of mathematical models for the single parts. In this direction, a repository of modular modeling components has recently been pub-lished to facilitate the mathematical modeling of biological parts, and to help the design process in synthetic biology [22]. Once mathematical models of the elementary com-ponents are available, the following step is to use them to predict the behavior of larger-scale networks. Only if the behavior of gene circuits can be predicted from the prop-erties of their elementary parts, a bottom-up design of syn-thetic devices is feasible [23]. While this remains a central problem of synthetic biology, few quantitative tests of how modular systems behave have been published. One exam-ple is the work by Ellis et al [24] where a library of regu-lated promoters is characterized and used to design more complicated networks with predictable outcomes. This quantitative study supports the case of a bottom-up approach to gene circuit design.
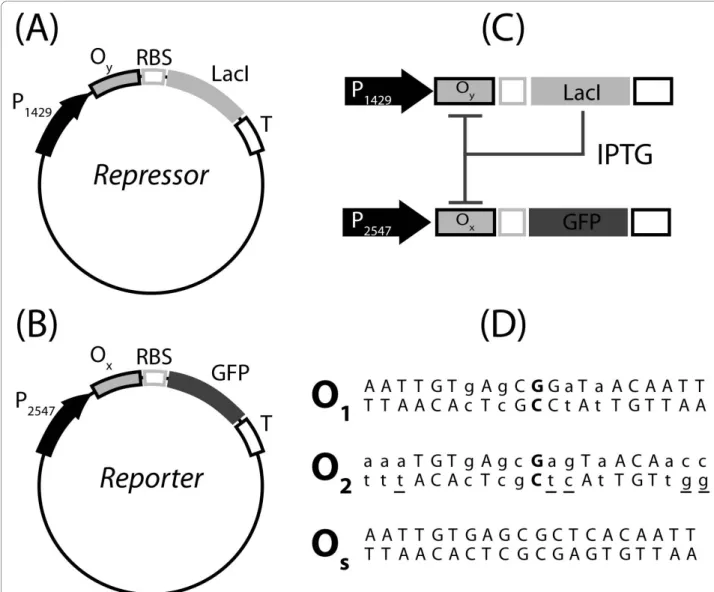
In this study we used, as a prototypal model, a syn-thetic device based on the lactose repressor system. This synthetic gene network includes: (i) a negative feedback circuit for the synthesis of lactose repressor (LacI) mole-cules; (ii) and a reporter circuit, for the synthesis of green fluorescent protein (GFP) controlled by LacI (Figure 1). Transcriptional control is realized by regu-lated promoters, assembled from a constitutive promo-ter and an operator site docking for LacI. The prokaryotic promoter can be divided into three sub-regions: (i) distal (upstream of the -35 sequence), (ii) core (between -35 and -10) and (iii) proximal (down-stream of the -10) [25]. LacI can regulate gene transcrip-tion by binding to operator sites placed in any of these regions [26]. However, we decided to insert our operator sites only into the proximal promoter region, avoiding modifications of the integrity of the core region. This choice preserves the basal transcriptional level of the promoter, and most importantly its modularity. The operator sites in the synthetic devices were used as modular elements. Nine different devices were assembled using three operator sites with different bind-ing affinities for LacI, alternatively inserted into two plasmid vectors. Three of these synthetic circuits were used to define the mathematical model, and to identify its parameters. The mathematical model was then used to predict the behavior of the remaining untested
circuits, providing a quantitative test of modular design in synthetic biology.
Results
Definition of the gene-circuits
E. coli DH5a cells were transformed with two different plasmids, here named Repressor and Reporter (Figure 1). The gene circuit encoded in the Repressor plasmid has a negative feedback structure as an operator site for LacI is inserted downstream of a promoter sequence control-ling the expression of the lactose repressor gene itself (Figure 1A). The concentration of LacI in the cytoplasm also controls the transcription of the GFP gene on the Reporter gene circuit (Figure 1B). The synthesis of GFP in a cell transformed with both Repressor and Reporter plasmids can be tuned by changing the concentration of the gratuitous inducer IPTG (Figure 1C). We created nine different gene circuits, using all the possible combi-nations of three operator sites (O1, O2 and Os, see the sequences in Figure 1D) in the Repressor and Reporter plasmids. The affinity to lactose repressor of the opera-tor sites O1, O2 and Osspans a range of over two orders of magnitude, which allows the creation of systems with widely different characteristics [27,28]. The symbol OxOyis used to identify the gene circuit with the opera-tor sequence Ox on the Reporter plasmid, and the opera-tor sequence Oy on the Repressor plasmid. If cells are transformed with the Reporter plasmid alone, the sym-bols O1, O2, or Osare used, according to which opera-tor site is present.
Test of the modular architecture
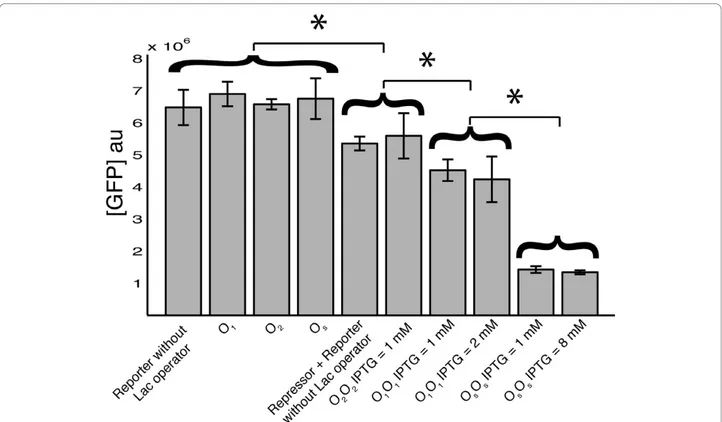
Cells transformed only with Reporter plasmids showed equilibrium values of the normalized fluorescence equal to (see the Methods section for the definition of normal-ized fluorescence, [GFP]au) 6.89 × 10⁶, 6.55 × 10⁶ and 6.75 × 10⁶ arbitrary units (au) for plasmids with the O1, O2and Osoperator sequence respectively (Figure 2). In absence of Repressor plasmids, no molecules of LacI are synthesized, thus no LacI-dependent inhibition is exerted on GFP transcription. In accordance, cells trans-formed with Reporter plasmids with different operator sequences yielded analogous fluorescence levels. This result supports the case of a modular architecture of the gene circuit, where promoter and operator sequences can be used as independent modular parts. In agree-ment, cells transformed only with a Reporter plasmid lacking the operator sequence showed equilibrium fluor-escence of 6.47 × 10⁶au (Figure 2). This value is statisti-cally equivalent to those measured in cells transformed with a Reporter plasmid containing one of the three operator sequences. This suggests that the presence of the operator sequence alone does not affect
transcription rates. Thus, a unique value of the GFP transcription rate, GM, was used in the mathematical model, independently of the specific operator sequence present in the gene circuit (see the Methods section for the definition of the mathematical model, and Table 1 for the list of the parameters).
Cells transformed with the Reporter circuit alone reached the maximum fluorescence level in our experi-mental conditions. In an ideal modular system, this maximum fluorescence is conserved in cells transformed with both Reporter and Repressor plasmids, if the
Reporter plasmids lack the lactose operator sequence. To test this issue, we co-transformed cells with a Repressor plasmid, containing any of the three different operator sites, and with a Reporter plasmid lacking the operator site. Cells co-transformed with these two plas-mids (Repressor plasmid and Reporter plasmid lacking the operator site) yielded a fluorescence value of 5.44 × 10⁶ au, significantly lower than the maximum fluores-cence observed in cells transformed with either of the Reporter plasmids alone (Figure 2). The average fluores-cence in cells co-transformed with the Repressor plasmid
Figure 1 Gene circuits. Repressor (A) and Reporter (B) plasmids. Boxes highlight the parts that could be used as independent elements to tune the circuit outcome in a modular framework. As a proof of principle of the modular architecture, we created nine different gene circuits, combining three different operator sequences, O1, O2and Os, in two plasmids. (C) Gene circuit in cells transformed with both the plasmids.
(D) Sequences of the three operator sites. Bold characters are used for the central G-C base pair in the naturally occurring operator sites O1and
O2. The left and right half operator sites in O1and O2are pseudo-symmetric, lower-case characters highlight the deviations from perfect
symmetry. The base pairs that are different between the operators O1and O2are underlined in the O2sequence. The artificial operator site Os
was defined removing the central base pair G-C and creating a perfectly symmetric sequence based on the left half of the operator O1. The
affinity to lactose repressor of the three operator sites O1, O2and Osspans a range of over two orders of magnitude [27,28], which allows the
and the Reporter plasmid without the operator site, was used to define the maximum fluorescence level of the gene-circuit (GFPmax). The relative fluorescence, GFP%, in the gene circuits OxOy, was defined as:
GFP GFP au GFP % [ ] max = (1)
Only in the O2O2 gene circuit a relative fluorescence close to 100% was obtained upon IPTG induction. Indeed, the fluorescence observed in the O2O2 gene cir-cuit in presence of 1 mM IPTG was not significantly different from the maximum fluorescence produced by the gene circuit with the Repressor plasmid and the Reporter plasmid without the operator site. On the other hand, fluorescence values induced by 1 mM IPTG in the O1O1 and OsOs gene circuits were statistically different from GFPmax. Increasing the IPTG concentra-tion up to 2 mM in O2O2, and up to 8 mM in OsOs, did not change the fluorescence value, suggesting that
the removal of LacI-mediated inhibition of transcription is already saturated at 1 mM IPTG in both the gene cir-cuits (Figure 2).
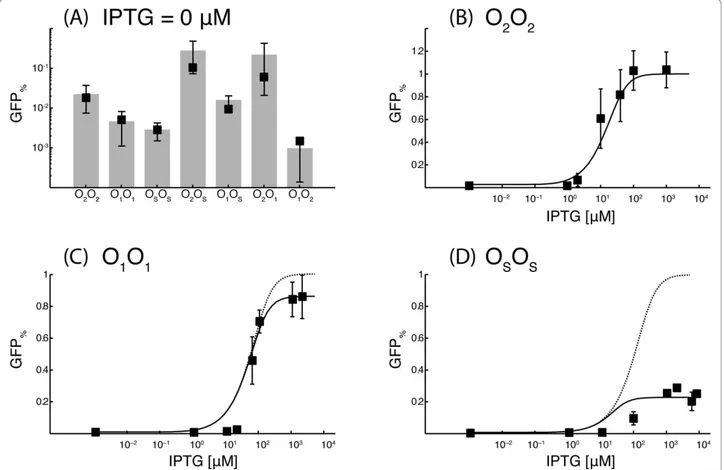
In absence of IPTG, the gene-circuits O2O2, O1O1and OsOs showed relative inductions of 2.22 × 10⁻², 4.62 × 10⁻³and 2.85 × 10⁻³respectively (Figure 3A). The rela-tive inductions of the three gene circuits with the same operator sequence on both plasmids were used to iden-tify the model parameters. A single parameter, GM, was used in the fitting procedure of the gene circuits O2O2 and O1O1. The excellent agreement with the experimen-tal data suggests that the mathematical model correctly reproduce the behavior of the gene networks in absence of IPTG (Figure 3A). A second parameter, KsL, was
used to fit the data of the OsOs gene circuit, thus, it is not surprising that the mathematical model well repro-duces this data.
To test the validity of the modular approach, selected combinations of Reporter and Repressor plasmids with different operator sites were tested, namely O2Os, O1Os,
Figure 2 Fluorescence levels. The normalized fluorescence, equation 2, in arbitrary units, is shown for cells transformed with: Reporter plasmid without the operator sequence (n = 6); Reporter plasmids with the O1(n = 5), O2(n = 8), and Os(n = 10) operator sequence; Repressor plasmids
with any of the three operator sequences and Reporter plasmid lacking the lactose operator sequence (n = 10); O2O2induced with 1 mM IPTG
(n = 13); O1O1induced with 1 mM (n = 9) and 2 mM (n = 5) IPTG; OsOsinduced with 1 mM (n = 4) and 8 mM (n = 3) IPTG. In absence of
Repressor plasmids, the normalized fluorescence is the same if the Reporter plasmid does not include the operator sequence, or if it includes any of the three operator sequences tested. Co-transformation with a Repressor plasmid and a Reporter plasmid without the operator site causes a decrease in the maximum fluorescence, even if no LacI activity is exerted. The same fluorescence was observed in the O2O2gene circuit at
saturating concentrations of IPTG. On the other hand, the maximum fluorescence in the O1O1and OsOsgene circuits is statistically different from
O2O1, and O1O2. The remaining combinations were dis-carded because the operator site in the Reporter plasmid was too strong compared to the operator site in the Repressor plasmid. The mathematical model predicts well the relative inductions of these four gene circuits in absence of IPTG (Figure 3A), with no further adjust-ment of the model parameters. The predictions of the model are closer than one standard deviation from the experimental data for all the gene circuits.
The dose-response curves of the gene circuits O2O2, O1O1 and OsOswere fitted using five parameters. Two parameters, KLIand n, describe the binding of IPTG to LacI and are the same for the three gene circuits. The other parameters, K2I, K1I and KsI describe the binding of induced LacI molecules to the respective operator sites. Since the gene circuit O2O2 reaches 100%
induction at saturating concentration of IPTG, the para-meter KI
2 can be considered equal to infinite for any practical reason. On the other hand, the maximum fluorescence in the gene circuit O1O1is statistically dif-ferent from GFPmax. In absence of LacI molecules, gene circuits with the O1 or O2 operator sequence on the Reporter plasmids showed the same fluorescence. Thus, the diminished maximum fluorescence of the O1O1 gene circuit can only result from a LacI-dependent impairment of transcription, persisting at saturating concentration of IPTG. A marginal affinity of the induced LacI, LI, to the operator sequence can explain the experimental data of the O1O1gene circuit. Figure 3C shows the simulated dose-response curve if induced LacI molecules have (continuous line), or have not (dotted line) a residual affinity for the operator sites.
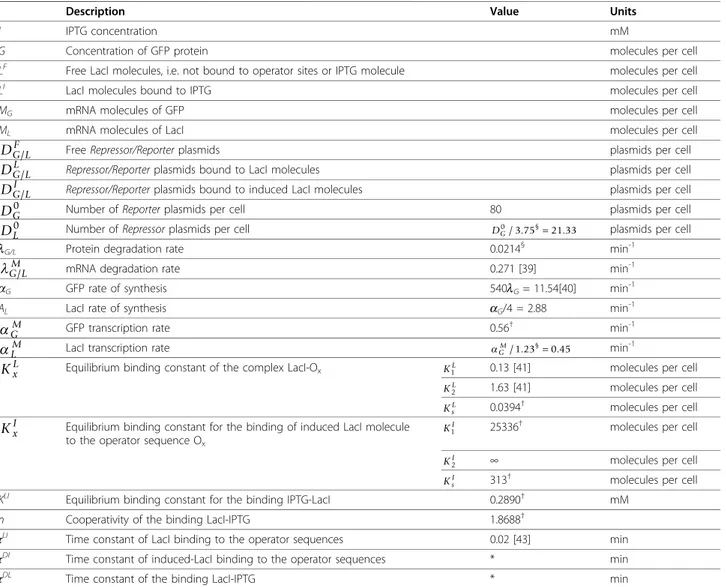
Table 1 Variables and parameters of the mathematical model
Description Value Units
I IPTG concentration mM
G Concentration of GFP protein molecules per cell
LF Free LacI molecules, i.e. not bound to operator sites or IPTG molecule molecules per cell
LI LacI molecules bound to IPTG molecules per cell
MG mRNA molecules of GFP molecules per cell
ML mRNA molecules of LacI molecules per cell
DG LF/ Free Repressor/Reporter plasmids plasmids per cell
DG LL/ Repressor/Reporter plasmids bound to LacI molecules plasmids per cell
DG LI/ Repressor/Reporter plasmids bound to induced LacI molecules plasmids per cell DG0 Number of Reporter plasmids per cell 80 plasmids per cell DL0 Number of Repressor plasmids per cell DG0/ .3 75§=21 33. plasmids per cell
lG/L Protein degradation rate 0.0214§ min-1
G LM
/ mRNA degradation rate 0.271 [39] min
-1
aG GFP rate of synthesis 540lG= 11.54[40] min
-1
ΑL LacI rate of synthesis aG/4 = 2.88 min-1
GM GFP transcription rate 0.56† min-1
LM LacI transcription rate
G M
/ .1 23§=0 45. min-1
KxL Equilibrium binding constant of the complex LacI-Ox K1L 0.13 [41] molecules per cell
KL2 1.63 [41] molecules per cell
KsL 0.0394
† molecules per cell
KxI Equilibrium binding constant for the binding of induced LacI molecule to the operator sequence Ox
KI
1 25336
† molecules per cell
KI
2 ∞ molecules per cell
KsI 313
† molecules per cell
KLI Equilibrium binding constant for the binding IPTG-LacI 0.2890† mM
n Cooperativity of the binding LacI-IPTG 1.8688† τLI
Time constant of LacI binding to the operator sequences 0.02 [43] min τDI
Time constant of induced-LacI binding to the operator sequences * min
τDL Time constant of the binding LacI-IPTG * min
* Only the steady-state behaviors of the gene circuits are analyzed, thus arbitrary values can be used for these time constants.†Values defined through the fitting procedure.§
Introducing the marginal affinity KI
1 decreases the dis-tance from the experimental data from 0.33 to 0.25. The effect of this marginal affinity is much more evident in the OsOs gene circuit, where only ~25% of GFP synth-esis was achieved at saturating concentrations of IPTG (Figure 3D). According to the estimated parameters, the operator sites O1 and Os bind the free LacI molecules respectively ~2 × 10⁵ and ~1 × 10⁴ times stronger than the induced LacI molecules.
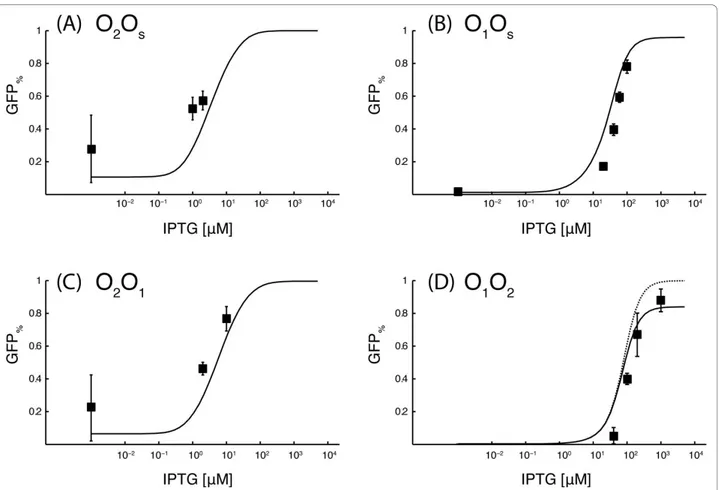
The predicted dose-response curves for the O2Os, O1Os, O2O1 and O1O2 gene circuits are in reasonable agreement with the experimental data (Figure 4). It is important to remark that the experimental data for these four circuits were not used in the fitting proce-dure, and thus the simulated curves in Figure 4 have to be intended as purely predictive.
Discussion
The design of new synthetic gene devices will be highly facilitated by a modular structure of gene circuits and a bottom-up strategy. While the synthetic biology
community is rapidly adopting a modular architecture, quantitative studies of how multi-part systems behave are still missing. Here, we analyzed gene transcription in a modular gene circuit, and tested if the properties of the complete device can be predicted from the proper-ties of its elementary parts. The major findings are that: (i) each modular part may behave in a different way if it is either isolated or included in a more complex gene circuit; and (ii) mathematical modeling can, however, predict the outcome of the device, if the elementary parts are characterized in the proper experimental con-ditions. These experimental conditions must be as close as possible to the gene circuit where the elementary parts should be used, in order to compensate for the non-ideal modularity of the system.
In an ideal modular system, the insertion of a new component should not affect the properties of the other parts, as each of them should work independently. In the real world, this is never the case. The properties of the different parts in a biological system are obviously affected by other parts. This poses major problems for
Figure 3 Percentage fluorescence in absence of IPTG (A), and dose-response curves for the gene-circuits O2O2(B), O1O1(C), and OsOs
(D). In panel (A) grey bars with standard deviations are used for the experimental data while black squares are used for the simulated responses. In panels (C) and (D), a continuous line is used for the simulated dose-response curves in presence of a residual affinity for the operator sites by induced LacI molecules, while a dotted line is used for the simulated dose-response curves when this residual affinity is turned off. The y-axis is in logarithmic scale in panel (A). The x-axis is in logarithmic scale in panels (B) to (D). All the measurements were repeated at least five times.
the design of synthetic gene circuits with a bottom-up approach. Even the simplified system analyzed in this study is not strictly modular. In fact, cells transformed with both the Repressor and the Reporter plasmids have lower fluorescence than those transformed with the Reporter plasmid alone, even though the LacI-dependent repression of gene transcription is completely sup-pressed by removing the operator sequence from the promoter. The decreased fluorescence in cells trans-formed with both the plasmids is likely due to the extra burden that the cells have to sustain in presence of a second plasmid and antibiotic [29,30]. Since the same synthetic device can have different outcomes depending on the gene transcription rates, the deviations from a perfect modular behavior have to be carefully taken into account in the design of new gene circuits. Thus, if we want to use a bottom-up approach we need to charac-terize the elementary parts in a gene circuit reproducing to the closest extent the final synthetic device.
Here we characterized the elementary parts measuring fluorescence in cells transformed with Reporter and
Repressor plasmids having the same operator sequence and then we used the properties of these systems to pre-dict the behavior of gene circuits with different operator sequences in the two plasmids. The analysis of the response of the circuits with the same operator in the Reporter and in the Repressor revealed an unexpected feature about the functionality of LacI. Experimental data are well reproduced by the mathematical model only if we hypothesize a residual affinity for the operator sites by the induced LacI molecules. This possibility has already been proposed [31,32], but to the best of our knowledge never measured experimentally. A direct measure of this residual affinity is hampered by its low value compared to the affinity of the operator for the free LacI molecules (4 and 5 orders of magnitude higher respectively for the Osand O1 operator sequences). Our data provide a first experimental measurement of these residual affinities in E. coli, which can be useful in math-ematical modeling of the lactose repressor system.
An alternative explanation for the decrease of the maximum fluorescence in the O1O1 and OsOs gene
Figure 4 Dose-response curves for gene circuits with different operator sequences on theReporter and the Repressor plasmids. A continuous line is used for the simulated dose-response curves in presence of a residual affinity for the operator sites by induced LacI molecules, while a dotted line is used for the simulated dose-response curves when this residual affinity is turned off. All the measurements were repeated at least five times.
circuits is the saturation of the intracellular IPTG con-centration at a value around 1 mM. However, no data to support this hypothesis are present in literature for such a value of IPTG concentration. Indeed, IPTG can move through cell membranes both by a diffusive and by an active transport [33], the latter being more effi-cient for the inward motion. Under these conditions, the intracellular concentration of IPTG should be equal, if not higher, than the extracellular concentration.
The blockade of gene transcription by induced LacI molecules was essential to reproduce the non-complete induction of the O1O1 and OsOs circuits. When this term is included in the mathematical model, the theore-tical dose-response curves of the three circuits with Reporter and Repressor plasmids having the same opera-tor sequence are in agreement with the experimental data. Small deviations are observed for the OsOscircuit. Here, the computed IPTG concentration giving half the maximal fluorescence is lower than the experimental value. This discrepancy may result from a poor determi-nation of the OsOs fluorescence in absence of IPTG. Due to the high affinity of LacI to the Os operator site, the fluorescence in absence of IPTG is close to cellular auto-fluorescence. Thus, its experimental value can be measured only with low accuracy, which is reflected in a poor determination of the parameter KsL of the
mathe-matical model. Lower values of KsL give a better fitting
of the raising phase of the dose-response curve of the OsOs circuit. However, finding the best fitting of the experimental data is out of the scope of this study. More detailed models of the lactose repressor system have been proposed [34,35] and these models may likely provide a better agreement to the experimental data. The choice of an extremely simple model was inspired both by practical and theoretical considerations. First, more detailed models have a higher number of para-meters. If these parameters have to be assigned in a non-arbitrary way, more experimental measurements are needed. An excessive burden in the characterization of the elementary parts will make a bottom-up approach to gene circuit design not efficient. Second, mathematical models with many parameters can suffer from the over-fitting problem, i.e. the experimental data used in the fitting procedure are well reproduced because the model describes even the noise in the experimental data. If over-fitting occurs, the parameters of the model cannot be used to analyze slightly different systems. Since this is exactly what we wanted to do here, we preferred to use a simple mathematical model with fewer parameters. In this context, the agreement between the theoretical and the experimental data of the O1Os, O2Os, O2O1and O1O2 gene circuits is remarkable. The agreement is extremely good in absence of IPTG, while small devia-tions are observed in the dose-response curves. Even if
the adopted circuit is simple, it allows the study of an important problem in synthetic biology, i.e. the regula-tion of gene transcripregula-tion. In fact, quantitative control of gene expression has always been a central problem for the design of gene networks. While designing the logical scheme of a network is relatively simple, the actual behavior of the network depends on the gene transcription rates, with different transcription rates causing different static and dynamic outcomes [36]. The present study analyzes the crucial aspect of gene tran-scription control in a quantitative way, and characterizes a modular system for the control of transcription in gene networks. Moreover, the adopted gene circuit has a negative feedback structure, which is shared by a plethora of synthetic devices, and also plays a central role in diverse natural processes, from pattern formation to development. The negative feedback structure speeds up the time for the response of the gene network, and also stabilize its behavior [37]. Thus, the adopted archi-tecture of the network could be a useful solution for gene transcription control in synthetic devices.
Conclusions
Our results support a bottom-up approach to gene cir-cuit design, but they also highlight the importance of characterizing the elementary blocks in the appropriate experimental conditions. If this is certainly a severe con-straint for a bottom-up approach to gene circuit design, it does not rule out this possibility. Synthetic devices work by the interplay of several gene circuits, and usually the hard step in the design of new devices is to tune the transcription of different genes in order to get the desired output. If molecular interplays are shut down one-by-one - as it has been done here by remov-ing the operator sequence in the Reporter plasmid - the elementary parts can be characterized in an isolated environment. Then, this information can be used to facilitate the design of new synthetic devices. Moreover, it is important to remember that cell transformation by a second plasmid is a strong test for the modular archi-tecture. If changes are minimal perturbations for the biological system, the deviation from a perfect modular-ity will likely be smaller, and a functional
characteriza-tion of the elementary parts in standardized
experimental conditions could be adequate to help in the design of new gene circuits.
Methods
Plasmid construction
All the biological parts were taken from the Registry of Standard Biological parts, except the lactose operator sites that were synthesized (GeneArt) in the BioBrick standard format. The Reporter gene circuit was cloned in a high copy number plasmid (pSB1A2) containing
Ampicillin resistance and a pUC19-derived pMB1 repli-cation origin. The Repressor gene circuit was cloned in a medium copy number plasmid (pSB3K3) containing Kanamycin resistance and a pMR101-derived p15A replication origin. The constitutive promoters P2547 (BBa_J23100) and P1429 (BBa_J23118) were cloned upstream of the lactose operator sequences, respectively in the high and medium copy number plasmid. Three lactose operator sequences were used: O1, aattgtgagcgga-taacaatt; O2, aaatgtgagcgagtaacaacc; and Os, aattgt-gagcgctcacaatt [27,38]. The GFP gene (BBa_J04031), with a LVA degradation tag, was placed downstream of the P2547Ox regulated promoters in the high copy num-ber plasmid. The LacI-coding sequence with LVA degra-dation tag (BBa_C0012) was placed downstream of the P1429Ox regulated promoter in the medium copy num-ber plasmid. The same ribosome binding site (RBS) sequence (BBa_B0034) was cloned upstream of all the protein coding sequences. A double transcriptional ter-minator T (BBa_B0015) was placed downstream of each transcriptional unit. Moreover, a double terminator is present at both sides of the plasmid multiple cloning site in order to prevent random transcriptions. In order to test the modular approach and to better identify the parameters of the mathematical model, we also built: (i) Reporter plasmids lacking the operator sequence; (ii) high and medium copy number plasmids both with a non-tagged GFP protein (BBa_I13504) cloned down-stream of the P1429 promoter; (iii) Reporter plasmids with the P1429promoter lacking the operator sequence.
Fluorescence measurements
Dh5a E. coli cells were grown at 37°C in 5 ml of M9 minimal medium, supplemented with casamino acids, thiamine hydrochloride and the appropriate antibiotics. Glucose was the main carbon source (Sigma). Fluores-cence measurements were performed after an overnight growth in presence of the desired amount of Isopropyl b-D-1-thiogalacto-piranoside (IPTG; Sigma). 100 μl samples were transferred from each cell culture into a multi-well plate and measured in a Wallac VICTOR2 reader (Perkin Elmer). Both fluorescence (Fluo; Ex 501/ Em 511 nm) and optical density (OD; 600 nm) were measured. Normalized fluorescence, [GFP]au, in arbi-trary unit (au), was estimated as:
[GFP au] Fluo FluoDH ,
OD
= − 5 (2)
where Fluo and OD are respectively the fluorescence and the optical density of the sample, and FluoDH5a is the average auto-fluorescence in samples of
non-transformed Dh5a cells. These measurements, referred to as overnight growth, correspond to samples evaluated at time equal to 12 h, with an average OD of 0.36 ± 0.10. This time point was determined by preliminary time-course measurements (Additional File 1, Figure S1) where cells were grown up to 14 hours and sampling done every 30 min for different cell cultures; namely: (i) cells transformed with a single plasmid; (ii) cells co-transformed with two plasmids; (iii) cells co-co-transformed with two plasmids, and induced by IPTG. Throughout these measurements, normalized fluorescence reached a steady-state value after ~11 h, for all the tested cell populations, and this value was maintained stable for the following 3 hours measured. This steady state beha-vior justifies the static measurements used for the remaining analyses. The linear relationship between absolute fluorescence and optical density (Additional File 1, Figure S1) justifies the normalization procedure performed by equation 2.
Statistical analysis
Values are reported as mean ± standard deviation. One-way ANOVA, and the Bonferroni post-hoc test for pair-wise comparisons were used for detecting differences in normalized fluorescence between multiple groups, for which normal distributions were found (Jarque-Bera test). A significance level of 95% (p < 0.05) was used for all the statistical analyses. MATLAB package (2007a, The MathWorks, Natick, MA) was used for the statisti-cal tests.
Mathematical model and parameter definition
The OxOygene-circuit – Reporter plasmid with the Ox operator sequence and Repressor plasmid with the Oy operator sequence– was described by the following dif-ferential equations: dMG L dt G LD M M G LF G LM G L / , / / / / = − (3) DG LF/ =DG L0/ −DG LL/ −DG LI/ , (4) dDG LL dt DL DG LF LF Kx yL DG LL / / / , / = − ⎡ ⎣ ⎢ ⎢ ⎢ ⎤ ⎦ ⎥ ⎥ ⎥ 1 (5) dDG LI dt DI DG LF LI Kx yI DG LI / / / , / = − ⎡ ⎣ ⎢ ⎢ ⎢ ⎤ ⎦ ⎥ ⎥ ⎥ 1 (6)
dLI dt LI L I K LI L L dDG I dt dDLI dt F n I L I = ⎛ ⎝ ⎜ ⎞ ⎠ ⎟ − ⎡ ⎣ ⎢ ⎢ ⎤ ⎦ ⎥ ⎥− − − − 1 , (7) dLF dt M L LI L I K LI L dDGL dt dDLL d L L L F F n I = − − ⎛ ⎝ ⎜ ⎞ ⎠ ⎟ − ⎡ ⎣ ⎢ ⎢ ⎤ ⎦ ⎥ ⎥− − − 1 tt , (8) dG dt =GMG− .GG (9)
Subscripts G and L are used for the variables/para-meters of Repressor and Reporter gene-circuit respec-tively. Table 1 defines all the symbols used in equations 3-9. Differently from other mathematical models of the lactose repressor system, the equations adopted here take into account a possible inhibition of transcription by induced LacI molecules (LI, LacI molecules bound to IPTG). Each promoter switch among three possible states: promoter bound to LacI, DG LL/ ; promoter bound to induced LacI, DG LI/ ; and free-promoter, DG LF/ (Equa-tion 4). As a comparison, simula(Equa-tions without residual affinity of induced lactose repressor molecules for the operator sites were also performed. The mathematical model used for these simulations is provided as supple-mentary material (Additional File 2). In brief, differential equations 6 and state variables DG LI/ were removed (DG LI/ ≡ 0 . The parameters for the two mathematical) models were the same, with except of the Kx yI/ para-meters that do not appear in the model without residual affinity.
The total number of Reporter plasmids per cell (high copy number plasmids, DG0), was assumed equal to 80. This value only scales the other parameters of the model, but not the conclusions drawn from equations 3-9. In order to estimate the ratio DG0 /DL0, we measured
the fluorescence in cells transformed with: (i) Reporter plasmid missing the operator sequence and with the non-tagged GFP protein (BBa_I13504) cloned down-stream of the P1429promoter, and (ii) the same gene cir-cuit cloned in the medium copy number plasmid. Cloning the Reporter and Repressor circuits respectively on a high and medium copy number plasmid gives higher sensitivity to IPTG induction, allowing a more accurate quantitative analysis. At the same time - in the context of a modular approach to gene circuit design -the types of plasmids adopted can be treated as fur-ther
interchangeable parts of the circuit. As described above, the ratio between the number of high and medium copy number plasmids per cell was estimated by a separate set of experimental measurements in simplified circuits, and then used for the analysis of all the other circuits -which is the typical approach used for the design of complex circuits using modular parts and a bottom-up strategy.
The degradation rate of mRNA, G LM/ , was set to 1/3.69 min-1 [39], both for LacI and GFP. Protein degra-dation rate,lG/L, was measured experimentally by first inducing the O1O1 circuit with saturating concentration of IPTG, and then monitoring the GFP decay. In detail, after overnight grown in medium containing 1 mM IPTG, cells were washed with fresh medium and let at 37°C for growth in IPTG-free medium. Samples were taken every 15 minutes for fluorescence measurement. The GFP translation rate was set to 540lG, in order to have a ratio of 540 between the number of mRNA and protein molecules at equilibrium [40]. Since the func-tional form of LacI is tetrameric, the LacI transcription rate was set toaL= aG/4. This choice preserves the ratio of 540 between the number of protein chains and mRNA molecules, assuming that this number is the characteristic gain of the translation process. The equili-brium binding constant of the complexes LacI-O1( K1L) and LacI-O2 ( K2L) were set to 0.133 and 1.63 molecule/ cell respectively [41] (a cell volume of 1 μm3 was assumed [42]). The value of the mRNA transcription rate constant for the Reporter circuit, G
M, was
esti-mated by fitting the relative induction of the O1O1 and O2O2 circuits in absence of IPTG (See the Results sec-tion for the definisec-tion of relative inducsec-tion). The ratio
GM
LM
/ was measured experimentally, comparing the cell fluorescence in cells transformed with Reporter plas-mids with the P2547or the P1429promoter and without the operator sequence. Using a stronger promoter in the Reporter plasmids, compared to the Repressor plasmids, yields higher sensitivity to IPTG induction. As done for the ratio between the number of plasmids inside the cell, the strength-ratio between the two promoters was identified by experimental measurements in simplified circuits, and then used for the analysis of the remaining gene-circuits, with a typical modular approach to gene circuit design.
The value of the equilibrium binding constant for the LacI-OScomplex ( KsL) was defined by fitting the rela-tive induction of the OSOScircuit in absence of IPTG. The constants for the binding of induced LacI molecules to the three operators sites ( KI
1, KI2 and KsI) and the
parameter for the LacI-IPTG binding (n and KLI), were defined by fitting the experimental dose response curves
of the three circuits O2O2, O1O1 and OsOs. A separate fitting procedure of the parameters n and KLI for the mathematical model without residual affinity between induced lactose repressors and operator sites was also performed, but it did not improve the agreement with the experimental data. Indeed, the model without resi-dual affinity cannot reproduce dose-response curves with a maximum GFP%below 100%. Fitting procedure were performed by the fminsearch routine of the MATLAB package (2007a, The MathWorks, Natick, MA) minimizing the percentage error.
Additional material
Additional File 1: Preliminary dynamical measurements. Time-course measurements of normalized fluorescence and optical density in cells transformed with different gene-circuits.
Additional File 2: Mathematical model without induced LacI residual affinity. Equations of the mathematical model without residual affinity between induced lactose repressor molecules and operator sites
Author details
1Laboratory of Cellular and Molecular Engineering, University of Bologna,
I-47521 Cesena, Italy.2Department of Electronics, Computer Science and Systems, University of Bologna, I-47521 Cesena, Italy.3Department of Medical
Surgery and Bioengineering, University of Siena, I-53100 Siena, Italy.
4Department of Biochemistry“G. Moruzzi”, University of Bologna, I-40126
Bologna, Italy. Authors’ contributions
FC built all the genetic constructs used in this work and performed all the experimental measurements. SF developed the mathematical model and performed the fitting procedure and parameter identification. EG advised on wet-lab procedures. SC designed the experiments conducted by FC and the model developed by SF. All authors wrote, read and approved the final manuscript.
Competing interests
The authors declare that they have no competing interests. Received: 24 May 2010 Accepted: 11 November 2010 Published: 11 November 2010
References
1. Hasty J, McMillen D, Collins JJ: Engineered gene circuits. Nature 2002, 420:224-230.
2. Shen-Orr SS, Milo R, Mangan S, Alon U: Network motifs in the transcriptional regulation network of Escherichia coli. Nat Genet 2002, 31:64-68.
3. Mukherji S, van Oudenaarden A: Synthetic biology: understanding biological design from synthetic circuits. Nat Rev Genet 2009, 10:859-871. 4. Andrianantoandro E, Basu S, Karig DK, Weiss R: Synthetic biology: new
engineering rules for an emerging discipline. Mol Syst Biol 2006, 2:2006 0028.
5. Hasty J, McMillen D, Collins JJ: Engineered gene circuits. Nature 2002, 420:224-230.
6. Sprinzak D, Elowitz MB: Reconstruction of genetic circuits. Nature 2005, 438:443-448.
7. Simpson ML: Cell-free synthetic biology: a bottom-up approach to discovery by design. Mol Syst Biol 2006, 2:69.
8. Drubin DA, Way JC, Silver PA: Designing biological systems. Genes Dev 2007, 21:242-254.
9. Boyle PM, Silver PA: Harnessing nature’s toolbox: regulatory elements for synthetic biology. J R Soc Interface 2009, 6(Suppl 4):S535-546.
10. Tigges M, Marquez-Lago TT, Stelling J, Fussenegger M: A tunable synthetic mammalian oscillator. Nature 2009, 457:309-312.
11. Haynes KA, Silver PA: Eukaryotic systems broaden the scope of synthetic biology. J Cell Biol 2009, 187:589-596.
12. Guet C, abreve lC, Elowitz MB, Hsing W, Leibler S: Combinatorial Synthesis of Genetic Networks. Science 2002, 296:1466-1470.
13. Gardner TS, Cantor CR, Collins JJ: Construction of a genetic toggle switch in Escherichia coli. Nature 2000, 403:339-342.
14. Stricker J, Cookson S, Bennett MR, Mather WH, Tsimring LS, Hasty J: A fast, robust and tunable synthetic gene oscillator. Nature 2008, 456:516-519. 15. Elowitz MB, Leibler S: A synthetic oscillatory network of transcriptional
regulators. Nature 2000, 403:335-338.
16. Friedland AE, Lu TK, Wang X, Shi D, Church G, Collins JJ: Synthetic Gene Networks That Count. Science 2009, 324:1199-1202.
17. Endy D: Foundations for engineering biology. Nature 2005, 438:449-453. 18. Heinemann M, Panke S: Synthetic biology–putting engineering into
biology. Bioinformatics 2006, 22:2790-2799.
19. Kelly JR, Rubin AJ, Davis JH, Ajo-Franklin CM, Cumbers J, Czar MJ, de Mora K, Glieberman AL, Monie DD, Endy D: Measuring the activity of BioBrick promoters using an in vivo reference standard. J Biol Eng 2009, 3:4.
20. Marchisio MA, Stelling J: Computational design tools for synthetic biology. Curr Opin Biotechnol 2009, 20:479-485.
21. Canton B, Labno A, Endy D: Refinement and standardization of synthetic biological parts and devices. Nat Biotechnol 2008, 26:787-793.
22. Cooling MT, Rouilly V, Misirli G, Lawson J, Yu T, Hallinan J, Wipat A: Standard Virtual Biological Parts: A Repository of Modular Modeling Components for Synthetic Biology. Bioinformatics 2010, 26. 23. Guido NJ, Wang X, Adalsteinsson D, McMillen D, Hasty J, Cantor CR,
Elston TC, Collins JJ: A bottom-up approach to gene regulation. Nature 2006, 439:856-860.
24. Ellis T, Wang X, Collins JJ: Diversity-based, model-guided construction of synthetic gene networks with predicted functions. Nat Biotechnol 2009, 27:465-471.
25. Lisser S, Margalit H: Determination of common structural features in Escherichia coli promoters by computer analysis. Eur J Biochem 1994, 223:823-830.
26. Cox R, Surette M, Elowitz M: Programming gene expression with combinatorial promoters. Mol Syst Biol 2007, 3.
27. Sadler JR, Sasmor H, Betz JL: A perfectly symmetric lac operator binds the lac repressor very tightly. Proc Natl Acad Sci USA 1983, 80:6785-6789. 28. Gilbert W, Gralla J, Majors AJ, Maxam A: Lactose operator sequences and
the action of lac repressor. In Protein-ligand interactions. Edited by: Sund H, Blauer G. Walter de Gruyte, Berlin; 1975:193-207.
29. Flores S, de Anda-Herrera R, Gosset G, Bolivar FG: Growth-rate recovery of Escherichia coli cultures carrying a multicopy plasmid, by engineering of the pentose-phosphate pathway. Biotechnol Bioeng 2004, 87:485-494. 30. Glick BR: Metabolic load and heterologous gene expression. Biotechnol
Adv 1995, 13:247-261.
31. Daber R, Lewis M: Towards evolving a better repressor. Protein Eng Des Sel 2009, 22:673-683.
32. Saiz L, Vilar JM: Ab initio thermodynamic modeling of distal multisite transcription regulation. Nucleic Acids Res 2008, 36:726-731.
33. Noel JT, Pilyugin SS, Narang A: The diffusive influx and carrier efflux have a strong effect on the bistability of the lac operon in Escherichia coli. Journal of Theoretical Biology 2009, 256:14-28.
34. Santillan M, Mackey MC: Influence of catabolite repression and inducer exclusion on the bistable behavior of the lac operon. Biophys J 2004, 86:1282-1292.
35. van Hoek M, Hogeweg P: The effect of stochasticity on the lac operon: an evolutionary perspective. PLoS Comput Biol 2007, 3:e111.
36. Atkinson MR, Savageau MA, Myers JT, Ninfa AJ: Development of Genetic Circuitry Exhibiting Toggle Switch or Oscillatory Behavior in Escherichia coli. 2003, 113:597-607.
37. Rosenfeld N, Elowitz MB, Alon U: Negative autoregulation speeds the response times of transcription networks. J Mol Biol 2002, 323:785-793. 38. Gilbert W, Maxam A: The nucleotide sequence of the lac operator. Proc
39. Bernstein JA, Lin PH, Cohen SN, Lin-Chao S: Global analysis of Escherichia coli RNA degradosome function using DNA microarrays. Proc Natl Acad Sci USA 2004, 101:2758-2763.
40. Lu P, Vogel C, Wang R, Yao X, Marcotte EM: Absolute protein expression profiling estimates the relative contributions of transcriptional and translational regulation. Nat Biotechnol 2007, 25:117-124.
41. Bintu L, Buchler NE, Garcia HG, Gerland U, Hwa T, Kondev J, Kuhlman T, Phillips R: Transcriptional regulation by the numbers: applications. Curr Opin Genet Dev 2005, 15:125-135.
42. Phillips R, Kondev J, Theriot J: Physical Biology of the Cell. Garland Science 2008.
43. Dunaway M, Olson JS, Rosenberg JM, Kallai OB, Dickerson RE, Matthews KS: Kinetic studies of inducer binding to lac repressor.operator complex. J Biol Chem 1980, 255:10115-10119.
doi:10.1186/1754-1611-4-14
Cite this article as: Ceroni et al.: Rational design of modular circuits for gene transcription: A test of the bottom-up approach. Journal of Biological Engineering 2010 4:14.
Submit your next manuscript to BioMed Central and take full advantage of:
• Convenient online submission
• Thorough peer review
• No space constraints or color figure charges
• Immediate publication on acceptance
• Inclusion in PubMed, CAS, Scopus and Google Scholar
• Research which is freely available for redistribution
Submit your manuscript at www.biomedcentral.com/submit