Downloaded from https://journals.lww.com/transplantjournal by BhDMf5ePHKav1zEoum1tQfN4a+kJLhEZgbsIHo4XMi0hCywCX1AWnYQp/IlQrHD3tIQ5gQCIeyzx5bGQSVVpx2Yd7gsXYb69v1XEqWEmha0= on 02/10/2020 Downloadedfrom https://journals.lww.com/transplantjournalby BhDMf5ePHKav1zEoum1tQfN4a+kJLhEZgbsIHo4XMi0hCywCX1AWnYQp/IlQrHD3tIQ5gQCIeyzx5bGQSVVpx2Yd7gsXYb69v1XEqWEmha0=on 02/10/2020
374 Transplantation ■ February 2020 ■ Volume 104 ■ Number 2 www.transplantjournal.com
T.M.M. is the author of the article. M.C. involved in substantial contributions to the work conception. P.T., A.S., S.S., and E.M. involved in data acquisition. L.E. involved in critical revision of the article for important intellectual content. G.S., F.P., G.B.P., and G.C. involved in participation in research. G.T. involved in revision and final approval.
The authors declare no conflicts of interest. This work was supported by Novartis Farma Italia.
Correspondence: Tommaso Maria Manzia, PhD, FEBS, Dipartimento Scienze Chirurgiche, Università degli Studi di Roma Tor Vergata, Viale Oxford n.81, 00133, Fondazione Policlinico Tor Vergata, Rome, Italy. ([email protected]). Copyright © 2019 The Author(s). Published by Wolters Kluwer Health, Inc. This is an open-access article distributed under the terms of the Creative Commons Attribution-Non Commercial-No Derivatives License 4.0 (CCBY-NC-ND), where it is permissible to download and share the work provided it is properly cited. The work cannot be changed in any way or used commercially without permission from the journal.
ISSN: 0041-1337/20/1042-374 DOI: 10.1097/TP.0000000000002851 Received 3 January 2019. Revision received 9 June 2019.
Accepted 11 June 2019.
1Fondazione Policlinico Tor Vergata, Dipartimento Scienze Chirurgiche,
Università degli Studi di Roma Tor Vergata, Roma, Italy.
2 AOU Senese, Siena, Italy.
3 Dipartimento di Medicina Specialistica diagnostica e sperimentale, Università
di Bologna, Bologna, Italy.
4 Vita Salute San Raffaele University, Milano, Italy. 5 AO Spedali Civili, Brescia, Italy.
6 AOU Careggi, Firenze, Italy. 7 AOU di Padova, Padova, Italy. 8 PU A.Gemelli, Roma, Italy. 9 POU S.Salvatore, L’Aquila, Italy. 10 AO G.Brotzu, Cagliari, Italy. 11 AOUP di Modena, Modena, Italy.
Clinical Trial Notation: www.clinicaltrial.gov; NCT01410448.
A 3-month, Multicenter, Randomized, Open-label
Study to Evaluate the Impact on Wound Healing of
the Early (vs Delayed) Introduction of Everolimus
in De Novo Kidney Transplant Recipients, With
a Follow-up Evaluation at 12 Months After
Transplant (NEVERWOUND Study)
Tommaso Maria Manzia, PhD,1 Mario Carmellini, Prof,2 Paola Todeschini, PhD,3 Antonio Secchi, Prof,4 Silvio Sandrini, PhD,5 Enrico Minetti, Prof,6 Lucrezia Furian, Prof,7 Gionata Spagnoletti, PhD,8
Francesco Pisani, Prof,9 Gian Benedetto Piredda, MD,10 Gianni Cappelli, MD,11 and GIuseppe Tisone, Prof1
INTRODUCTION
In kidney transplantation (KT), the introduction of new immunosuppressive agents may offer the opportunity to reduce adverse events (AEs) and personalize the therapy, while maintaining a good feasibility and efficacy. The
introduction of mycophenolic acid (MPA) and mammalian target of rapamycin inhibitors (mTORis) led, in selected patients, to the reduction or elimination of calcineurin
inhibitors (CNIs) in early post-KT.1-5 Everolimus (EVR)
(Certican; Novartis Pharma AG, Basel, Switzerland) is a
Background. The risk of wound healing complications (WHCs) and the early use of mammalian target of rapamycin inhibi-tors after kidney transplantation (KT) have not been fully addressed. Methods. The NEVERWOUND study is a 3-month, multicenter, randomized, open-label study designed to evaluate whether a delayed (ie, 28 ± 4 d posttransplant) immunosup-pression regimen based on everolimus (EVR) reduces the risk of WHC versus EVR started immediately after KT. Secondary endpoints were treatment failure (biopsy-proven acute rejection, graft loss, or death), delayed graft function, patient and graft survival rates, and renal function. Results. Overall, 394 KT recipients were randomized to receive immediate (N = 197) or delayed (N = 197) EVR after KT. At 3 months, WHC-free rates in the immediate EVR versus delayed EVR arm, considering the worst- and best-case scenario approach, were 0.68 (95% confidence interval [CI], 0.62-0.75) versus 0.62 (95% CI, 0.55-0.68) (log-rank P = 0.56) and 0.70 (95% CI, 0.64-0.77) versus 0.72 (95% CI, 0.65-0.78) (log-rank P = 0.77), respectively. The 3- and 12-month treatment failure rates, delayed graft function and renal function, and patient and graft survival were not different between the arms. Conclusions. The early introduction of EVR after KT did not increase the risk of WHC, showing good efficacy and safety profile.
(Transplantation 2020;104: 374–386). 00
00 2020
mTORi immunosuppressant drug with antiproliferative properties that reduces growth factor–stimulated
lympho-cyte proliferation.6,7 In the experimental model and KT
human trials, EVR showed good safety and efficacy with an
acceptable tolerability,8-11 while reducing vascular smooth
muscle cells proliferation6 and neointimal growth12-15 and
leading to a reduction in graft arteriosclerosis.16
Several studies suggested that Sirolimus, an mTORi drug, was associated with an increased rate of wound heal-ing complications (WHCs) after solid organ
transplanta-tion,17-23 an effect potentially related to the inhibition of
the activation and proliferation of fibroblast cells. On the contrary, even if the evidence is still scarce, EVR did not
show inferiority versus other immunosuppression (IS)24,25
and only the drug exposure seems to be related with WHC,
especially in severely obese recipients.26,27
In the CALLISTO study,28 a 12-month randomized
multicenter trial, KT patients at risk of delayed graft function (DGF) were randomized to receive EVR either immediately after KT or in a delayed setting. Composite endpoints were DGF, biopsy-proven acute rejection (BPAR), death, and WHC. The authors eventually specify that the immediate introduction of EVR was not associ-ated with any disadvantage in terms of graft recovery or wound healing.
Considering the small population (ie, 139 randomized patients) of the CALLISTO study and the sample size esti-mation (calculated for the composite endpoint)—as well as the lack of any randomized trial on mTORi fitted for WHC only—the present study was designed with the aim of evaluating whether the delayed administration of EVR (ie, 28 ± 4 d posttransplant) reduces the risk of WHC in de novo KT recipients.
MATERIALS AND METHODS
Study Design
The NEVERWOUND study was a 3-month, multi-center, randomized, prospective, open-label study with an observational follow-up of 12 months, conducted in 22 Italian kidney transplant centers from November 2011 to December 2015 with the goal of evaluating whether a delayed (ie, 28 ± 4 d posttransplant) EVR-based IS regimen reduces the risk of WHC versus EVR started immediately after KT.
During the screening (day −2 to day 0), patients were assessed for eligibility for the study. At day 0, all patients underwent KT and started the induction treatment as per clinical practice. In all cases, the transplantation consisted in the standard pelvic operation, with heterotopic extra-peritoneal placement of the graft and
ureteroneocystos-tomy according to Lich et al29 and Gregoir.30 At baseline
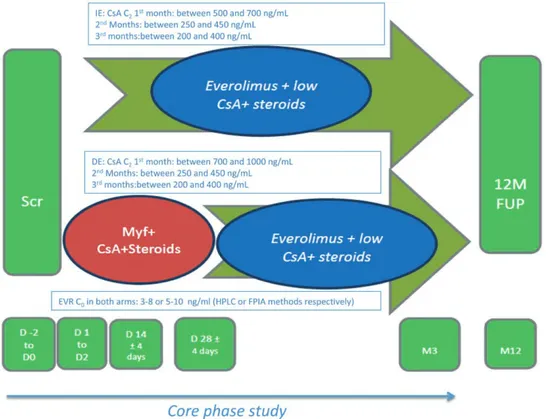
(day 1 to day 2), transplanted patients eligible for the study were randomized (ratio, 1:1) to 1 of the 2 follow-ing treatment arms: immediate EVR (IE) or delayed EVR (DE) (Figure 1) via a Web-based system and stratified by age at transplant (≤60 or >60) and pretransplant diabetes
mellitus status.31
Upon completion of the 3-month treatment period (CORE phase study), patients entered a 9-month obser-vational follow-up period, where they were treated as per local clinical practice. During the follow-up visit performed 12 months (−1/+6 mo) after KT, information was collected on patient and graft survival, renal function, acute rejec-tion, malignancies, wound assessment, new-onset diabetes mellitus, serum creatinine, and blood levels of EVR and cyclosporine A (CsA).
FIGURE 1. Study design. C0, immunosuppression blood levels, before morning dose; C2, immunosuppression blood levels, 2 h after morning dose; CsA, cyclosporine A; D, day; DE, delayed everolimus; EVR, everolimus; FPIA, fluorescence polarization immunoassay; FUP, follow-up; HPLC, high-performance liquid chromatography; IE, immediate everolimus; M, month; Myf, myfortic; scr, screening.
The study complied with the ICH Harmonized Tripartite Guidelines for Good Clinical Practice and the Declaration of Helsinki and its amendments. A written informed con-sent was obtained from all patients, and each center’s ethi-cal committee approved the study.
Treatment Regimens
In the IE, EVR was started within 48 hours after graft reperfusion, at the starting dose of 0.75 mg BID, adjusted to target EVR trough level at 0 hour (immunosuppression
blood levels, before morning dose [C0]) to reach a range
of 3–8 ng/mL (using the high-performance liquid chro-matography method) or 5–10 ng/mL (using the fluores-cence polarization immunoassay method); CsA (Neoral; Novartis Pharma AG, Basel, Switzerland) was adminis-tered BID per os within 48 hours of graft reperfusion, at a starting dose of 4 mg/kg/d. The dose was then adjusted to reach and maintain CsA immunosuppression blood levels
2 h after morning dose (C2) between 500 and 700 ng/mL.
When the EVR target level was reached, CsA was tapered
up to reach C2 levels between 250 and 450 ng/mL during
month 2 and between 200 and 400 ng/mL up to month 3. In the DE, MPA (Myfortic; Novartis Pharma AG, Basel, Switzerland) was administered within 48 hours after graft reperfusion, at the dose of 720 mg BID. At 28 ± 4 days after KT, MPA was discontinued and EVR was started at
0.75 mg BID to reach and maintain C0 3–8 ng/mL
(high-performance liquid chromatography method) or 5–10 ng/ mL (fluorescence polarization immunoassay method). CsA was administered BID per os within 48 hours of graft rep-erfusion, at a starting dose of 6–8 mg/kg/d. The dose was
adjusted to reach C2 levels of 700–1000 ng/mL until day
28 ± 4. The dose was then tapered up to reach the same IE
arm C2 levels.
Intravenous prednisone (or equivalent) was adminis-tered perioperatively, and oral corticosteroids were started the day after, at 20 mg/d, and then tapered according to the center’s clinical practice. Induction therapy was adminis-tered, as per local clinical practice (namely IL2 receptor antibodies [Ab-IL2-R] or antithymocyte globuline [ATG]).
Inclusion criteria for the study were as follows: all adult (>18 y) male or female patients who had received first or second single KT from deceased donor or living related were eligible for the study.
Patients were excluded in the following cases: recipi-ents of multiple organ transplants, including 2 kidneys; women of childbearing potential, unless they were using 2 birth control methods; pregnant or nursing (lactating) women; recipients with historical or current peak panel reactive antibodies >50% or unacceptable human
leuko-cyte antigen(s), platelets <75000/mm3, absolute neutrophil
count <1500/mm3, leukocytes <2500/mm3, or hemoglobin
<7 g/dL; symptoms of significant somatic or mental illness; history of malignancies within the past 5 years; human immunodeficiency virus (HIV) positivity; evidence of severe liver disease; severe active infections; evidence of drug or
alcohol abuse; or body mass index (BMI) >30 kg/m2.
Primary Endpoint
The primary objective of the study was to evaluate— during the treatment period (90 ± 4 postoperative days)— whether the delayed administration of EVR in de novo KT
recipients reduced the risk of WHC versus the immediate administration.
WHCs were defined as fluid collection, including hema-toma and lymphocele (defined as serum >5 cm fluid collec-tions evaluated by ultrasound [assessed at 14 ± 4, 28 ± 4, 90 ± 4, and 360 ± 30 postoperative days]), requiring or not intervention; prolonged lymphatic drainage (ie, lymphor-rea) >150 mL/24 h at 7 postoperative days; wound dehis-cence, wound infection, and incisional hernia (evaluated after 3 and 12 mo).
Secondary Endpoints and AEs
The secondary objectives were as follows: treatment failure rate (composite endpoint: BPAR [graded accord-ing to Banff 97 criteria], graft loss, death); death-censored graft survival rate; graft survival rate; patient survival rate; incidence and duration (days) of DGF (arbitrar-ily defined as the need of dialysis in the first week after transplant); renal function, through estimated glomerular filtration rate (estimated glomerular filtration rate–mod-ification of diet in renal diseases formula); proteinuria (>1000 mg/24 h or >1.0 protein/creatinine in a spot urine sample); safety; and tolerability (incidence of AEs, serious AEs, infections).
Sample Size
A 2-group continuity-corrected chi-square test with a 0.05 2-sided significance level had a 90% power to detect the difference between a group IE percentage of 0.65 and DE percentage of 0.80 (odds ratio, 2.15) when the sam-ple size in each arm was 198. Three hundred ninety-six patients were therefore enrolled.
Study Population
The following populations were defined in the study:
Intent-to-treat population consisting in all the randomized patients who were treated.
Safety population consisting in all the randomized patients who were treated and had ≥1 safety assessment.
Statistical Analysis
Continuous data are summarized by mean, SD, median, first and third quartile, and minimum and maximum. Categorical data are presented by absolute and relative frequencies (n and %) or contingency tables and, where relevant, with their 95% confidence interval (CI) limits.
The presence/absence of ≥1 WHC was analyzed also by means of a logistic regression model, considering as covari-ates the type of induction (basiliximab vs ATG), capacity of the center (>10 vs ≤10 patients), diabetes mellitus (yes vs
no), age at transplantation, and BMI (<25 vs ≥25 kg/m2).
The primary analysis was performed on the safety population.
The time to event was analyzed by means of a Cox model, considering the same covariate used in the logis-tic regression model. The hazard ratio (HR) with a 95% CI was presented. Kaplan-Meier curves of time were also calculated. Changes in renal function were analyzed by the ANCOVA model, considering the same covariate used in the logistic regression model.
For the comparison of proportion, the chi-square test or the Fisher exact test was used, while the Wilcoxon test was used for continuous nonnormally distributed data.
All the analysis were produced using 9.4 SAS for Windows.
In order to manage the missing data, patients who dis-continued the study before reaching the endpoint, those who discontinued EVR for any reason, and those with missing information about WHC were considered fail-ures, according to the worst-case scenario approach, and successes, according to the best-case scenario approach (Sensitivity Analysis).
RESULTS
Study Population
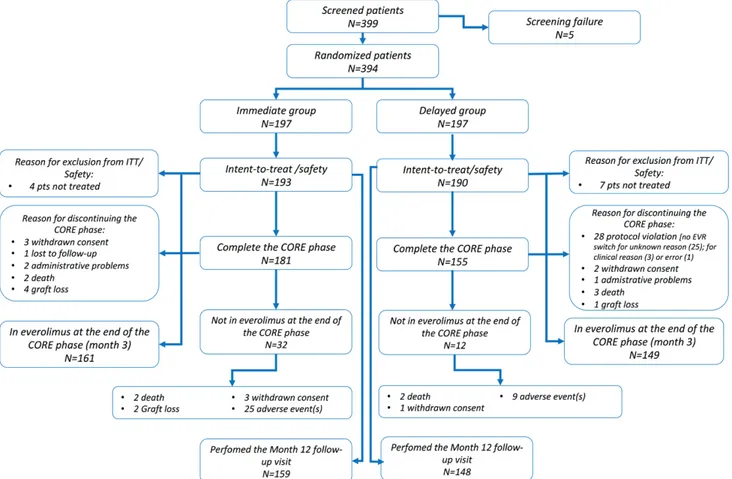
Three hundred ninety-nine patients were screened; of these, 394 were randomized (IE = 197; DE = 197), and 383 (98.2%) received ≥1 dose of the study drug and were included in both the intent-to-treat and the safety popu-lations. Two patients were treated differently than the assigned treatment arm; 336 patients out of 383 (87.7%) completed the 3-month study (IE = 181; DE = 155); of these, 310 (80.9%) (IE = 161 [81.7%]; DE = 149 [75.6%]) completed the CORE study on treatment. In particu-lar, 12 patients in the IE arm discontinued the study due to graft loss (n = 4); consent withdrawn (n = 3); death (n = 2); administrative reasons (n = 2); and lost to follow-up (n = 1). In the DE arm, 35 patients discontinued due to protocol violation (total n = 28; due to a nonswitch to
EVR for unknown reason n = 25; clinical reasons n = 2; error n = 1); death (n = 3); consent withdrawn (n = 2); graft loss (n = 1); or administrative reasons (n = 1). In the IE arm, 32 patients (16.2%) discontinued EVR at 3 months, mainly due to AEs (n = 24, 12.4%), while in the DE arm, only 12 patients (7.4%) required EVR discontinuation. Three hundred seven patients had their 12-month follow-up visit (IE = 159 [82.4%]; DE = 148 [77.9%]) (Figure 2). Demographics on recipients’ and donors’ baseline char-acteristics of the 2 treatment arms are detailed in Table 1.
In the DE arm, the switch to EVR was successful in 161 (84.7%) (median time to switch, 29 d [range, 24–62 d]).
At the end of CORE study, the majority of patients in
the IE arms were compliant with the C0–EVR protocol
(namely 76.2%, 80.4%, and 79.4% after 14 ± 4 and 28 ± 4 days and 3 mo, respectively), while 10% showed blood levels <3–8 ng/mL and 10% above such levels. In the DE arm, 91.8% of patients had levels within range, while in 8.2% of them, levels were below 3–8 ng/mL.
Primary Endpoint: WHCs
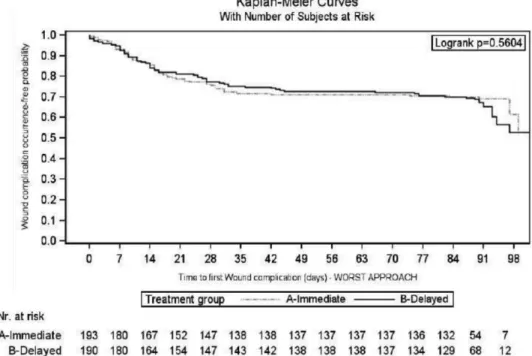
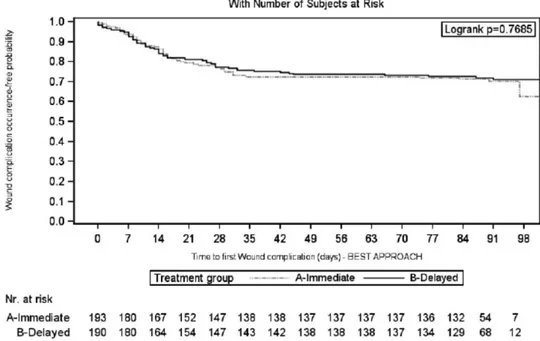
Considering the worst-case scenario, the 3-month rate of patients without WHC in the IE and DE arms was 0.68 (95% CI, 0.62-0.75) versus 0.62 (95% CI, 0.55-0.68) (log-rank test: P = 0.56) (Figure 3). This accounted for a 16% increase in the relative risk for WHC occurrence in the DE arm (HR, 1.16; 95% CI, 0.81-1.64; P = 0.42). The results were confirmed considering the best-case sce-nario (Figure 4); drop out patients seem to have a different impact on the results, according to the above scenarios,
especially in the DE arm, where 12.6% did not switch to EVR and therefore dropped out of the study (Table 2).
The most frequent complications were as follows: fluid collection (IE = 32 [16.6%] vs DE = 33 [17.4%]; P = 0.84) and lymphocele (IE = 20 [10.4%] vs DE = 30 [15.8%];
P = 012). A lower percentage of patients experienced
lym-phorrhea (IE = 5 [2.59%] vs DE = 13 [6.84%]; P = 0.05) and hematoma (IE = 14 [7.25%] vs DE = 5 [2.63%];
P = 0.04) (Table 3).
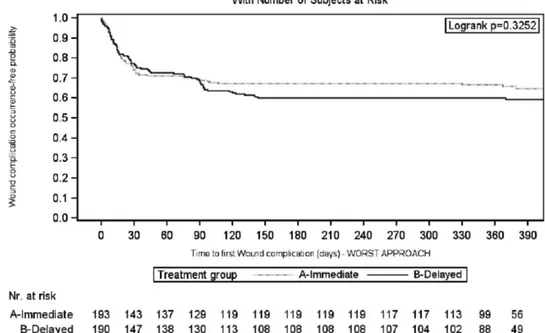
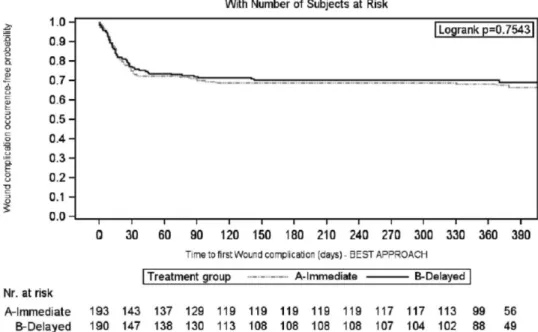
Similar results were observed over the entire follow-up period (12 mo), considering the worst- (Figure 5) and best-case (Figure 6) scenario (Table 2).
After 12 months, the DE arm showed a greater inci-dence of lymphocele versus the IE arm (IE = 21 [10.88%] vs DE = 35 [18.42%]; P = 0.04); conversely, the occurrence of hematoma was greater in the IE arm (IE = 15 [7.77%] vs DE = 5 [2.63%]; P = 0.02) (Table 3).
Considering the CORE phase and worst-case scenario, the multivariate Cox model identified ATG as a risk factor for the occurrence of WHC (HR, 1.62; 95% CI, 1.06-2.46;
P = 0.02); however, these findings were not confirmed in
the best-case scenario approach (HR, 1.47; 95% CI,
0.93-2.33; P = 0.10). BMI <25 kg/m2 was identified as a
predic-tor of WHC-free status at 12 months, both in the worst (HR, 0.66; 95% CI, 0.47-0.92; P = 0.02) and best-case sce-nario (HR, 0.64; 95% CI, 0.44-0.93; P = 0.02) (Table 4).
Secondary Efficacy Endpoints
At 3 months, considering the worst-case scenario, the composite efficacy treatment failure (ie, death/graft loss/ BPAR) was 22 in the IE arm (11.4%) versus 40 (21.0%) in the DE arm (log-rank: P = 0.06; HR, 1.54; 95% CI, 0.90-2.64; P = 0.11). Fitting the best-case scenario approach, the treatment failure rate was lower in both arms (IE = 16 [8.3%] vs DE = 13 [6.8%]; log-rank: P = 0.57; HR, 0.63;
TABLE 1.
Demographics and baseline recipient and donor charac-teristics (safety population)
Recipient
IE N = 193
DE N = 190
Age (y) at screening, mean (SD) 51.46 (11.37) 51.19 (12.29) Male (%) 134 (69.4) 132 (69.5) Presence of diabetes mellitus (%) 17 (8.8) 17 (9.0) BMIa, mean (SD) 24.65 (3.28) 24.41 (3.29) BMIa ≥25 (%) 89 (46.6) 86 (46.5) End-stage disease leading to KT (%)
Glomerulonephritis/glomerular disease 56 (29.0) 57 (30.0) Polycystic disease 45 (23.3) 40 (21.0) Hypertension/nephrosclerosis 32 (16.6) 17 (9.0) Pyelonephritis 5 (2.6) 3 (1.6) Diabetes mellitus 5 (2.6) 5 (2.6) Unknown origin 21 (10.9) 38 (20.0) Other 29 (15.0) 30 (17.8) PRA (%), mean (SD) 1.33 (6.57) 2.46 (8.13) Cold ischemia time (h), mean (SD)b 12.31 (4.90) 12.39 (5.50) Induction therapy (%)
Basiliximab 152 (78.8) 157 (82.6) ATG 37 (19.2) 31 (16.3)
None 4 (2.1) 2 (1.0)
Donor
Age (y), mean (SD) 52.77 (15.34) 53.21 (14.39) Male (%) 100 (51.8) 94 (49.5) Living donor (%)
Related 5 (2.6) 6 (3.2) Unrelated 3 (1.5) 5 (2.6)
aIE: N = 191; DE: N = 185.
bCold ischemia time considered only in deceased donor.
ATG, antithymocyte globuline; BMI, body mass index; DE, delayed everolimus; IE, immediate everolimus; KT, kidney transplantation; SD, standard deviation; PRA, panel reactive antibodies.
FIGURE 3. Kaplan-Meier curve of time to first wound healing complication during the first 3 mo after transplantation: worst-case
95% CI, 0.29-1.39; P = 0.25). The graft loss in IE was due to acute rejection (n = 3); primary nonfunction (n = 1); or graft artery thrombosis (n = 1), while in DE, it was due to renal vein thrombosis. The difference between the best- and the worst-case scenario approach was due to a dif-ference between the arms in the dropout rate, since in the DE arm, 12% (24/190) of patients did not switch to EVR. Similar results were observed considering the 12-month follow-up period (Table 5).
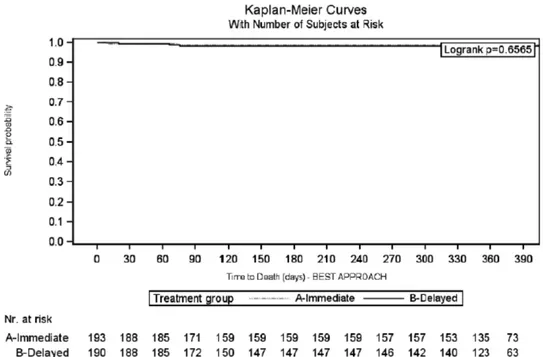
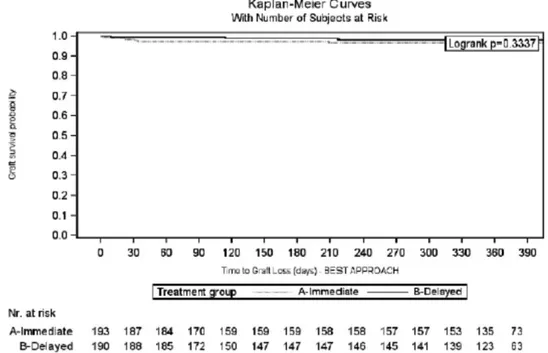
The 1-year patient and graft survival rates, in the IE and DE arms, were 99.0% versus 98.4% (log-rank: 0.6565) and 96.9% versus 98.4% (log-rank: 0.3337), respectively (Figures 7 and 8). Five patients died during the CORE study (IE = 2; DE = 3), due to acute myocardial infarction (IE = 1; DE = 1); cardiovascular accident (IE = 1; DE = 1); and cerebral hemorrhage (DE = 1). None of the deaths were considered by the investigators to be EVR related.
Considering the entire study period, no difference was observed either in BPAR (IE = 19 [9.84%] vs DE = 16 [8.42%]; P = 0.61) or in DGF (IE = 46 [23.8%] vs DE = 60 [31.6%]; P = 0.12) (Table 5).
No differences in renal function and proteinuria were observed at months 3 and 12 (Table 6).
Relevant concomitant medications are listed in Table 7.
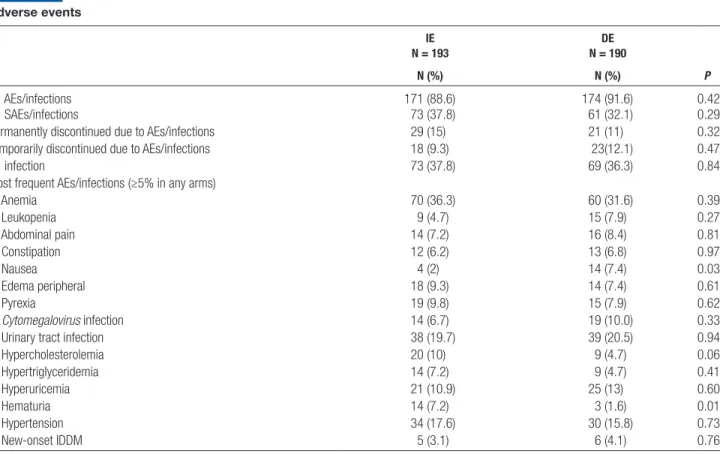
Adverse Events
There were no differences between the arms with regard to patients who experienced ≥1 AE/serious AE/infection or in the number of patients who discontinued treatment due to AE/infection (Table 8). Specifically, 171 patients (88.6%) in the IE arm versus 174 (91.6%) in the DE arm experienced ≥1 AE (P = 0.42); of these AEs, 71 (36.8%) in the IE arm and 53 (27.9%) in the DE arm were con-sidered EVR related (P = 0.06). The shorter exposure to
FIGURE 4. Kaplan-Meier curve of time to first wound healing complication during the first 3 mo after transplantation: best-case
scenario approach (intent-to-treat population).
TABLE 2.
WHC at 3 and 12 mo: ITT population IE N = 193 DE N = 190 Log-rank Cox proportional hazard model: DE vs IE N (%) 95% CI N (%) 95% CI HR (95% CI) P
3 mo: worst case
Patients without WHC 132 (68.4) 62-75 117 (61.6) 55-68 0.5604 1.16 (0.81-1.64) 0.4156 3 mo: best case
Patients without WHC 136 (70.5) 64-77 136 (71.6) 65-78 0.7685 0.98 (0.67-1.43) 0.8997 12 mo: worst case
Patients without WHC 127 (65.8) 59-72 113 (59.5) 52-66 0.3252 1.21 (0.86-1.69) 0.2757 12 mo: best case
Patients without WHC 131 (67.9) 61-74 132 (69.5) 63-76 0.7543 0.97 (0.67-1.40) 0.8667
In the Cox proportional hazard model, the following confounding factors were included: age at KT, BMI (<25 vs ≥25), center dimension (>10 vs ≤10), presence of diabetes mellitus, and induction (ATG vs basiliximab).
ATG, antithymocyte globuline; BMI, body mass index; CI, confidence interval; DE, delayed everolimus; HR, hazard ratio; IE, immediate everolimus; ITT, intent-to-treat; KT, kidney transplantation; WHC, wound healing complications.
EVR in the DE arm and the fact that 12% of patients did not switch to EVR may have contributed to this result. Patients who showed ≥1 serious AE/infection in the IE versus DE arm were 73 (37.8%) and 61 (32.1%), respec-tively (P = 0.29). Patients who permanently or temporarily discontinued EVR due to AEs/infections in the IE versus DE arm were 29 (15.0%) versus 21 (11.1%) (P = 0.32) and 18 (9.3%) versus 23 (12.1%) (P = 0.47), respectively.
Thirty-three patients experienced ≥1 cytomegalovirus infection (IE = 14 [7.2%] and DE = 19 [10%]; P = 0.33). Of them, only 6 recipients (14%) received cytomegalovirus prophylaxis (P = 0.19). Eleven patients experienced new onset of diabetes mellitus (IE = 5 [3.1%] vs DE = 6 [4.1%];
P = 0.76) (Table 8).
Considering the overall cohort, 1 patient (in the DE arm) experienced a new occurrence of renal cancer.
DISCUSSION
The immediate introduction of EVR after KT does not increase the risk of WHC. In fact, in our population, the DE use was not associated with a decreasing risk of WHC versus those who received IE. Both the worst- and best-case scenario of this analysis—which were fitted to avoid any bias due to missing information—clearly showed that no difference in terms of WHC was identified between the arms. The immediate use of EVR in the study period resulted in a WHC-free rate between 68% and 70% (considering the worst- and best-case approach) versus 62% and 72% in those who received a delayed dose; the most common complications in IE were fluid collection (17%), lymphocele (10%), and wound dehiscence (6%), which were not different at 3 months from the DE arm. Interestingly, at 12 months, the DE arm showed a higher incidence of lymphocele, while hematoma seemed to be more frequent in the IE arm. The risk of WHC increased by >60% in case of use of ATG induction, confirming what
already stated by Pourmand et al32 in 2012, suggesting that
Ab-IL2-R (namely Basiliximab) should be an induction of choice in mTORi-based IS (also in the delayed introduc-tion protocol). The risk also increases in obese recipients
(BMI, >30 kg/m2)27; in fact, in our series, BMI <25 kg/
m2 proved to have a protective role on WHC; therefore,
we suggest to avoid a combination therapy of ATG and mTORi, especially in overweight recipients to decrease the “synergistic effects” on WHC.
TABLE 3.
Wound healing complication details at 3 and 12 mo: ITT population IE N = 193 DE N = 190 P N (%) N (%) Occurred within 3 mo Lymphorrhea 5 (2.6) 13 (6.8) 0.0493 Hematoma 14 (7.2) 5 (2.6) 0.0373 Lymphocele 20 (10.4) 30 (15.8) 0.1150 Fluid collection 32 (16.6) 33 (17.4) 0.8372 Wound dehiscence 11 (5.7) 5 (2.6) 0.1335 Wound infections 7 (3.6) 6 (3.2) 0.7999 Incisional hernia 0 3 (1.2) 0.1211 Occurred within 12 mo Lymphorrhea 6 (3.1) 13 (6.8) 0.0925 Hematoma 15 (7.8) 5 (2.6) 0.0238 Lymphocele 21 (10.9) 35 (18.4) 0.0368 Fluid collection 34 (17.6) 37 (19.5) 0.6401 Wound dehiscence 12 (6.2) 5 (2.6) 0.0884 Wound infections 7 (3.6) 6 (3.2) 0.7999 Incisional hernia 2 (1.0) 3 (1.6) 0.6834
P values were calculated by means of a chi-square test except for hernia, where the Fisher exact
test was used.
DE, delayed everolimus; IE, immediate everolimus; ITT, intent-to-treat.
FIGURE 5. Kaplan-Meier curve of time to first wound healing complication during the 12 mo after transplantation: worst-case scenario
Even if no robust data had previous showed the clear role of mTORi on WHC in the KT setting, these results seem to be consistent with the preliminary issues and previously mentioned CALLISTO study, in which no difference was observed in the incidence or severity of WHC in KT recipients receiving either micophenolate mofetil (MMF) or EVR as de novo immunosuppressive
drug.28
These findings, on the contrary, differ from the stud-ies on sirolimus-based IS, since sirolimus seems to lead to
WHC following KT17,19-22; the intriguing question thus
arises as to why a difference may potentially exist between each other. Pharmacokinetic variations (higher
bioavail-ability and shorter half-life of EVR)33-35 or the loading
doses and high exposure level of sirolimus immediately after KT may partly contribute to explaining the difference between the drugs. The high sirolimus exposure (namely
C0, 8–30 ng/mL) in the first clinical experiences and
asso-ciation with MPA in CNI-free protocol immediately after transplantation can explain the unfavorable effect on
wound healing.26
In 2013, Cooper et al36 showed that the higher blood
level of EVR (namely >8 ng/mL) was also associated with an increasing risk (HR, 1.69; 95% CI, 1.20-2.38;
P = 0.002) of WHC and the initial dose of 1.5 mg seems to
be more protective than 3 mg with regard to WHC. Even if the present study has not explored the role of EVR blood levels on the incidence of WHC (only 10% of patients in the IE arm were above 3–8 ng/mL), we are strongly con-vinced that a dose adjustment aimed at maintaining a level between 3 and 8 ng/mL is fundamental to decrease or avoid the WHC.
The role of EVR on wound healing was also inves-tigated in heart transplantation by the so-called EVERHEART study. Similar in study design to the pre-sent trial, the study showed no superiority in terms of WHC in the DE arm; however, similarly to CALLISTO, the study was not powered for WHC only, but for
composite end-points (ie, wound healing delays, peri-cardial and pleural effusion, and renal insufficiency). Therefore, it was not fit to investigate the final role of
EVR in wound healing.33
In the study period, treatment failure does not sig-nificantly differ between the arms, but—when consider-ing the entire follow-up period (12 mo) and worst-case scenario—the immediate introduction of EVR seems to be superior, mostly in the graft loss and death rates; this results, however, should not be considered consistent, since they were not confirmed in the best-case scenario, so they cannot be considered conclusive. The 12-month BPAR rate in the IE arm was about 10%, therefore over 10% less than in the CALLISTO study; this first of all confirms the high efficacy of the IE regimen, and also indicates that a high CNI-exposure immediately after KT can be safely avoided. This can also be confirmed by the rate of DGF; as a matter of fact, the IE and DE arms showed the same DGF rates (23% vs 30%); these results are completely in accordance with the
CALLISTO study (25%) and larger Symphony study,19
which reported DGF rates ranging between 32% and 36% in CNI-treated recipients. From the current study and CALLISTO series, we can assert—albeit in
disagree-ment with other single experiences17,18,34,35—that the
immediate use of mTORi does not influence the initial poor function in KT, a finding that was also confirmed by a similar renal function assessed between the treat-ment arms throughout the follow-up.
Finally, permanent or temporary discontinuations of EVR were much less than in the CALLISTO study; indeed, in our series, the IE arm permanently discon-tinued therapy in only 15% of the cases and tempo-rarily in 9%, while in the DE arm, discontinuation occurred in about 12% of the cases. Controversially, the CALLISTO series reported a 25% discontinuation rate; this could be explained—as stated by the authors themselves—by the higher EVR trough levels reached
FIGURE 6. Kaplan-Meier curve of time to first wound healing complication during the 12 mo after transplantation: best-case scenario
in the DE arm in order, we argue, to avoid an allograft rejection after a decrease in the dose of CNI and the discontinuation of MPA.
The main drawback of the present study is that about 20% of patients in the IE arm and 25% in the DE arm did not complete the CORE-phase study, resulting in a
TABLE 4.
Cox multivariate analysis on the main risk factors influencing the WHC
Time point Approach Factors HR (95% CI) β estimate (SE) P
3 mo Worst case Age at transplantation (y) 0.01 (0.01) 0.4674 BMI <25 vs ≥25 kg/m2 0.76 (0.53-1.08) 0.1262 Center size >10 vs ≤10 patients 1.46 (0.78-2.73) 0.2353 Diabetes mellitus Yes vs no 0.91 (0.48-1.73) 0.7793 Treatment arm
Delayed everolimus vs immediate everolimus 1.16 (0.81-1.64) 0.4156 Type of induction
ATG (antithymocyte globulin) vs basiliximab (Simulect) 1.62 (1.06-2.46) 0.0246 12 mo Worst case Age at transplantation (y) 0.00 (0.01) 0.5488
BMI <25 vs ≥25 kg/m2 0.66 (0.47-0.92) 0.0159 Center size >10 vs ≤10 patients 1.40 (0.77-2.53) 0.2720 Diabetes mellitus Yes vs no 0.81 (0.43-1.52) 0.5035 Treatment arm
Delayed everolimus vs immediate everolimus 1.21 (0.86-1.69) 0.2757 Type of induction
ATG (antithymocyte globulin) vs basiliximab (Simulect) 1.47 (0.98-2.20) 0.0653 3 mo Best case Age at transplantation (y) 0.01 (0.01) 0.3828
BMI <25 vs ≥25 kg/m2 0.74 (0.50-1.08) 0.1214 Center size >10 vs ≤10 patients 1.42 (0.72-2.82) 0.3154 Diabetes mellitus Yes vs no 0.93 (0.48-1.82) 0.8312 Treatment arm
Delayed everolimus vs immediate everolimus 0.98 (0.67-1.43) 0.8997 Type of induction
ATG (antithymocyte globulin) vs basiliximab (Simulect) 1.47 (0.93-2.33) 0.0976 12 mo Best case Age at transplantation (y) 0.01 (0.01) 0.4389
BMI <25 vs ≥25 kg/m2 0.64 (0.44-0.93) 0.0184 Center size >10 vs ≤10 patients 1.58 (0.80-3.13) 0.1871 Diabetes mellitus Yes vs no 0.84 (0.43-1.64) 0.6161 Treatment arm
Delayed everolimus vs immediate everolimus 0.97 (0.67-1.40) 0.8667 Type of induction
ATG (antithymocyte globulin) vs basiliximab (Simulect) 1.40 (0.90-2.18) 0.1403
Cox analysis modeled the risk to the first wound healing complication during the 3- and 12-mo periods. Since the EVR dosage was set to 1.5 mg daily in all study populations (for both arms) and 80% of patients were within the protocol target blood levels range (namely 3–8 ng/mL), the multivariate Cox regression was not fitted, considering either the EVR set dose or EVR blood levels >8 ng/mL as a risk factor (too few cases to justify the analysis); a posthoc analysis of the incidence of wound events between patients out of C0-EVR target level (ie, above or below 3–8 ng/mL) at any time during the 3 mo of the study vs patients who remained into target level at each time point (in both arms) showed no differences between patients’ target level IN vs target level OUT. The incidence of 3 mo BPAR rate/corticosteroid bolus use was 5% (n: 20/383; IE: 11; DE: 9); thus, it was not considered in the Cox model. According to the best-case scenario approach, “failure” (≥1 healing complication) consisted of one of the following cases: wound complication, missing information about wound complications for patients who discontinued the study due to “death” or “graft loss,” and study discontinuation due to “death” or “graft loss” for patients who did not attend the month 12 follow-up visit. According to the worst-case scenario, “failure” (≥1 healing complication) consisted of one of the following cases: wound complication, missing information about wound complications, and study discontinuation due to any reason for patients who did not undergo the month 12 follow-up visit. Failure time was defined by the date of first wound complication or that of last visit performed.
ATG, antithymocyte globuline; BMI, body mass index; BPAR, biopsy-proven acute rejection; C0, immunosuppression blood levels, before morning dose; CI, confidence interval; DE, delayed everolimus;
slightly decrease in the previous sample size powered for the aim of the study. In addition, patients were followed up to 3 months, and some WHCs (ie, lymphocele and incisional hernia) need more time to be evaluated con-clusively. This limitations were managed adding a fol-low-up at 12 months even if, during this observational period, patients were treated—as per clinical prac-tice—in 22 different centers, and therefore, they were monitored less strictly than during the first 3 months. Furthermore, the article is not generalizable to all KT
patients since it lack the presence of severe obese recipi-ents that could sustain WHC.
Although the enrollment of a small proportion of liv-ing KT donors could seem to be a limitation of the study, we think that it is representative of the real setting of KT
in Italy37 without affecting the study end-points, since
only 5% of the study cohort received a kidney from living donors.
In conclusion, treating patients with DE-based IS after KT does not decrease the risk of WHC after KT; hence,
TABLE 5.
Secondary efficacy endpoint at 3 and 12 mo: ITT population IE
N = 193
DE
N = 190 Log-rank
Cox proportional hazard model: DE vs IE
N (%) 95% CI N (%) 95% CI P HR (95% CI) P
3 mo
Treatment failure (worst-case scenario) 22 (11.4) 7-16 40 (21.0) 15-27 0.0591 1.54 (0.90-2.64) 0.1129 Treatment failure (best-case scenario) 16 (8.3) 4-12 13 (6.8) 3-10 0.5731 0.63 (0.29-1.39) 0.2527 BPAR 11 (5.7) 2-9 9 (4.7) 2-8 0.6539 0.74 (0.30-1.85) 0.5232 D 2 (1.0) 0-2 3 (1.6) 0-3 0.6565 0.55 (0.05-6.30) 0.6326 D/GL 7 (3.6) 1-6 4 (2.1) 0-4 0.3634 0.28 (0.06-1.34) 0.1116 GL 5 (2.6) 0-5 1 (0.5) 0-2 0.1027 0.19 (0.02-1.61) 0.1269 12 mo
Treatment failure (worst-case scenario) 31 (16.1) 11-21 48 (25.3) 19-31 0.0565 1.43 (0.90-2.27) 0.1291 Treatment failure (best-case scenario) 25 (12.9) 8-18 21 (11.0) 7-16 0.5546 0.69 (0.37-1.27) 0.2302 BPAR 19 (9.8) 6-14 16 (8.4) 4-12 0.6110 0.76 (0.38-1.52) 0.4338 D 2 (1.0) 0-2 3 (1.6) 0-3 0.6565 0.55 (0.05-6.30) 0.6326 D/GL 8 (4.1) 1-7 6 (3.2) 1-6 0.6085 0.48 (0.15-1.61) 0.2372 GL 6 (3.1) 1-6 3 (1.6) 0-3 0.3337 0.49 (0.12-1.95) 0.3084
In the Cox proportional hazard model, the following confounding factors were included: age at KT, BMI (<25 vs ≥25), center dimension (>10 vs ≤10), presence of diabetes mellitus, and induction (ATG vs basiliximab).
ATG, antithymocyte globuline; BMI, body mass index; BPAR, biopsy-proven acute rejection; CI, confidence interval; D, death; DE, delayed everolimus; GL, graft loss; HR, hazard ratio; IE, immediate everolimus; ITT, intent-to-treat; KT, kidney transplantation.
de novo EVR does not expose KT recipients to a higher risk of WHC and also maintains a good efficacy and safety profile. Further studies are needed to confirm the clear role
of ATG on WHC, since in the current trial a risk factor was considered only when a worst-case scenario analysis was fitted.
FIGURE 8. Graft survival analysis during the first 12 mo after transplantation: Kaplan-Meier curve (intent-to-treat population).
TABLE 6. Graft function IE N = 193 DE N = 190 P Follow-up: 3 mo DGFa (%) 46 (23.8) 60 (31.6) 0.1232b
Days of dialysis, mean (SD) 16.17 (22.8) 9.40 (13.05) 0.2261c eGFR–MDRD4 (mL/min), mean (SD) N = 187 N = 183
At M3 48.82 (23.9) 49.21 (22.7) –
Changes vs baseline 38.64 (22.4) 39.13 (21.5) 0.9716d Serum creatinine (mg/dL), mean (SD) N = 187 N = 183
At M3 2.02 (1.8) 1.80 (1.0) –
Changes vs baseline −4.79 (2.7) −5.13 (2.3) 0.1191d Proteinuria,e n/N (%) 8/141 (5.7) 8/138 (5.8) 0.07f Follow-up: 12 mo
DGFa (%) 46 (23.8) 60 (31.6) 0.1232b
Days of dialysis, mean (SD) 16.17 (22.8) 9.40 (13.05) 0.2261c eGFR–MDRD4 (mL/min), mean (SD) N = 151 N = 142
At M12 51.57 (19.3) 51.77 (20.7) –
Changes vs baseline 41.26 (18.7) 41.56 (19.9) 0.7137d Serum creatinine (mg/dL), mean (SD) N = 151 N = 142
At M12 1.67 (1.0) 1.67 (0.8) –
Changes vs baseline −4.96 (2.5) −5.22 (2.2) – Proteinuria,e n/N (%) 9/116 (7.8) 11/115 (9.6) – aDGF defined as kidney allograft rejection with final clinical diagnosis “DGF” or the presence of postoperative dialysis started during the first 7 d following the transplant.
bChi-square test. c Wilcoxon test.
dNonparametric ANCOVA model taking into account the following covariates: eGFR at baseline, center size, diabetes mellitus, and age at KT.
eProteinuria was defined as value >1000 mg/d if assessed in urine collected in 24 h or a value >1.0 if measured on the urine protein/creatinine concentration ratio in a spot urine sample. fWald test from logistic regression analysis, taking into account the following factors: age at KT and diabetes mellitus.
DE, delayed everolimus; DGF, delayed graft function; eGFR, estimated glomerular filtration rate; IE, immediate everolimus; KT, kidney transplantation; M, month; MDRD, modification of diet in renal diseases; SD, standard deviation.
ACKNOWLEDGMENTS
The authors would like to thank Marta Bartezaghi and Roberto Orsenigo, at Novartis Farma Italia, for their sta-tistical and editorial assistance.
REFERENCES
1. Pascual J. Everolimus in clinical practice--renal transplantation. Nephrol Dial Transplant. 2006;21(Suppl 3):iii18–iii23.
2. Nashan B. Induction therapy and mTOR inhibition: minimizing cal-cineurin inhibitor exposure in de novo renal transplant patients. Clin Transplant. 2013;27(Suppl 25):16–29.
3. Budde K, Zeier M, Witzke O, et al; HERAKLES Study Group. Everolimus with cyclosporine withdrawal or low-exposure cyclo-sporine in kidney transplantation from month 3: a multicentre, rand-omized trial. Nephrol Dial Transplant. 2017;32:1060–1070.
4. Carmellini M, Collini A, Ruggieri G, et al. Excellent long-term results in de novo renal transplant recipients treated with proliferation sig-nal inhibitors and reduced calcineurin inhibitors exposure. Transplant Proc. 2008;40:1858–1861.
5. Ponticelli C, Scolari MP. Calcineurin inhibitors in renal transplanta-tion still needed but in reduced doses: a review. Transplant Proc. 2010;42:2205–2208.
6. Schuler W, Sedrani R, Cottens S, et al. SDZ RAD, a new rapa-mycin derivative: pharmacological properties in vitro and in vivo. Transplantation. 1997;64:36–42.
7. Dunn C, Croom KF. Everolimus: a review of its use in renal and cardiac transplantation. Drugs. 2006;66:547–570.
8. Vitko S, Tedesco H, Eris J, et al. Everolimus with optimized cyclo-sporine dosing in renal transplant recipients: 6-month safety and efficacy results of two randomized studies. Am J Transplant. 2004;4:626–635.
9. Tedesco-Silva H Jr, Vitko S, Pascual J, et al; 2306 and 2307 Study Groups. 12-month safety and efficacy of everolimus with reduced
TABLE 7. Concomitant medications Overall IE N = 193 DE N = 190 Antibiotic prophylaxis (%) Mean (SD), d 192 (99.48) 67.68 (36.49) 186 (97.89) 65.99 (37.84) Lipid-modifying agents (%) 74 (38.34) 67 (35.26) ARBs (%) 12 (6.22) 26 (13.68) α2-Andrenergic (%) 55 (28.50) 65 (34.21) β-Blockers (%) 99 (51.30) 80 (42.11)
Calcium channel blockers (%) 105 (54.40) 96 (50.53)
Diuretics (%) 153 (79.27) 146 (76.84)
ARBs, angiotensin receptor blockers; DE, delayed everolimus; IE, immediate everolimus.
TABLE 8. Adverse events IE N = 193 DE N = 190 P N (%) N (%) ≥1 AEs/infections 171 (88.6) 174 (91.6) 0.42 ≥1 SAEs/infections 73 (37.8) 61 (32.1) 0.29
Permanently discontinued due to AEs/infections 29 (15) 21 (11) 0.32 Temporarily discontinued due to AEs/infections 18 (9.3) 23(12.1) 0.47
≥1 infection 73 (37.8) 69 (36.3) 0.84
Most frequent AEs/infections (≥5% in any arms)
Anemia 70 (36.3) 60 (31.6) 0.39 Leukopenia 9 (4.7) 15 (7.9) 0.27 Abdominal pain 14 (7.2) 16 (8.4) 0.81 Constipation 12 (6.2) 13 (6.8) 0.97 Nausea 4 (2) 14 (7.4) 0.03 Edema peripheral 18 (9.3) 14 (7.4) 0.61 Pyrexia 19 (9.8) 15 (7.9) 0.62 Cytomegalovirus infection 14 (6.7) 19 (10.0) 0.33 Urinary tract infection 38 (19.7) 39 (20.5) 0.94
Hypercholesterolemia 20 (10) 9 (4.7) 0.06 Hypertriglyceridemia 14 (7.2) 9 (4.7) 0.41 Hyperuricemia 21 (10.9) 25 (13) 0.60 Hematuria 14 (7.2) 3 (1.6) 0.01 Hypertension 34 (17.6) 30 (15.8) 0.73 New-onset IDDM 5 (3.1) 6 (4.1) 0.76
P value was calculated by means of chi-square test.
exposure cyclosporine in de novo renal transplant recipients. Transpl Int. 2007;20:27–36.
10. Chan L, Greenstein S, Hardy MA, et al; CRADUS09 Study Group. Multicenter, randomized study of the use of everolimus with tac-rolimus after renal transplantation demonstrates its effectiveness. Transplantation. 2008;85:821–826.
11. Nashan B, Curtis J, Ponticelli C, et al; 156 Study Group. Everolimus and reduced-exposure cyclosporine in de novo renal-transplant recipients: a three-year phase II, randomized, multicenter, open-label study. Transplantation. 2004;78:1332–1340.
12. Schuurman HJ, Pally C, Weckbecker G, et al. SDZ RAD inhib-its cold ischemia-induced vascular remodeling. Transplant Proc. 1999;31:1024–1025.
13. Farb A, John M, Acampado E, et al. Oral everolimus inhibits in-stent neointimal growth. Circulation. 2002;106:2379–2384.
14. Nishimura T, Faul JL, Berry GJ, et al. 40-O-(2-hydroxyethyl)-rapamycin attenuates pulmonary arterial hypertension and neointimal formation in rats. Am J Respir Crit Care Med. 2001;163:498–502.
15. Waksman R, Pakala R, Baffour R, et al. Optimal dosing and duration of oral everolimus to inhibit in-stent neointimal growth in rabbit iliac arteries. Cardiovasc Revasc Med. 2006;7:179–184.
16. Cole OJ, Shehata M, Rigg KM. Effect of SDZ RAD on trans-plant arteriosclerosis in the rat aortic model. Transtrans-plant Proc. 1998;30:2200–2203.
17. Troppmann C, Pierce JL, Gandhi MM, et al. Higher surgical wound com-plication rates with sirolimus immunosuppression after kidney transplan-tation: a matched-pair pilot study. Transplantation. 2003;76:426–429. 18. Goel M, Flechner SM, Zhou L, et al. The influence of various
mainte-nance immunosuppressive drugs on lymphocele formation and treat-ment after kidney transplantation. J Urol. 2004;171:1788–1792. 19. Ekberg H, Tedesco-Silva H, Demirbas A, et al; ELITE-Symphony
Study. Reduced exposure to calcineurin inhibitors in renal transplan-tation. N Engl J Med. 2007;357:2562–2575.
20. Langer RM, Kahan BD. Incidence, therapy, and consequences of lym-phocele after sirolimus-cyclosporine-prednisone immunosuppression in renal transplant recipients. Transplantation. 2002;74:804–808. 21. Valente JF, Hricik D, Weigel K, et al. Comparison of sirolimus vs.
mycophenolate mofetil on surgical complications and wound healing in adult kidney transplantation. Am J Transplant. 2003;3:1128–1134. 22. Dean PG, Lund WJ, Larson TS, et al. Wound-healing complications
after kidney transplantation: a prospective, randomized comparison of sirolimus and tacrolimus. Transplantation. 2004;77:1555–1561. 23. Kuppahally S, Al-Khaldi A, Weisshaar D, et al. Wound healing
compli-cations with de novo sirolimus versus mycophenolate mofetil-based regimen in cardiac transplant recipients. Am J Transplant. 2006;6(5 Pt 1):986–992.
24. Zuckermann A, Manito N, Epailly E, et al. Multidisciplinary insights on clinical guidance for the use of proliferation signal inhibitors in heart transplantation. J Heart Lung Transplant. 2008;27:141–149. 25. Fine NM, Kushwaha SS. Recent advances in mammalian
tar-get of rapamycin inhibitor use in heart and lung transplantation. Transplantation. 2016;100:2558–2568.
26. Nashan B, Citterio F. Wound healing complications and the use of mammalian target of rapamycin inhibitors in kidney transplantation: a critical review of the literature. Transplantation. 2012;94:547–561. 27. Tiong HY, Flechner SM, Zhou L, et al. A systematic approach to
mini-mizing wound problems for de novo sirolimus-treated kidney trans-plant recipients. Transtrans-plantation. 2009;87:296–302.
28. Dantal J, Berthoux F, Moal MC, et al; RAD A2420 Study Group. Efficacy and safety of de novo or early everolimus with low cyclo-sporine in deceased-donor kidney transplant recipients at specified risk of delayed graft function: 12-month results of a randomized, mul-ticenter trial. Transpl Int. 2010;23:1084–1093.
29. Lich R Jr, Howerton LW, Davis LA. Childhood urosepsis. J Ky Med Assoc. 1961;59:1177–1179.
30. Gregoir W. Congenital vesico-ureteral reflux. Acta Urol Belg. 1962;30:286–300.
31. Rodriguez BL, Abbott RD, Fujimoto W, et al; American Diabetes Association; World Health Organization. The American Diabetes Association and World Health Organization classifications for diabe-tes: their impact on diabetes prevalence and total and cardiovascular disease mortality in elderly Japanese-American men. Diabetes Care. 2002;25:951–955.
32. Pourmand GR, Dehghani S, Saraji A, et al. Relationship between post-kidney transplantation antithymocyte globulin therapy and wound healing complications. Int J Organ Transplant Med. 2012;3:79–84. 33. Potena L, Pellegrini C, Grigioni F, et al; EVERHEART Investigators.
Optimizing the safety profile of everolimus by delayed initiation in de novo heart transplant recipients: results of the prospective rand-omized study EVERHEART. Transplantation. 2018;102:493–501. 34. Barsoum RS, Morsey AA, Iskander IR, et al. The Cairo kidney center
protocol for rapamycin-based sequential immunosuppression in kidney transplant recipients: 2-year outcomes. Exp Clin Transplant. 2007;5:649–657.
35. Boratynska M, Banasik M, Patrzalek D, et al. Impact of sirolimus treat-ment in kidney allograft recipients with prolonged cold ischemia times: 5-year outcomes. Exp Clin Transplant. 2008;6:59–66.
36. Cooper M, Wiseman AC, Zibari G, et al. Wound events in kidney trans-plant patients receiving de novo everolimus: a pooled analysis of three randomized controlled trials. Clin Transplant. 2013;27:E625–E635. 37. National Transplant Center. Transplants. Available at