Sol gel graphene/TiO
2
nanoparticles for the photocatalytic-assisted sensing
and abatement of NO
2
Andrea Giampiccolo
a,⁎, David Maria Tobaldi
b, Salvatore Gianluca Leonardi
c,
Billy James Murdoch
d,1, Maria Paula Seabra
b, Martin P. Ansell
a, Giovanni Neri
c, Richard J. Ball
a,⁎ aBRE Centre for Innovative Construction Materials, Department of Architecture and Civil Engineering, University of Bath, Bath, BA2 7AY, UKbDepartment of Materials and Ceramic Engineering, CICECO– Aveiro Institute of Materials, University of Aveiro, Campus Universitário de Santiago, 3810-193 Aveiro,
Portugal
cDepartment of Engineering, University of Messina, C.da Di Dio, I-98166 Messina, Italy
dNational EPSRC XPS Users’ Service (NEXUS), School of Mechanical and Systems Engineering, Newcastle University, Newcastle upon Tyne, Tyne and Wear, NE1 7RU,
UK A R T I C L E I N F O Keywords: Photocatalysts TiO2nanoparticles Graphene Sensor A B S T R A C T
Human exposure to volatile organic compounds and NO2can lead to health problems, therefore strategies to mitigate against the risks are required. Abatement and sensing are approaches which could both neutralise and monitor these species thus providing a safer environment and warning occupants of harmful levels. This paper presents pure TiO2and TiO2/graphene hybrids synthesized through a sol-gel route. Electron optical, helium ion microscopy, X-ray diffraction and spectroscopic methods have been applied to elucidate the physical and che-mical behaviour. NO2sensing properties of TiO2/graphene hybrids formed by the addition of graphene to the reaction vessel prior to initiating the sol gel reaction followed by annealing (GTiO2S), and an alternative manufacturing method involving the addition of graphene to TiO2nanoparticles which had already been an-nealed (GTiO2M) were compared and evaluated. A conductometric sensor based on TiO2/graphene prepared using materialGTiO2S showed a higher response to NO2compared to sensors based on pure TiO2and TiO2/ graphene prepared with materialGTiO2M. Under UV irradiation generated by a low power LED, the sensor showed a remarkably enhanced response to 1750 ppb NO2, about double the response in the dark, and a limit of detection of about 50 ppb of NO2(Signal/Noise = 3). Photocatalytic tests to assess the degradation of NOx showed that TiO2/graphene hybrids using materialGTiO2S were the most active amongst the whole series of TiO2-based materials. Our data highlights the unique characteristics of materialGTiO2S TiO2/graphene and the suitability for multi-purpose applications in thefield of environmental monitoring and remediation. The cap-ability of the material for both sensing and abatement of NOxcould be exploited to offer a safer environment through providing a warning of the presence of NOxwhilst also reducing levels.
1. Introduction
Awareness of the health risks associated with the presence of at-mospheric pollutants and volatile organic compounds (VOCs) in the indoor and outdoor environment is stimulating research aimed at im-proving air quality. In the UK each year approximately 40,000 deaths can be attributed to outdoor air pollution. Many major health chal-lenges of modern societies such as cancer, asthma, stroke, heart disease, diabetes, obesity and dementia can be linked to air pollution. The
development of materials with the ability to detect and neutralise air pollutants are important for emerging technologies which will mitigate their harmful effects. Since the discovery of the photocatalytic (PC) water splitting properties of TiO2by Honda and Fujishima in 1972 [1],
the application of semiconductors, such as titanium dioxide (TiO2), for
the photo-degradation of VOCs and inorganic pollutants has increased exponentially in the last 30 years [2–5]. The extensive use of TiO2is
attributed to the ratio of cost to PC activity, low toxicity and its band gap of 3.2 eV (when in the anatase polymorph) that is activated when
https://doi.org/10.1016/j.apcatb.2018.10.032
Received 9 July 2018; Received in revised form 6 October 2018; Accepted 13 October 2018 ⁎Corresponding authors.
1Currently at School of Science, RMIT University, VIC 3001, Melbourne, Australia.
E-mail addresses:[email protected](A. Giampiccolo),[email protected],[email protected](D.M. Tobaldi),
[email protected](S.G. Leonardi),[email protected](B.J. Murdoch),[email protected](M.P. Seabra),[email protected](M.P. Ansell),
[email protected](G. Neri),[email protected](R.J. Ball).
Available online 15 October 2018
0926-3373/ © 2018 The Authors. Published by Elsevier B.V. This is an open access article under the CC BY license (http://creativecommons.org/licenses/BY/4.0/).
the semiconductor is irradiated by ultraviolet (UV) light [6]. The por-tion of UV in the solar spectrum only accounts for a few percent in the outdoor environment and even lower indoors [7]. The amount of UV in solar radiation greatly reduces the ability of TiO2to catalyse the
oxi-dations or reductions of harmful compounds into less dangerous ones such as water and carbon dioxide. PC performance can be modified by several different methods including modification of the band gap and doping with additional elements such as transition metals, noble metals and non-metallic elements [8–10]. Coupling the TiO2with additional
structures or compounds such as other semiconductors, organic mole-cules or oxides can improve PC performance [11–14]. Graphene with its unique electron properties has been combined with TiO2 in several
studies to improve performance [15–19]. Some studies have proven that graphene has electron accepting and transport properties that can be successfully used to improve the recombination time in the semi-conductor [20].
TiO2in the form of nanoparticles (NPs) has a widespread use in the
improvement of indoor and outdoor air quality [2,21–24]. Poor indoor air quality (IAQ) can be attributed to emission of inorganic pollutants and VOCs from a variety of materials in buildings [25–29], including furnishing, paints, carpets and air fresheners. The presence of various pollutants contribute to sick building syndrome (SBS) [30,31], which is the negative impact of a buildings environment on the life and well-being of its inhabitants.
Among these pollutants, NO2contributes largely to poor IAQ. This
toxic gas is produced from ground-level emissions related to the burning of fossil fuels from vehicles, power plants, industrial sources, and off-road equipment. Several air cleaning technologies have been therefore developed to improve IAQ by reducing NO2concentration
levels [32,33]. PC materials based on TiO2are the most used for the
design of highly efficient systems for environmental reduction of NOx
[34].
Long term exposure to NO2concentrations higher than those
nor-mally found in the ambient air are known to cause an increased risk of acute respiratory illnesses, especially in vulnerable groups. To address concerns associated with NOxlevels the US Environmental Protection
Agency (EPA) has set a 1-hour NO2standard at the level of 100 ppb
[35]. Sensors that continuously monitor these low NO2concentrations
in air with the added capability of alerting occupants when NO2levels
have reached harmful levels could be a powerful strategy in the pre-vention of unacceptable exposure. Both solid electrolyte electro-chemical and conductometric sensors are available for detection of NO2
[36–39]. Wide band gap semiconducting metal oxide (MO) based conductometric sensors are commonly used for this purpose, due to their simple functioning, low cost, mass production and easy integra-tion with integrated microelectronic circuits. Among these sensing materials, titania was investigated for developing NO2sensors [40].
UV- or Vis-light operating TiO2 sensors were also proposed for
im-proving the performance at room to low temperatures and in addition reducing the power consumption of the device [45]. However, the UV-or Vis-light operating TiO2 sensors for room temperature NO2
mon-itoring so far proposed, do not reach the sensitivity which is needed for environmental applications [41,42].
Owing to the importance of this issue, this paper focuses on the design and preparation of a multifunctional material, with gas sensing and catalytic activity, for the monitoring and abatement of NO2with
the aid of UV- or Vis-light. For this purpose TiO2and graphene/TiO2
hybrids were synthesized through a simple sol-gel method. As the morphology and microstructure play a fundamental role in both the PC and sensing properties, a detailed characterization has been under-taken. Field emission and conventional scanning electron microscopy (FESEM/SEM), helium ion microscopy (HIM), X-ray diffraction (XRD), BET surface area analysis, differential reflectance spectroscopy, Raman spectroscopy and energy dispersive X-ray analysis (EDX) were used to characterise the physical and chemical properties of both pure TiO2, the
hybrid graphene/TiO2 nanoparticles and commercially available
Degussa P25®TiO2 as a reference [43]. As the composition of
com-mercial Degussa P25®is reported to be inhomogeneous between dif-ferent batches [44], the very same batch was used for all the PC tests in the present work. Then, the PC and sensing properties of synthesized TiO2and Graphene/TiO2hybrids were investigated in detail and their
performance was correlated with their microstructural characteristics.
2. Experimental
2.1. TiO2synthesis
Preparation of TiO2 through the sol-gel method is based on the
hydrolysis and polymerization of a metal-organic precursor to form a colloidal suspension [45,46]. In the synthesis, 10 ml of tri-tetra-isopropoxide (TTIP) (Sigma Aldrich, ≥ 98%, MM = 284.22; d = 0.96 g/mL) was mixed with 40 mL of 2-propanol (Sigma Aldrich,≥ 99.7%, d = 0.785 g/mL) in a round bottomflask. The flask, which also acted as the reaction vessel, was positioned above a hotplate/magnetic stirrer within a fume cupboard. Aflat crystallizer dish containing the reaction vessel wasfilled with water thereby ensuring the flask was heated evenly at a temperature of 80 °C A separator funnel wasfilled with deionized water and adjusted to a pH of 2 using nitric acid mea-sured with an Omega PHB23 pH-meter mounted above the round bottom flask. In the synthesis of undoped TiO2, acidified deionised
water was added to the alcoholic solution with the titanium precursor. The acid provided the optimum pH for the hydrolysis reaction.
The 2-propanol and TTIP precursor were mixed under continuous vigorous stirring for 1 h at a temperature of 80 °C before the acidified water was introduced into the reaction vessel at a rate of 2 mL min−1to initiate the hydrolysis reaction. After continuous stirring for 6 h a white coloured colloidal liquid containing 5 g L–1TiO2was obtained through
the reaction described in Eq.(1):
Ti[OCH(CH3)2]4+ 2 H2O→ TiO2+ 4 (CH3)2CHOH (1)
After completion of the reaction all the excess solvent was removed immediately by evaporation through continuous stirring on a hotplate at 80 °C. The TiO2was initially amorphous and required annealing to
form the anatase crystalline phase that exhibits higher PC activity compared to amorphous or rutile TiO2[47,48]. Annealing was carried
out using an Elite BRF 14/10-2416 CG furnace with the material held in an alumina crucible of internal volume 20 ml. The annealing was achieved by ramping the temperature at a rate of 200 °C/h followed by a dwell at 450 °C, for 2.5 h before cooling.
2.2. Graphene/TiO2sample synthesis
Commercial graphene nanoplatelets, CamGraph®G1, kindly sup-plied by Cambridge Nanosystems, were used. These were manufactured using a surfactant-free microwave plasma synthesis process. According to the manufacturers analysis these consisted of 3 ± 2 layers and had a surface area of 320 ± 20 m2/g with a typical elemental analysis of
97.8% carbon, 0.68% hydrogen, 0.29% nitrogen and 0.99% oxygen. A Raman spectrum and XRD pattern of the graphene are presented in Fig. S1a and b (Supplementary Information File). Graphene/TiO2samples
were prepared following two different protocols.
In thefirst synthesis, graphene was added to the reaction vessel together with the TTIP, equating to 10 wt% of graphene. The mixture was then stirred at 80 °C for 2 h before initiating the hydrolysis reaction with acidified water. A grey colloidal solution was formed, with a pH of 1.8 – measured using an Omega PHB23 pH-meter. Following the completion of the reaction, the sample was recovered, by evaporation of the solvent in the hotplate, and annealed following the procedure described above in the Section 2.1: “TiO2 synthesis” – at 450 °C by
ramping at a rate of 200 °C/h and a 2.5 h dwell time at the selected temperature. This material is referred to asGTiO2S.
In the second procedure, TiO2was prepared following the synthesis
previously described in Section2.1“TiO2synhesis”. It was then placed
in a beaker, together with a mixture of ethanol and water (50% wt), and 10% wt of CamGraph graphene. This solution, was stirred at 70 °C for two hours, and then the solvent was removed by evaporation on the hotplate at 80 °C, to collect the powder. As the TiO2was annealed prior
to the graphene being added, the graphene was not subjected to any heat treatment. This material was namedGTiO2M.
2.3. Sample characterization
Analysis using X-ray diffraction (XRD) was carried out to evaluate the weight percentage of crystalline phases in the specimens prepared in addition to microstructural features. Semi-quantitative phase ana-lysis (QPA) of the XRD data was performed using the Rietveld method. Rietveld refinements were assessed using the GSAS-EXPGUI software packages [49,50]. XRD data were collected on a PANalytical X’Pert Pro (NL)θ/θ diffractometer, equipped with a fast real-time multiple strip (RTMS) detector (PIXcel 1D, PANalytical), using Cu Kαradiation (45 kV
and 40 mA) with a virtual step size of 0.02°2θ and virtual time per step of 200 s over a 20–80°2θ range. The instrumental broadening was measured using the NIST SRM 660b standard (LaB6) with data collected
under the same conditions as those used for the TiO2samples. XRD was
also used to determine microstructural features from the specimens. For this purpose, XRD data were collected in the same instrument with identical set-up as that used for QPA analysis. A higher signal-to-noise ratio was achieved in the range of 20–145°2θ, using a virtual step size of 0.1°, and a virtual time per step of 500 s. The instrumental contribution was obtained by parameterising the profile of fourteen (hkl) reflections from the NIST SRM 660b standard (LaB6), according to the Caglioti
et al. relationship [51]. Microstructural features of the specimens were analysed through the whole powder pattern modelling (WPPM) method [52], as implemented in the PM2K software package [53]. By means of this novel methodology, the size distribution of individual phases in NPs can be accurately defined [54]. In this work, crystalline domains were assumed to be spherical, and their diameter distributed according to a log-normal curve.
Raman spectra where acquired using a Renishaw System 2000 spectrometer equipped with an inVia Raman microscope using a He-Ne laser as an excitation source operating at 785 nm and a maximum power of 20 mW. The samples were analysed by focusing the laser with objective magnification ×100 onto the sample surface corresponding to a laser spot diameter of about 10μm. The acquisition time of 1 s was used for each spectrum over the wavenumber range 100–3500 cm−1
with a 4 cm–1resolution.
The morphology of the aggregates of TiO2and graphene/TiO2was
studied using a JEOL JSM-6480lv scanning electron microscope (SEM) with Oxford INCA Energy X-ray Analyser correlated using an accel-eration voltage of 20 keV. A higher magnification study of the particles using a helium ion microscope (HIM) was obtained using a Zeiss Orion NanoFab instrument. The images were acquired using He+ions with an
accelerating voltage of 25 kV and beam current of 0.3 pA with the angle varied between 0 and 54 deg. Images of higher magnification were obtained using a JEM-2100Plus Transmission Electron Microscope (TEM) using an acceleration voltage of 200 keV and a spot size of 1 nm. Diffuse reflectance spectroscopy (DRS) was performed with a Shimadzu UV 3100 (JP) spectrometer and spectra of the samples were acquired in the UV–Vis range (250–850 nm), with 0.2 nm step-size, and Spectralon®white reference material. The Kubelka-Munk theory, Eq. (2), was applied to allow conversion of the diffuse reflectance into the pseudo-absorption coefficient α, afterwards, the Tauc plot was used to estimate the electronic transition in the specimens prepared:
= − αhν A hν E ( ) γ ( ) g 1/ (2) where h is Planck's constant,ν is the photon frequency, α is the pseudo-absorption coefficient, Egis the band gap, and A is a proportionality
constant. The value of the power coefficient γ denotes the nature of the electronic transition, whether allowed or forbidden and whether direct or indirect: for direct allowed transitions:γ = 1/2, while for indirect allowed transitions,γ = 2 [55]. The specific surface area (SSA) of the prepared samples was determined using the Brunauer–Emmett–Teller (BET) method (Micromeritics Gemini 2380, US), using N2as the
ad-sorbate gas.
2.4. NOxphotocatalytic activity
Gas-solid phase PC study was carried out in a reactor operated continuously, as previously described in detail by Lucas et al. [56]. It comprised a cylindrical chamber (∼35 L in volume, 70 cm in height, 25 cm in diameter) constructed from a high grade stainless steel with a stainless steel top with a sealed glass window to allow the light to reach the sample that was placed inside. A schematic diagram is shown in Fig. 1, whilst a digital photograph of the working rig is in Fig. S2. The light source employed was a solar lamp (Osram Ultra-Vitalux, 300 W, 280 to 780 nm), placed 65 cm from the photocatalyst. The light in-tensity reaching the samples, measured with a radiometer (Delta OHM, HD2302.0, IT), was found to be approximately 3.6 W m−2in the UV-A range and 25 W m−2in the visible-light range. A Petri dish 6 cm in diameter wasfilled up with a layer of powder. The tests were performed at 27 ± 1 °C (temperature inside the reactor) with a relative humidity (RH) of 31%. These parameters were controlled by means of a ther-mocouple that was placed inside the chamber and a humidity sensor placed in the inlet pipe and they remained stable throughout the tests. The concentration of the pollutant gas exiting through the outlet was measured using a chemiluminescence analyser (AC-31 M, Environment S.A).
The experiment was conducted by firstly placing the petri dish containing the photocatalyst inside the reactor and covering the glass window with a sheet of aluminium. The inlet gas mixture (prepared mixing gas cylinders containing synthetic air and NOx) was allowed to
flow into the chamber until it stabilized at a concentration of 200 ppb. The mixture of air with that concentration of NOxwas guaranteed using Fig. 1. Scheme of the photocatalytic setup of NOxdegradation. MFC is massflow controller, NO A is the NO analyser and DL is the data logger.
two massflow controllers with a flow rate of 1 L min–1. The condition of continuousflow was necessary to achieve sample saturation, ensuring that, during the test, the PC process was the only one involved (i.e., no absorption from the sample, nor from the reactor walls) [57]. Once a concentration of 0.2 ppm was reached, the window glass was un-covered, the lamp turned on, and the PC reaction started. When the pollutant concentration stabilized to a minimum concentration the NOx
was no longer being decomposed by the catalyst. The PC efficiency was then expressed in terms of the conversion rate (%) of the initial NOx
concentration which was calculated using Eq.(3)[58]:
= − × NO conversion NO NO NO ( ) % ( ) ( ) ( ) 100 x x x t x 0 0 (3)
where (NOx)0and (NOx)tare the initial andfinal concentrations (both
expressed as ppb) after an irradiation time, t.
2.5. NO2sensing tests
NO2 sensing tests were carried out on conductometric platforms
fabricated using alumina substrates (3 × 6 mm), supplied with inter-digitated Pt electrodes and a heating element on the back side. Printable pastes of sensitive materials were obtained mixing TiO2based
samples with distilled water, then each paste was screen printed onto the interdigitated electrodes to obtain a thickfilm (∼ 10 μm) with a sensitive geometrical area of 3 × 3 mm. The high porosity of the alu-mina meant that no binder was necessary to enhance the adhesion of the sensing layer on the alumina substrate.
All measurements were performed at room temperature (RT) in a 10 ml volume test chamber equipped with a 400 nm UV–vis low power LED (180 mW) [59,60]. For the entire duration of the measurement, the sensor was exposed to a constant synthetic air total stream of 100 sccm (standard cubic centimeters per minute) with a RH of about 40%. The resistance of the sensors was monitored using a Keithley 6487 Pi-coammeter at an applied voltage of 1 V. The sensing tests under UV excitation were performed exposing the sensor to the target gas while the sensitivefilm was constantly irradiated with the UV light. The gas response was defined as the ratio S = R0/R, where R0represents the
electrical resistance of the sensor in air and R is the electrical resistance of the sensor at a given NO2concentration.
3. Results and discussion
3.1. Morphological characterization
SEM, HIM and TEM images were acquired to investigate the mor-phology of the synthesized powder.Fig. 2a shows a low magnification image of one of large aggregates observed on the pure TiO2sample. The
rough surface of TiO2aggregates, consisting of nanoparticles around
20 nm ± 5 nm, is clearly observed at high magnification (Fig. 2b). TEM analysis confirmed the nanometric size of TiO2particles and their
aggregation even at nanometer level (Fig. 2c and d).
Electron microscopy of theGTiO2S sample is reported inFig. 3. The
presence of graphene in the GTiO2S modified the nucleation and
growth of TiO2aggregates as shown inFig. 3a. The dimension of the
particles measured in post processing does not change significantly when compared with pure TiO2.Fig. 3c) shows how graphene sheets
behave as a nucleation point for the titania. Fig. 3d) focuses on the interface between the graphene sheet and the TiO2NPs.
Fig. 4a) and b) show the intricate network of TiO2and graphene in
the GTiO2M sample that was not observed in the GTiO2S sample.
Graphene and TiO2are deeply embedded together, and this modified
the shape and the roughness of the surface of this sample. TEM images were in agreement with those obtained by HIM:Fig. 4c) highlights the intricate network of graphene and TiO2produced through the mixing of
the two components in alcoholic solution.Fig. 4d) shows the interface between TiO2, where atomic lattice planes are visible, and graphene,
where atomic planes are visible. 3.2. Microstructural characterization
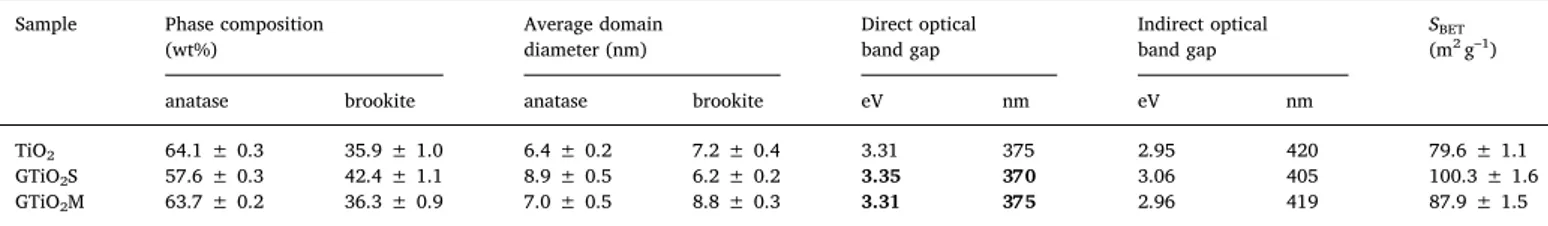
XRD patterns of the samples are reported inFig. 5, while an example of the Rietveld refinement is depicted in Fig. S3. The agreement factors of the Rietveld refinements are reported in Table S1 in addition to the semi-QPA analyses data. The main microstructural features of the specimens are listed inTable 1. In these analyses, only the crystalline TiO2 polymorphs were considered. The sol-gel synthesis of the
un-modified TiO2specimen led to the formation of anatase (64.1 wt%) and
brookite (35.9 wt%) TiO2polymorphs. This is in agreement with
pre-vious research as anatase is the thermodynamically stable TiO2
poly-morph at the nanoscale [61]. Furthermore, the presence of brookite is to be expected, as it is a common product of such sol–gel syntheses [62,63]. The specimenGTiO2M, quite obviously, had virtually the same
mineralogical composition as the unmodified TiO2, cfTable 1. On the
other hand, the specimen GTiO2S contained slightly less anatase,
57.6 wt%, in favour of a higher amount of brookite, i.e. 42.4 wt%. P25® is composed of 76.3 wt% anatase, 10.6 wt% rutile, and 13.0 wt% amorphous phase as showed by Tobaldi et al. [43].
Microstructural information in the form of the size, and size dis-tribution of anatase and brookite NPs in the specimens was determined using X-ray methods (cfTable 1). Quantitativefigures are reported in Table S2 and S3 andFig. 6. Anatase unit cell parameters ofTiO2and
GTiO2M are virtually the same, as shown in Table S2; the change in the
synthesis method (specimenGTiO2S), led to a slight expansion of the
anatase c-axis, although the unit cell volume is the same in all the three synthesised samples. As per the brookite unit cell parameters these are, once again, virtually the same – within the experimental error – in samplesTiO2andGTiO2M. Mixing graphene to the sol, led also in this
case to a slight expansion of brookite unit cell volume. Similar ob-servations can be made by considering the average diameter of the anatase crystalline domains in specimensTiO2andGTiO2M. They are
virtually the same, within experimental error, being 6.4 and 7.0 nm, respectively, see Table S3 andFig. 6. Similarly to observations for the unit cell parameters, GTiO2S had a bigger average diameter, being
8.9 nm.
There is no trend for the brookite in the specimens, the average diameter of the crystalline domains being 7.2, 8.8, and 6.2 nm for the TiO2,GTiO2M, and GTiO2S respectively. All the size distributions for
brookite had a positive skewness, as shown inFig. 6.
Raman spectra were obtained to determine the crystalline phase of TiO2and to allow a comparison with the commercial sample. Fig. S4a
shows the Raman spectrum of pure synthesised TiO2 showing the
presence of anatase and brookite TiO2 polymorphs, thus confirming
results from X-ray diffraction. The presence of anatase in crystalline form is indicated by the presence of its characteristic bands at 144, 197, 399, 519 and 639 cm–1; the main brookite Raman modes were detected at: 247, 323, 366 cm–1(cf Figure S4a). A Raman spectrum obtained from a sample of P25 is reported in Fig. S4b. Anatase, rutile and brookite Raman modes are listed in Table S4 [64]. Raman spectra of the hybrid samples containing graphene are reported inFig. 7. Both spectra indicate the same bands found in the pure synthesised sample attrib-uted to anatase and brookite. Furthermore, the major bands assigned to graphene (i.e. D and a weak D′ band, together with the G band) are present in the samples. The presence of these Raman features, e.g. D and D′ bands, is an indication of irregular edge disorders and oxidised dangling bonds [65,66]. Furthermore, as they are with essentially the same intensities, this shows that the defect state in graphene virtually didn’t vary between the two synthesis methods employed. Moreover, those defects might have acted as nucleation sites for TiO2[67].
DRS spectra (not shown) consisted of one single absorption edge, located at around 380 nm, and assigned to the band-to-band transition in titania [68]. The apparent optical Egof the specimens were
indirect allowed transitions – values listed inTable 1. The Egvalues
obtained, assuming a direct allowed transition (cf Fig. 8), agree well with the expected Egof anatase (i.e.∼3.2 eV; ∼388 nm) reported in the
literature [47], thus the direct allowed model would seem more ap-plicable for these specimens. However, the Egvalues extracted with the
Tauc formalism are shifted toward higher energies compared with the expected Egvalue of anatase. This might be a contribution from the
non-negligible amounts of brookite in all the specimens. Indeed, the optical band gap of brookite has been reported to be ∼3.4 eV (∼365 nm) [69], probably explaining the higher blue-shift of the spe-cimen GTiO2S, which is the spespe-cimen with the higher amount of brookite (cfTable 1).Furthermore, although anatase is commonly re-ported to be a semiconductor having an indirect allowed transition
[70], it has been shown by Serpone and co-workers that, for indirect band gap semiconductors such as anatase, a direct transition might appear, when in a colloidal nanomaterial form [71]. Besides, the pre-sence of graphene did not significantly change the apparent optical Eg,
as shown inTable 1.
With regard to the structural properties, an increase in the BET specific surface area of the samples was noted, being 79.6, 87.9, and 100.3 m2g−1 for theTiO
2, GTiO2M, and GTiO2S respectively as
re-ported inTable 1. The sorption isotherms are shown in Fig. S5a–c. They all are of type IV, typical of a mesoporous material. Furthermore, we detected the presence of no micropores (all the pore being in the range of∼2-25 nm, inset of Fig. S5a–c). The main microstructural and optical characteristics of the as prepared samples, which are of primary
Fig. 2. a) HIM image of TiO2aggregate, b) HIM image close up of the rough surface of TiO2; c) TEM image of TiO2nanoparticle aggregate in TiO2pure; d) high magnification TEM picture of the surface of a small aggregate TiO2pure particle.
Fig. 3. HIM of GTiO2S: a) surface; b) close up of the rough surface. c) TEM image of a TiO2nanoparticle aggregate anchored to graphene sheets decorated with GTiO2S. d) high magnification TEM picture of the interface of atomic planes of TiO2/Graphene inGTiO2S particle.
importance in determining their sensing and PC performances, have also been summarised inTable 1.
3.3. NO2sensing tests
TiO2is a widely used gas sensor material which can be activated
under light. However, so far, only very few TiO2based photo-activated
sensors have been studied. Furthermore, the range of concentrations investigated is higher than that required for environmental control. Here, the sensing characteristics of the fabricated conductometric sen-sors have been tested for NO2at room temperature in the concentration
Fig. 4. SEM images of GTiO2M showing a) graphene sheets; b) mixture of graphene and TiO2. TEM images showing c) graphene sheets decorated with TiO2 nanoparticles; d) high magnification of the interface of atomic planes of TiO2[A box] and graphene planes [B box].
Fig. 5. XRD patterns, from top to bottom, of GTiO2S, GTiO2M and TiO2. Miller indices in black belong to anatase reflections; that in red belongs to brookite.
Table 1
Main microstructural and optical characteristics of the as prepared samples.
Sample Phase composition (wt%) Average domain diameter (nm) Direct optical band gap Indirect optical band gap SBET (m2g–1)
anatase brookite anatase brookite eV nm eV nm
TiO2 64.1 ± 0.3 35.9 ± 1.0 6.4 ± 0.2 7.2 ± 0.4 3.31 375 2.95 420 79.6 ± 1.1
GTiO2S 57.6 ± 0.3 42.4 ± 1.1 8.9 ± 0.5 6.2 ± 0.2 3.35 370 3.06 405 100.3 ± 1.6
GTiO2M 63.7 ± 0.2 36.3 ± 0.9 7.0 ± 0.5 8.8 ± 0.3 3.31 375 2.96 419 87.9 ± 1.5
Fig. 6. Crystalline domain size distribution for a) anatase and b) brookite, in the synthesised specimens.
range from 70 ppb to 1750 ppb. Notably, to reduce the size and the power consumption of the photo-activated sensors, a low-power light emitting diode (LED) lamp (180 mW) was used. LEDs are promising for gas sensing applications because of their reduced size, instant on/off operation, long lifetime, low environmentally impact and ability to produce accurate wavelengths at specific intensities.
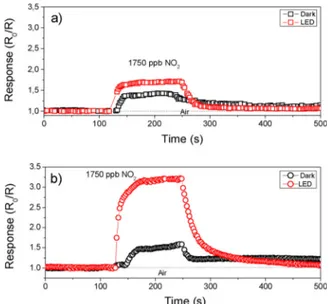
Preliminary tests, carried out to investigate the effect of the UV–vis excitation on the behaviour of the pureTiO2andGTiO2S sensors
to-ward NO2(1750 ppb), are shown inFig. 9. In the dark, almost no
dif-ference in the sensor response is noted. Looking at the sensor response under UV–vis excitation with a 400 nm LED, no appreciable variation occurs for the unmodified TiO2 sensor, whereas the GTiO2S sensor
shows a two-fold increase in response. It worth noting that, under UV–vis excitation a quick and reversible recovery of the baseline was observed for both sensors.
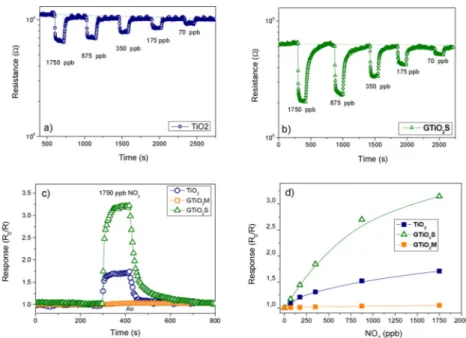
The positive response of the synthesized TiO2and graphene/TiO2
hybrids under UV excitation for different concentrations of NO2and the
related calibration curves, are reported inFig. 10. To make the com-parison clearer, both the data sets have been plotted on the same scale. Both TiO2 and GTiO2S based sensors showed changes in resistance
when exposed to NO2in the range 70–1750 ppb. On the contrary, the
GTiO2M based sensor was almost insensitive to NO2in the same range
of concentration. This may be due to the high conductivity of the sample, through the well-interconnected graphene sheets which pro-mote electronic transport. A decrease in the resistance has been clearly observed after the introduction of NO2(Fig. 10a and b). As NO2is an
oxidizing gas, this suggests that the tested materials behave as p-type semiconductors. Such behaviour can be explained assuming that NO2
adsorption on the titania active layers involves the transfer of electrons toward the titania sensing layer, decreasing the resistance of the sensor device.
Fig. 10c compares the response under UV excitation to 1750 ppb of NO2of the synthesized TiO2and graphene/TiO2hybrid-based sensors.
The results, summarised inFig. 10d at different concentrations indicate that theGTiO2S sensor was the most responsive, in agreement with
previous behaviour of TiO2-based sensors reported in the literature
[41,72]. The calibration curve for theGTiO2S sensor reported in log-log
scale (seeFig. 11) has a good linear relationship (R2= 0.984) according Fig. 7. Raman spectra of GTiO2M and GTiO2S. Inset shows the magnified wavenumber region 1200–1850 cm–1to highlight the major graphene bands, D (∼1350 cm–1),D′ (around 1620 cm–1), andG (1580 cm–1).
Fig. 8. Kubelka–Munk analysis of the DRS data versus photon energy of the specimens to show the optical Eg, calculated using the Tauc procedure. In the inset, the dotted lines represent the x-axis intercept of the line tangent to the inflection point of the sample, i.e. the optical Egaccording to the direct allowed Egmodel– (αhν)2,γ = ½.
Fig. 9. Effect of the UV–vis excitation on the response behaviour of the a) unmodified TiO2and b)GTiO2S sensor toward NO2(1750 ppb) at 40% RH.
to Eq.(4):
= ∙ −
logS 0.33logc 0. 54 (4)
where S is the response (R0/R) and c the concentration of NO2. The
limit of detection (LOD) estimated at a signal to noise ratio of 3, was found to be about 50 ppb of NO2.
The gas sensing performances of theGTiO2S sensor are compared in
Table 2 with previously reported TiO2-based NO2sensors. It is
note-worthy that almost all TiO2sensors work at high temperature and only
in the ppm range of concentration. In comparison the proposed GTiO2S sensor tested in this work possesses a lower operating range of con-centration up to ppb level, functioning at room temperature, with a comparable or superior response to the other TiO2-based formulations with a relatively short response/recovery time.
The data reported above can help to propose a plausible mechanism for the enhanced response in the presence of UV–vis light. It is well known that light irradiation of the sensing layer affects gas detection in metal oxide semiconductors, enhancing the carrier generation. In ad-dition, it is also responsible for the photo-dissociation of the target gas [59]. The results obtained, indicated that the resistance of TiO2
de-creased upon exposure to NO2and decreased further with LED
excita-tion, increasing the response. This occurs through the combination of processes reported below, starting with the photo-generation of elec-tron-hole pairs (Eq. 5). The photo-generated holes react with adsorbed
oxygen ions, forming O2(gas) which leaves the sensing surface (Eq. 6).
Adsorption of NO2target gas is then enhanced on the clean and more
reactive surface. Removal of oxygen contamination from the illumi-nated surface results in a greater formation of reactive sites for NO2
adsorption. The photo-induced adsorption of NO2has been suggested to
be the key pathway for higher response [79,80]. Adsorbed NO2extracts
electrons from the conduction band (Eq.(7)), increasing the number of holes in p-type TiO2and consequently decreasing the resistance.
TiO2/graphene + hυ → h++ e– (5)
O2–(ads) + h+→ O2(gas) (6)
NO2(gas) + e−→ NO2−(ads) (7)
In summary, due to the increased availability of NO2 molecules
adsorbed, the resistance change upon exposure to NO2under
photo-excitation was higher than in the dark. The substantial enhancement in the response of theGTiO2S sensor to NO2gas under the LED excitation
compared to the other samples was attributed to its higher surface area (smaller particle size).
3.4. Photo-catalytic NOxdegradation tests
Results of NOxPC degradation using the solar lamp are shown in
Fig. 12. All the specimens exhibited PC activity when triggered with a lamp simulating solar radiation. Graphene modified TiO2specimens
were the most active amongst the whole series of samples, withGTiO2S
being more active than GTiO2M. On the other hand, P25® is more
photocatalytically active than our unmodified TiO2sample.
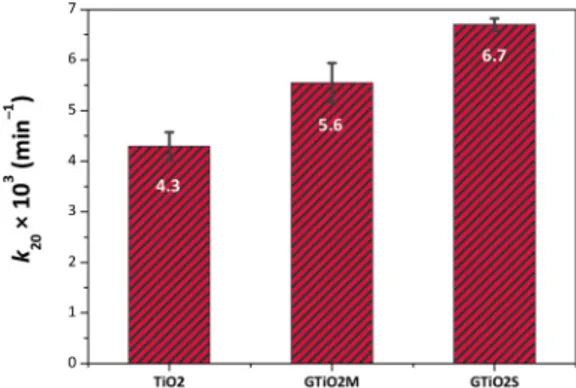
These results are well confirmed by the initial (first 20 min of re-action) pseudo-first order kinetic constants, cfFig. 13, in which are reported the values averaged over three consecutive PC activity tests (using the same specimen as in thefirst PC run) with the respective standard deviation. These data are supported by the literature which states that graphene is a high performance support for photocatalysis [81]. Thus, because electronic transport is enhanced in the graphene/ TiO2hybrids, as shown in Section3.3, a decrease in the resistance of
GTiO2S, improves PC activity. The photo-generated electrons, from the
TiO2 component, are swiftly delivered to the surrounding graphene
sheets in a composite process [82]. Such electrons are involved in re-ductive reactions, i.e. the formation of active O2− species with the Fig. 10. Resistance variation under UV excitation for: a) the unmodified TiO2and b)GTiO2S at different concentration of NO2. c) Comparison of the response of the synthesized TiO2and TiO2/graphene/ hybrids; d) Calibration curves.
oxygen from the environment, as in Eq. (8)[83]. Furthermore, and most importantly for PC purposes, the removal of these electrons from TiO2to graphene, allows for a boost in the separation of the
photo-generated pair [84]. Moreover, the incorporation of TiO2on a graphene
substrate is able, at the same time, to increase the adsorption of pol-lutants [85], all these factors being beneficial for PC activity.
However, data also show that there is a clear difference in the in-teraction amongst TiO2NPs and graphene, depending on the
prepara-tion method. Consistent with the sensing experiments,GTiO2S behaves
itself as the best performing sample in the PC tests despite the thermal treatment that was necessary after the preparation of the specimen. Indeed, such a thermal treatment might be beneficial in synthesising TiO2and graphene in more intimate contact (cfFig. 3d); furthermore,
the introduction of graphene directly into the sol was beneficial in producing NPs with a higher SSA, as shown inTable 1. Also, as shown by Trapalis and co-workers [84], the photocatalytic de-NOx
perfor-mance of graphene-TiO2composites reaches a maximum efficiency at
low graphene loadings. This was attributed by those authors to the interaction between TiO2nanoparticles and graphene sheets, acting as
electron traps.
Plotting the degradation of NO and NO2 versus reaction time of
GTiO2S,Fig. 14, the concentration of NO2, after having turned the lamp
on, is virtually stable, whilst NO concentration is degraded. Conse-quently, Eqs.(5,8–10)may be involved in the oxidative reaction pro-cesses [86]:
eCB–+ O2(ads)→%O2–(ads) (8)
NO +%O2–(ads)→ NO3– (9)
NO3–+ H+→ HNO3 (10)
This observation is consistent with previous literature where Dong and colleagues (via electron spin resonance) have shown that super-oxide radicals (%O2−) are the main active reactive oxygen species
re-sponsible for the PC degradation of NOx[87], thus we can state that NO
was mainly oxidised by oxygen radicals. Finally, it is well known that HNO3is thefinal product of the NOxdegradation. However, as shown
ZnO–TiO2 2–20 ΔR/Rair
4–57
Cr-TiO2nanotubular 500 10–100 Rair/RNO2
3.2–12.2
180/360 [77]
TiO2thinfilm RT/UV 100–500 ΔR/Rair%
1.3–2.2
100/210 [41]
TiO2nanowires RT 10–100 Rair/RNO2
2.4–3.1
10/19 [78]
TiO2/graphene RT/UV 0.07–1.75 RNO2/RAir
1.17–3.14
35/90 This work
Fig. 12. NOxdegradation graph of all the samples irradiated with OSRAM solar lamp. The initial negative time zone indicates a period of stabilization of the chamber; positive time indicates that the light has been turned on starting the experiment.
Fig. 13. Histograms showing the initial (first 20 min of reaction) pseudo-first order kinetic constants, k’app. Reported values are averaged over three con-secutive photocatalytic activity tests.
Fig. 14. Concentration of NO and NO2 versus irradiation time, specimen GTiO2S.
by Ohko and colleagues, this can be easily eluted from the catalyst into water [88].
4. Conclusions
A sol gel synthesis has been used to synthesize graphene/TiO2
na-noparticles. Addition of graphene to the reaction vessel prior to in-itiating the sol gel reaction, followed by annealing, led to an intimately mixed composite (GTiO2S). An alternative manufacturing method
in-volving the addition of graphene to TiO2nanoparticles which had
al-ready been annealed resulted in a material with lower performance (GTiO2M). XRD and Raman data were complementary in describing the
different structures observed. The as-prepared samples were evaluated as sensing materials for monitoring NO2at low concentrations in air.
Under UV–vis photo-excitation, the GTiO2S sensor was the most
re-sponsive. The significant improvement in sensitivity at room tempera-ture under the UV–vis excitation was attributed to higher surface area (smaller particle size) compared to the other samples. The physical mechanisms, i.e. the photo-generation of free charge carriers and the resulting reactions between semiconductor surface and oxygen and NO2
are likely under LED excitation. Interestingly, the PC properties which result in the abatement of NOx follow the same trend seen in NOx
sensing, withGTiO2S being the most active material when compared to
bothGTiO2M and TiO2pure, making it the most suitable for
multi-purpose environmental applications. Conflict of interest
No conflicts of interest. Acknowledgments
This project has received funding from the European Union’s Seventh Framework Programme for research, technological develop-ment and demonstration under grant agreedevelop-ment No. 609234. The au-thors wish to acknowledge Cambridge Nanosystems for supplying the graphene. Andrea Giampiccolo wishes to thank the BRE for funding his research studentship. This work was developed within the scope of the project CICECO–Aveiro Institute of Materials, POCI-01-0145-FEDER-007679 (FCT Ref. UID/CTM/50011/2013),financed by national funds through the FCT/MEC and when appropriate co-financed by FEDER under the PT2020 Partnership Agreement. The Zeiss Orion NanoFab HIM was purchased as part of a package funded by EPSRC’s “Great Eight” capital funding Grant No. EP/K022679/1 and Newcastle University. The HIM is housed at the National EPSRC XPS Users’ Service, an EPSRC Mid-Range Facility. All data supporting this study are provided as supplementary information accompanying this paper. Appendix A. Supplementary data
Supplementary material related to this article can be found, in the online version, at doi:https://doi.org/10.1016/j.apcatb.2018.10.032. References
[1] A. Fujishima, K. Honda, Electrochemical photolysis of water at a semiconductor electrode, Nature 238 (1972) 37–38,https://doi.org/10.1038/238037a0. [2] C.H. Ao, S.C. Lee, Indoor air purification by photocatalyst TiO2immobilized on an
activated carbonfilter installed in an air cleaner, Chem. Eng. Sci. 60 (2005) 103–109,https://doi.org/10.1016/j.ces.2004.01.073.
[3] Y. Paz, Application of TiO2photocatalysis for air treatment: patents’ overview,
Appl. Catal. B Environ. 99 (2010) 448–460,https://doi.org/10.1016/j.apcatb. 2010.05.011.
[4] M. Hussain, N. Russo, G. Saracco, Photocatalytic abatement of VOCs by novel op-timized TiO2nanoparticles, Chem. Eng. J. 166 (2011) 138–149,https://doi.org/10.
1016/j.cej.2010.10.040.
[5] S. MiarAlipour, D. Friedmann, J. Scott, R. Amal, TiO2/porous adsorbents: recent
advances and novel applications, J. Hazard. Mater. 341 (2018) 404–423,https:// doi.org/10.1016/j.jhazmat.2017.07.070.
[6] M. Landmann, E. Rauls, W.G. Schmidt, The electronic structure and optical response of rutile, anatase and brookite TiO2, J. Phys. Condens. Matter 24 (2012) 195503, ,
https://doi.org/10.1088/0953-8984/24/19/195503.
[7] B.L. Diffey, Sources and measurement of ultraviolet radiation, Methods 28 (2002) 4–13,https://doi.org/10.1016/S1046-2023(02)00204-9.
[8] W.-J. Yin, S. Chen, J.-H. Yang, X.-G. Gong, Y. Yan, S.-H. Wei, Effective band gap narrowing of anatase TiO2by strain along a soft crystal direction, Appl. Phys. Lett.
96 (2010),https://doi.org/10.1063/1.3430005221901.
[9] R. Long, N.J. English, Band gap engineering of double- cation -impurity-doped anatase-titania for visible-light photocatalysts: a hybrid density functional theory approach, Phys. Chem. Chem. Phys. 13 (2011) 13698–13703,https://doi.org/10. 1039/C1CP21454C.
[10] S.G. Kumar, L.G. Devi, Review on modified TiO2photocatalysis under UV/Visible
light: selected results and related mechanisms on interfacial charge carrier transfer dynamics, J. Phys. Chem. A 115 (2011) 13211–13241,https://doi.org/10.1021/ jp204364a.
[11] J. Godnjavec, J. Zabret, B. Znoj, S. Skale, N. Veronovski, P. Venturini, Investigation of surface modification of rutile TiO2nanoparticles with SiO2/Al2O3on the
prop-erties of polyacrylic composite coating, Prog. Org. Coat. 77 (2014) 47–52,https:// doi.org/10.1016/j.porgcoat.2013.08.001.
[12] S. Ke, X. Cheng, Q. Wang, Y. Wang, Z. Pan, Preparation of a photocatalytic TiO2/
ZnTiO3coating on glazed ceramic tiles, Ceram. Int. 40 (2014) 8891–8895,https://
doi.org/10.1016/j.ceramint.2014.01.027.
[13] R. Phienluphon, K. Pinkaew, G. Yang, J. Li, Q. Wei, Y. Yoneyama, T. Vitidsant, N. Tsubaki, Designing core (Cu/ZnO/Al2O3)–shell (SAPO-11) zeolite capsule
cata-lyst with a facile physical way for dimethyl ether direct synthesis from syngas, Chem. Eng. J. 270 (2015) 605–611,https://doi.org/10.1016/j.cej.2015.02.071. [14] Z. Li, Y. Hou, B. Ma, X. Wu, Z. Xing, K. Li, Super-hydrophilic porous TiO2-ZnO composite thinfilms without light irradiation, Environ. Prog. Sustain. Energy 35 (2016) 1121–1124,https://doi.org/10.1002/ep.12308.
[15] Y. Yao, G. Li, S. Ciston, R.M. Lueptow, K.A. Gray, Photoreactive TiO2/carbon
na-notube composites: synthesis and reactivity, Environ. Sci. Technol. 42 (2008) 4952–4957,https://doi.org/10.1021/es800191n.
[16] Y.-J. Xu, Y. Zhuang, X. Fu, New insight for enhanced photocatalytic activity of TiO2
by doping carbon nanotubes: a case study on degradation of benzene and methyl orange, J. Phys. Chem. C 114 (2010) 2669–2676,https://doi.org/10.1021/ jp909855p.
[17] Y. Liang, H. Wang, H. Sanchez Casalongue, Z. Chen, H. Dai, TiO2nanocrystals
grown on graphene as advanced photocatalytic hybrid materials, Nano Res. 3 (2010) 701–705,https://doi.org/10.1007/s12274-010-0033-5.
[18] Y. Zhang, Z.-R. Tang, X. Fu, Y.-J. Xu, TiO2−graphene nanocomposites for gas-phase
photocatalytic degradation of volatile aromatic pollutant: is TiO2−graphene truly
different from other TiO2−carbon composite materials? ACS Nano 4 (2010)
7303–7314,https://doi.org/10.1021/nn1024219.
[19] J. Liu, H. Bai, Y. Wang, Z. Liu, X. Zhang, D.D. Sun, Self-assembling TiO2nanorods
on large graphene oxide sheets at a two-phase interface and their anti-recombina-tion in photocatalytic applicaanti-recombina-tions, Adv. Funct. Mater. 20 (2010) 4175–4181, https://doi.org/10.1002/adfm.201001391.
[20] K. Zhou, Y. Zhu, X. Yang, X. Jiang, C. Li, Preparation of graphene–TiO2composites
with enhanced photocatalytic activity, New J. Chem. 35 (2011) 353–359,https:// doi.org/10.1039/C0NJ00623H.
[21] J. Auvinen, L. Wirtanen, The influence of photocatalytic interior paints on indoor air quality, Atmos. Environ. 42 (2008) 4101–4112,https://doi.org/10.1016/j. atmosenv.2008.01.031.
[22] M. Nuño, R.J. Ball, C.R. Bowen, Study of solid/gas phase photocatalytic reactions by electron ionization mass spectrometry: study of photoreactions by mass spec-trometry, J. Mass Spectrom. 49 (2014) 716–726,https://doi.org/10.1002/jms. 3396.
[23] M. Nuño, R.J. Ball, C.R. Bowen, R. Kurchania, G.D. Sharma, Photocatalytic activity of electrophoretically deposited (EPD) TiO2coatings, J. Mater. Sci. 50 (2015)
4822–4835,https://doi.org/10.1007/s10853-015-9022-0.
[24] M. Nuño, G.L. Pesce, C.R. Bowen, P. Xenophontos, R.J. Ball, Environmental per-formance of nano-structured Ca(OH)2/TiO2photocatalytic coatings for buildings,
Build. Environ. 92 (2015) 734–742,https://doi.org/10.1016/j.buildenv.2015.05. 028.
[25] P. Wolkoff, G.D. Nielsen, Organic compounds in indoor air—their relevance for perceived indoor air quality? Atmos. Environ. 35 (2001) 4407–4417,https://doi. org/10.1016/S1352-2310(01)00244-8.
[26] D. Won, R.L. Corsi, M. Rynes, Sorptive interactions between VOCs and indoor materials, Indoor Air 11 (2001) 246–256,https://doi.org/10.1034/j.1600-0668. 2001.110406.x.
[27] D. Maskell, C.F. da Silva, K. Mower, R. Cheta, A. Dengel, R. Ball, M. Ansell, P. Walker, A. Shea, Properties of Bio-based Insulation Materials and Their Potential Impact on Indoor Air Quality, (2015) (Accessed 1 October 2018),https:// researchportal.bath.ac.uk/en/publications/properties-of-bio-based-insulation-materials-and-their-potential.
[28] C.F. da Silva, D. Maskell, R. Ball, M. Ansell, The Physical, Chemical and Mechanical Properties of Eco-materials for Passive Indoor Environmental Control, (2014) (Accessed 1 October 2018), https://researchportal.bath.ac.uk/en/publications/the-physical-chemical-and-mechanical-properties-of-eco-materials-.
[29] C.F. da Silva, C. Rana, D. Maskell, A. Dengel, M.P. Ansell, R.J. Ball, Influence of eco-materials on indoor air quality, Int. J. Green Nanotechnol. Mater. Sci. Eng. 4 (2016),https://doi.org/10.1680/jgrma.16.00002.
[30] C.A. Redlich, J. Sparer, M.R. Cullen, Sick-building syndrome, Lancet 349 (1997) 1013–1016,https://doi.org/10.1016/S0140-6736(96)07220-0.
airnow/index.cfm?action=pubs.aqiguidenox.
[36] Y. Shimizu, D. Koba, H. Saitoh, S. Takase, A NOxsensor using solid electrolyte
impedance transducer and perovskite-type oxide receptor, ECS Trans. 1 (2006) 131–140,https://doi.org/10.1149/1.2215549.
[37] V.V. Plashnitsa, T. Ueda, P. Elumalai, N. Miura, NO2sensing performances of planar
sensor using stabilized zirconia and thin-NiO sensing electrode, Sens. Actuators B Chem. 130 (2008) 231–239,https://doi.org/10.1016/j.snb.2007.07.127. [38] N. Masson, R. Piedrahita, M. Hannigan, Approach for quantification of metal oxide
type semiconductor gas sensors used for ambient air quality monitoring, Sens. Actuators B Chem. 208 (2015) 339–345,https://doi.org/10.1016/j.snb.2014.11. 032.
[39] R. Baron, J. Saffell, Amperometric gas sensors as a low cost emerging technology platform for air quality monitoring applications: a review, ACS Sens. 2 (2017) 1553–1566,https://doi.org/10.1021/acssensors.7b00620.
[40] Y. Gönüllü, G.C.M. Rodríguez, B. Saruhan, M. Ürgen, Improvement of gas sensing performance of TiO2towards NO2by nano-tubular structuring, Sens. Actuators B
Chem. 169 (2012) 151–160,https://doi.org/10.1016/j.snb.2012.04.050. [41] T. Xie, N. Sullivan, K. Steffens, B. Wen, G. Liu, R. Debnath, A. Davydov, R. Gomez,
A. Motayed, UV-assisted room-temperature chemiresistive NO2sensor based on
TiO2thinfilm, J. Alloys. Compd. 653 (2015) 255–259,https://doi.org/10.1016/j.
jallcom.2015.09.021.
[42] I. Karaduman, D.E. Yıldız, M.M. Sincar, S. Acar, UV light activated gas sensor for NO2detection, Mater. Sci. Semicond. Process. 28 (2014) 43–47,https://doi.org/10.
1016/j.mssp.2014.04.011.
[43] D.M. Tobaldi, R.C. Pullar, M.P. Seabra, J.A. Labrincha, Fully quantitative X-ray characterisation of evonik aeroxide TiO2P25®, Mater. Lett. 122 (2014) 345–347,
https://doi.org/10.1016/j.matlet.2014.02.055.
[44] B. Ohtani, O.O. Prieto-Mahaney, D. Li, R. Abe, What is Degussa (Evonik) P25? Crystalline composition analysis, reconstruction from isolated pure particles and photocatalytic activity test, J. Photochem. Photobiol. Chem. 216 (2010) 179–182, https://doi.org/10.1016/j.jphotochem.2010.07.024.
[45] A. Giampiccolo, R. Ball, M. Ansell, D. Maskell, Synthesis of Co-doped TiO2
Nanostructures for Novel Photo-catalytic Coatings, (2014) (Accessed 1 October 2018), https://researchportal.bath.ac.uk/en/publications/synthesis-of-co-doped-tio2-nanostructures-for-novel-photo-catalyt.
[46] B. O’Regan, M. Grätzel, A low-cost, high-efficiency solar cell based on dye-sensi-tized colloidal TiO2films, Nature 353 (1991) 737–740,https://doi.org/10.1038/ 353737a0.
[47] T. Luttrell, S. Halpegamage, J. Tao, A. Kramer, E. Sutter, M. Batzill, Why is anatase a better photocatalyst than rutile?– Model studies on epitaxial TiO2 films, Sci. Rep. 4 (2014) 4043,https://doi.org/10.1038/srep04043.
[48] G. Odling, N. Robertson, Why is anatase a better photocatalyst than rutile? The importance of free hydroxyl radicals, ChemSusChem 8 (2015) 1838–1840,https:// doi.org/10.1002/cssc.201500298.
[49] A.C. Larson, R.B. Von Dreele, General Structure Analysis System (GSAS), Los Alamos National Laboratory Report LAUR, 2004.
[50] B.H. Toby, EXPGUI, a graphical user interface for GSAS, J. Appl. Crystallogr. 34 (2001) 210–213,https://doi.org/10.1107/S0021889801002242.
[51] G. Caglioti, A. Paoletti, F.P. Ricci, On resolution and luminosity of a neutron dif-fraction spectrometer for single crystal analysis, Nucl. Instrum. Methods. 9 (1960) 195–198,https://doi.org/10.1016/0029-554X(60)90101-4.
[52] P. Scardi, M. Ortolani, M. Leoni, WPPM: microstructural analysis beyond the riet-veld method, Mater. Sci. Forum. 651 (2010) 155–171,https://doi.org/10.4028/ www.scientific.net/MSF.651.155.
[53] M. Leoni, T. Confente, P. Scardi, PM2K: aflexible program implementing Whole Powder Pattern Modelling, Z. Für Krist. (Suppl. 23) (2006) 249–254,https://doi. org/10.1524/zksu.2006.suppl_23.249.
[54] P. Scardi, M. Leoni, Whole Powder Pattern Modelling: Theory and Applications, in: Diffraction Analysis of the Microstructure of Materials, Springer-Verlag, Eric J. Mittemeijer, Paolo Scardi, Berlin, 2004, pp. 51–92.
[55] A. Dolgonos, T.O. Mason, K.R. Poeppelmeier, Direct optical band gap measurement in polycrystalline semiconductors: a critical look at the Tauc method, J. Solid State Chem. 240 (2016) 43–48,https://doi.org/10.1016/j.jssc.2016.05.010.
[56] S.S. Lucas, V.M. Ferreira, J.L.B. de Aguiar, Incorporation of titanium dioxide na-noparticles in mortars— influence of microstructure in the hardened state prop-erties and photocatalytic activity, Cem. Concr. Res. 43 (2013) 112–120,https://doi. org/10.1016/j.cemconres.2012.09.007.
[57] U.I. Gaya, A.H. Abdullah, Heterogeneous photocatalytic degradation of organic contaminants over titanium dioxide: a review of fundamentals, progress and pro-blems, J. Photochem. Photobiol. C Photochem. Rev. 9 (2008) 1–12,https://doi.org/ 10.1016/j.jphotochemrev.2007.12.003.
[58] F.L. Toma, G. Bertrand, D. Klein, C. Coddet, Photocatalytic removal of nitrogen
tase from amorphous titania with particle sizes tailored by temperature, Nano Lett. 1 (2001) 81–85,https://doi.org/10.1021/nl0055198.
[63] S.L. Isley, R.L. Penn, Relative brookite and anatase content in sol−Gel-Synthesized titanium dioxide nanoparticles, J. Phys. Chem. B 110 (2006) 15134–15139,https:// doi.org/10.1021/jp061417f.
[64] D.M. Tobaldi, R.C. Pullar, R. Binions, A. Belen Jorge, P.F. McMillan, M. Saeli, M.P. Seabra, J.A. Labrincha, Influence of sol counter-ions on the visible light in-duced photocatalytic behaviour of TiO2 nanoparticles, Catal. Sci. Technol. 4 (2014) 2134,https://doi.org/10.1039/c4cy00423j.
[65] A.C. Ferrari, J.C. Meyer, V. Scardaci, C. Casiraghi, M. Lazzeri, F. Mauri, S. Piscanec, D. Jiang, K.S. Novoselov, S. Roth, A.K. Geim, Raman Spectrum of graphene and graphene layers, Phys. Rev. Lett. 97 (2006) 187401, ,https://doi.org/10.1103/ PhysRevLett.97.187401.
[66] A.K. Gupta, T.J. Russin, H.R. Gutiérrez, P.C. Eklund, Probing graphene edges via raman scattering, ACS Nano 3 (2009) 45–52,https://doi.org/10.1021/nn8003636. [67] F. Sordello, G. Zeb, K. Hu, P. Calza, C. Minero, T. Szkopek, M. Cerruti, Tuning TiO2
nanoparticle morphology in graphene–TiO2hybrids by graphene surface
mod-ification, Nanoscale 6 (2014) 6710–6719,https://doi.org/10.1039/C4NR01322K. [68] A.S. Marfunin, Physics of Minerals and Inorganic Materials: An Introduction,
Springer-Verlag, Berlin Heidelberg, 1979 (Accessed October 1, 2018),www. springer.com/gp/book/9783642670466.
[69] M. Koelsch, S. Cassaignon, J. Guillemoles, J. Jolivet, Comparison of optical and electrochemical properties of anatase and brookite TiO2synthesized by the sol–gel
method, Thin Solid Films 403–404 (2002) 312–319,https://doi.org/10.1016/ S0040-6090(01)01509-7.
[70] D.M. Tobaldi, R.C. Pullar, L. Durães, T. Matias, M.P. Seabra, J.A. Labrincha, Truncated tetragonal bipyramidal anatase nanocrystals formed without use of capping agents from the supercritical drying of a TiO2sol, CrystEngComm 18
(2016) 164–176,https://doi.org/10.1039/C5CE02112J.
[71] N. Serpone, D. Lawless, R. Khairutdinov, Size effects on the photophysical prop-erties of colloidal anatase TiO2particles: size quantization versus direct transitions
in this indirect semiconductor? J. Phys. Chem. 99 (1995) 16646–16654,https:// doi.org/10.1021/j100045a026.
[72] T. Xie, A. Rani, B. Wen, A. Castillo, B. Thomson, R. Debnath, T.E. Murphy, R.D. Gomez, A. Motayed, The effects of surface conditions of TiO2thinfilm on the
UV assisted sensing response at room temperature, Thin Solid Films 620 (2016) 76–81,https://doi.org/10.1016/j.tsf.2016.07.075.
[73] J. Esmaeilzadeh, E. Marzbanrad, C. Zamani, B. Raissi, Fabrication of undoped-TiO2
nanostructure-based NO2high temperature gas sensor using low frequency AC
electrophoretic deposition method, Sens. Actuators B Chem. 161 (2012) 401–405, https://doi.org/10.1016/j.snb.2011.10.051.
[74] M.G. Manera, A. Taurino, M. Catalano, R. Rella, A.P. Caricato, R. Buonsanti, P.D. Cozzoli, M. Martino, Enhancement of the optically activated NO2gas sensing
response of brookite TiO2nanorods/nanoparticles thinfilms deposited by
matrix-assisted pulsed-laser evaporation, Sens. Actuators B Chem. 161 (2012) 869–879, https://doi.org/10.1016/j.snb.2011.11.051.
[75] B. Saruhan, A. Yüce, Y. Gönüllü, K. Kelm, Effect of Al doping on NO2gas sensing of
TiO2at elevated temperatures, Sens. Actuators B Chem. 187 (2013) 586–597,
https://doi.org/10.1016/j.snb.2013.04.111.
[76] R. Vyas, S. Sharma, P. Gupta, Y.K. Vijay, A.K. Prasad, A.K. Tyagi, K. Sachdev, S.K. Sharma, Enhanced NO2sensing using ZnO–TiO2nanocomposite thinfilms, J.
Alloys. Compd. 554 (2013) 59–63,https://doi.org/10.1016/j.jallcom.2012.11.059. [77] Y. Gönüllü, A.A. Haidry, B. Saruhan, Nanotubular Cr-doped TiO2for use as
high-temperature NO2gas sensor, Sens. Actuators B Chem. 217 (2015) 78–87,https://
doi.org/10.1016/j.snb.2014.11.065.
[78] Z. Zhu, S.-J. Lin, C.-H. Wu, R.-J. Wu, Synthesis of TiO2nanowires for rapid NO2
detection, Sens. Actuators Phys. 272 (2018) 288–294,https://doi.org/10.1016/j. sna.2018.02.006.
[79] B.J. Hansen, N. Kouklin, G. Lu, I.-K. Lin, J. Chen, X. Zhang, Transport, analyte detection, and opto-electronic response of p-Type CuO nanowires, J. Phys. Chem. C 114 (2010) 2440–2447,https://doi.org/10.1021/jp908850j.
[80] R. Kumar, N. Goel, M. Kumar, UV-activated MoS2 based fast and reversible NO2 sensor at room temperature, ACS Sens. 2 (2017) 1744–1752,https://doi.org/10. 1021/acssensors.7b00731.
[81] W. Han, Z. Li, Y. Li, X. Fan, F. Zhang, G. Zhang, W. Peng, The promoting role of different carbon allotropes cocatalysts for semiconductors in photocatalytic energy generation and pollutants degradation, Front. Chem. 5 (2017),https://doi.org/10. 3389/fchem.2017.00084.
[82] R. Sellappan, J. Sun, A. Galeckas, N. Lindvall, A. Yurgens, A.Y. Kuznetsov, D. Chakarov, Influence of graphene synthesizing techniques on the photocatalytic performance of graphene–TiO2nanocomposites, Phys. Chem. Chem. Phys. 15
[83] Y.T. Liang, B.K. Vijayan, K.A. Gray, M.C. Hersam, Minimizing graphene defects enhances titania nanocomposite-based photocatalytic reduction of CO2for
im-proved solar fuel production, Nano Lett. 11 (2011) 2865–2870,https://doi.org/10. 1021/nl2012906.
[84] A. Trapalis, N. Todorova, T. Giannakopoulou, N. Boukos, T. Speliotis, D. Dimotikali, J. Yu, TiO2/graphene composite photocatalysts for NOxremoval: a comparison of
surfactant-stabilized graphene and reduced graphene oxide, Appl. Catal. B Environ. 180 (2016) 637–647,https://doi.org/10.1016/j.apcatb.2015.07.009.
[85] H. Zhang, X. Lv, Y. Li, Y. Wang, J. Li, P25-graphene composite as a high perfor-mance photocatalyst, ACS Nano 4 (2010) 380–386,https://doi.org/10.1021/ nn901221k.
[86] R. Zouzelka, J. Rathousky, Photocatalytic abatement of NOxpollutants in the air
using commercial functional coating with porous morphology, Appl. Catal. B Environ. 217 (2017) 466–476,https://doi.org/10.1016/j.apcatb.2017.06.009. [87] F. Dong, Z. Zhao, Y. Sun, Y. Zhang, S. Yan, Z. Wu, An advanced semimetal–organic
Bi spheres–g-C3N4nanohybrid with SPR-Enhanced visible-light photocatalytic
performance for NO purification, Environ. Sci. Technol. 49 (2015) 12432–12440, https://doi.org/10.1021/acs.est.5b03758.
[88] Y. Ohko, Y. Nakamura, A. Fukuda, S. Matsuzawa, K. Takeuchi, Photocatalytic oxidation of nitrogen dioxide with TiO2thinfilms under continuous UV-light
illu-mination, J. Phys. Chem. C 112 (2008) 10502–10508,https://doi.org/10.1021/ jp802959c.