EVALUATION OF CAMERA POSITIONS AND GROUND POINTS QUALITY IN A
GNSS-NRTK BASED UAV SURVEY: PRELIMINARY RESULTS FROM A PRACTICAL
TEST IN MORPHOLOGICAL VERY COMPLEX AREAS
E. Tufarolo1*, C. Vanneschi2, M. Casella3, R. Salvini11 Department of Environment, Earth and Physical Sciences and Centre of Geotechnologies, University of Siena, Via Vetri Vecchi 34, 52027 San Giovanni Valdarno, Italy
[email protected], [email protected]
2 CGT Spinoff s.r.l., Strada Provinciale delle Miniere, Polo Industriale di Bomba, 52022 Cavriglia, Italy - [email protected] 3 AeroDron s.r.l., Via Cremonese 35/A, 43126 Parma, Italy – [email protected]
KEY WORDS:UAV, Network Real Time Kinematic, Photogrammetry, Structure-from-Motion, Open Pit Mine, Positional accuracy assessment.
ABSTRACT
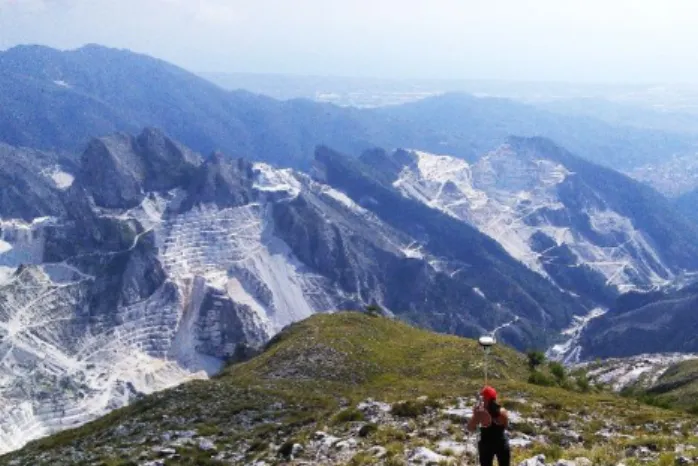
Open pit mines localized in high mountains are probably one of the most complex environments for Structure-From-Motion (SfM) based photogrammetry. The case study presented in this paper refers to the realization of a detailed topographic mapping in the Torano marble basin (Apuan Alps, Italy) which needed, after decades of excavation activity, a new topographic survey.
Given the requested very high resolution, the time constraints and safety-related problems, a photogrammetric approach by a fixed-wing Unmanned Aerial Vehicle (UAV) was chosen to carry out thesurvey of the basin. In addition, given the morphological complexity of the area, characterized by extreme steep slopes more than hundreds of meters high, and the necessity to minimize the fieldwork without sacrificing the work quality, an UAV equipped with a L1/L2 Network Real Time Kinematic (NRTK) Global Navigation Satellite System (GNSS) was used.
The scope of this work is to compare the accuracy of UAV derived 3D photogrammetric models realized with different approaches: by using traditional Ground Control Points (GCPs), by using the on-board Network Real Time Kinematic system for camera position detection, and a mix of both. At the end, we tested the quality of the models to verify the reachable levels of accuracy.
1. INTRODUCION
This paper analyses the accuracy of a bundle-adjustment photogrammetric process which uses photos from fixed-wing UAV flights over a morphological very complex mountain area. The work is part of a bigger project aimed to the creation of an updated topographic map, at a scale of 1:1,000, for an area more than 200 ha wide in the Torano marble basin (Carrara, Italy). The new topographic map was created from: a) the extraction of contour lines from the dense 3D point cloud, b) the editing of contour lines within a 3D GIS environment, c) the drawing in 3D of the remaining topographic features basing on the interpretation of the orthophotomosaic. Both, the dense point cloud and the orthophotomosaic, were generated by processing the digital images acquired by UAV flights and their bundle-adjustment (topic of this work).
The Torano basin is characterized by high morphological complexity (Figure 1), consequence of the geology and the long history of the mining site attributable to the Roman Empire age. As base for the new topography, the dense point cloud and the high resolution orthophotomosaic were used as described in papers from Mancini et al. (2013), Gonçalves and Henriques (2015) and Westoby at al. (2012). Data was generated starting from digital images acquired by using a GNSS-NRTK equipped UAV. The work here presented focuses on the acquisition phase, the alignment of frames and their orientation through bundle-adjustment and SfM algorithms (Fonstad et al., 2013, Snavely et al., 2008; Ullman, 1979).
The analysis of the final model spatial accuracy was carried out by using different approaches.
Figure 1. Panoramic view from the top of the Torano Basin; from the highest point to the main access road, the altitude
difference is about 1,000 m. 1.1 Geographical and geological overview
The Torano basin is located in the Apuan Alps (Tuscany, Italy), the most important marble extraction area of Europe with a production of about 1 million tons/years (Salvini et al., 2014). The study area is located in the north-western part of the Carrara syncline, a pluri-kilometric isoclinal fold formed during the Tertiary orogenesis under greenschist conditions (Carmignani and Kligfield, 1990; Molli, 2008; Molli and Meccheri, 2012).
The International Archives of the Photogrammetry, Remote Sensing and Spatial Information Sciences, Volume XLII-2/W13, 2019 ISPRS Geospatial Week 2019, 10–14 June 2019, Enschede, The Netherlands
2. INSTRUMENTS 2.1 UAV
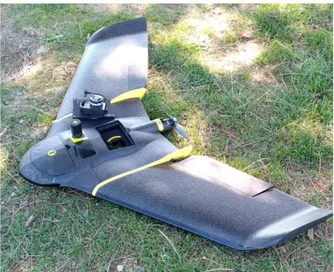
The UAV used for the survey is an eBee plus RTK fixed-wing vehicle, produced by SenseFly (Parrot Group, Figure 2).The drone is made of foam, carbon and other composite parts with a nominal take-off weight of 1.1 kg. The UAV can flight between 40 and 110 km/h and can resist to a 12 m/s wind. Three cells on board LiPo battery allow a maximum flight time of about 59 minutes. The remote control of the UAV is composed by a ground modem operating at 2.4 Ghz allowing communications between UAV and Windows based PC that operates as ground station through the eMotion 3 software. The software is also used as bridge between UAV and real-time GNSS network through the mobile internet access. For this project the NETGEO Network VRS was used (Topcon Positioning Italy s.r.l.).
Figure 2. The eBee plus RTK fixed-wing UAV used in this work.
2.2 Imaging sensor
A S.O.D.A. sensor was installed on the eBee payload bay. S.O.D.A. is the acronym of Sensor Optimised for Drone Applications, a photogrammetric sensor specifically developed for small-commercial UAV operations. It is based on 1-inch 20-megapixel RGB global shutter sensor (Table 1).
Sensor 1”
Lens 10.6 mm f/2.8
Resolution 5472 x 3648
Pixel size 2.4 µm
Ration 3:2
Image format JPEG, DNG
Table 1. Main specifications of the used S.O.D.A. camera. Due to the unavailability of the sensor’s calibration certificate and with the aim of eliminating a possible variable in the process of accuracy evaluation, the interior orientation of the S.O.D.A. was initially estimated with the camera self-calibration method (Fraser, 1997; Zhang, 2000; Remondino et al, 2006; Agisoft, 2008).
The calibration parameters (Table 2), calculated thanks to a reliable ground control points spatial distribution, were saved and utilised in the processing stage described in Paragraph 3.3.
Despite this, we have noticed that, even not fixing the camera calibration data, the bundle-adjustment step shows an extreme limited variation of the interior orientation parameters.
Parameter Value Error
F 4399.57 0.027 Cx 41.3461 0.021 Cy 19.1871 0.019 B1 1.77081 0.0062 B2 -0.159396 0.006 K1 0.0620122 6.5e-005 K2 -0.420381 0.00046 K3 0.929244 0.0013 K4 -0.60415 0.0012 P1 0.00293547 1.8e-006 P2 0.00077971 1.5e-006
Table 2. Interior orientation parameters of the used S.O.D.A. sensor as calculated through the self-calibration method. Figure 3 shows the distortion plot, based on self-calibration parameters, representing the image of residuals for the used S.O.D.A. sensor.
Figure 3. Image of residuals for the used S.O.D.A. sensor. 2.3 Onboard GNSS
The onboard GNSS based on a double-frequency GPS/GLONASS receiver operating at 20 Hz, which acquires the NRTK data through the standard transmission protocol RTCM 3.x.
The internet mobile signal was always good during the survey but, in order to avoid signal disconnection (due to complex morphologies or temporary interferences), a GNSS reference station (Leica GS15 system) was used during the flight. The reference station allowed the post-processing of UAV RINEX data for camera positions acquired during possible NRTK down-times.
3. DATA ACQUISITION AND PROCESSING 3.1 Flight plan and ground points distribution
Due to the morphological complexity of the area, the UAV flight plans were heavily conditioned by the elevation differences within the basin, and could not follow a traditional planar approach; the relevant vertical differences between The International Archives of the Photogrammetry, Remote Sensing and Spatial Information Sciences, Volume XLII-2/W13, 2019
relatively close points on the ground required the use of detailed and updated
planning stage. The use of the DEM, alongside the NRTK approach, allow
UAV above ground level during the acquisition and a better security for the
a grid format LiDAR survey
Tuscany Region in October 2017. Figure 4 shows the
Particular attention w
reconstruction algorithm might have more problems to returns high quality data
area, high slopes)
Figure 4 investigation area Figure 5 and Figure camera positions extremely complex
Figure 5. Spatial distribution of UAV c icons) in a Google
3.2 Topographic survey Several artificial particular attention posed limits. Three type
a) 75x75 cm painted ground b) 50x50 cm targets c) man buildings The topographic Leica GS15 GNSS SmartNet (using
In case of lack of the mobile internet connection
relatively close points on the ground required the use of detailed and updated Digital Elevation Model (D
planning stage. The use of the DEM, alongside the NRTK approach, allowed the maintaining of a constant
UAV above ground level during the acquisition and a better the UAV itself. T
grid format (1m pixel size
survey (Light Detection And Ranging) Tuscany Region in October 2017.
shows the planned Ground Particular attention was
reconstruction algorithm might have more problems to returns quality data (e.g. limits
area, high slopes).
4. GP distribution investigation area in a Google
and Figure 6 show positions during flights extremely complex morphology.
Spatial distribution of UAV c icons) in a Google
opographic survey
artificial GPs were measured
attention posed on more complex area . Three types of topographic point
75x75 cm painted ground 50x50 cm polyvinyl chloride targets; man-made targets buildings). topographic survey of G Leica GS15 GNSS receivers
using the nearest
lack of the mobile internet connection
relatively close points on the ground required the use of igital Elevation Model (D
planning stage. The use of the DEM, alongside the NRTK the maintaining of a constant
UAV above ground level during the acquisition and a better The adopted DEM
pixel size) derived from an airborne ight Detection And Ranging) Tuscany Region in October 2017.
planned Ground Points (
as given to the areas were the reconstruction algorithm might have more problems to returns
(e.g. limits of the investigation
distribution (red dots) and limits of the in a GoogleTM Earth panoramic
show a general view of the during flights that, inevitably,
morphology.
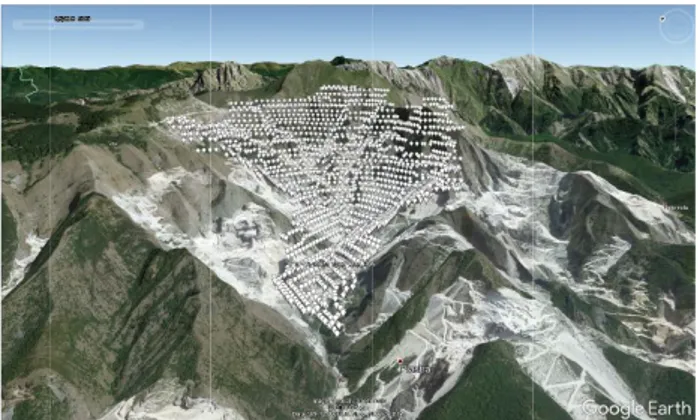
Spatial distribution of UAV camera positions (white icons) in a GoogleTM Earth nadiral view.
measured in the on more complex area of topographic points were acquired: 75x75 cm painted ground targets;
polyvinyl chloride (
(e.g. corner of container GPs was carried out
receivers with NRTK correction from HxGN the nearest Pieve Fosciana
lack of the mobile internet connection
relatively close points on the ground required the use of igital Elevation Model (DEM) for the planning stage. The use of the DEM, alongside the NRTK the maintaining of a constant elevation of the UAV above ground level during the acquisition and a better DEM is represented by ) derived from an airborne ight Detection And Ranging) supported
Points (GPs) distribution given to the areas were the reconstruction algorithm might have more problems to returns
estigation, excavation
(red dots) and limits of the panoramic view. a general view of the different
inevitably, follow the
amera positions (white Earth nadiral view.
in the area of interest on more complex areas and external
were acquired: (PVC) yellow/black corner of containers, edge of was carried out by using two with NRTK correction from HxGN
Fosciana reference statio lack of the mobile internet connection, the real relatively close points on the ground required the use of a
for the planning stage. The use of the DEM, alongside the NRTK elevation of the UAV above ground level during the acquisition and a better represented by ) derived from an airborne aerial supported by distribution. given to the areas were the reconstruction algorithm might have more problems to returns excavation
(red dots) and limits of the view.
different follow the
amera positions (white
area of interest with and external yellow/black s, edge of by using two with NRTK correction from HxGN reference station). , the real-time
correction was station
communication
if troubles occurred, by measuring the targets Static mode
latter, data was post
LGO 8.4 suite and contemporary satellite info recorded by the same reference station.
Figure 3.3
Survey data were pre
order to synchronize the frames and the coordinates position Coordinates a NRTK radio onboard GNSS and an elevated
GNSS base station were post reference station.
were characterised by h metadata format workflow in Agisoft
The total number of aligned camera station coverage area
is equal to 4.49 cm. resolution u
preselection, was completed in The (for a total of 64) Points (CPs) through position coordinate system (RDN2008/ height to software. The approach relative to coordinate detail following a) All the were on camera position board
correction was ensured by
stations, properly mounted in the higher zones of the basin. The communication was guaranteed by a direct
if troubles occurred, by measuring the targets
Static mode with acquisition times of about 15 minutes. In this latter, data was post
LGO 8.4 suite and contemporary satellite info recorded by the same reference station.
Figure 6. Spatial distribution of UA icons) in a Google Image photogrammetric Survey data were pre
order to synchronize the frames and the coordinates positions.
oordinates of camer NRTK correction
radio-link losses, required a onboard GNSS and
an elevated close area. Also GNSS base station were post
reference station. Hence, all the coordinates of were characterised by h
metadata format, ready to be workflow in Agisoft
The total number of aligned camera station coverage area of 2.11 km
is equal to 4.49 cm.
resolution using camera positions as reference for images preselection, was completed in
The coordinates of for a total of 64) w
oints (CPs) and used rough the bundle position coordinate
system Rete Dinamica Nazionale 2008/Zona 32 (RDN2008/TM32); altimetry was converted from ellipsoidal height to orthometric
software.
4. ANALYSIS The photogrammetric 3D approaches in order to obtain relative to coordinate detail, the followed following:
All the measured were used as CPs on camera position board NRTK system
ensured by a couple of Leica 1200 reference s, properly mounted in the higher zones of the basin. The
was guaranteed by a direct if troubles occurred, by measuring the targets
with acquisition times of about 15 minutes. In this latter, data was post-processed in laboratory by using Leica LGO 8.4 suite and contemporary satellite info recorded by the same reference station.
Spatial distribution of UA icons) in a GoogleTM Earth
photogrammetric processing Survey data were pre-processed through
order to synchronize the frames and the coordinates amera positions were
correction, but some frames
losses, required a differential correction between onboard GNSS and the Leica GS15 local base station
area. Also in these cases, data from the local GNSS base station were
post-Hence, all the coordinates of were characterised by high accuracy
ready to be processed wi workflow in Agisoft Photoscan Pro 1.4 The total number of aligned camera station
of 2.11 km2. The mean ground
is equal to 4.49 cm. Image matching and alignment, at medium sing camera positions as reference for images preselection, was completed in 2 hours
coordinates of GPs acquired during the topographic survey were placed on the model as
and used to optimis bundle-adjustment. Both position coordinates were projected in the
Rete Dinamica Nazionale 2008/Zona 32 TM32); altimetry was converted from ellipsoidal orthometric height by adopting info from
ANALYSISOF
photogrammetric 3D model was generated in order to obtain, as much as
relative to coordinates accuracy and frame alignment quality. followed bundle-adjustment
measured topographic point CPs and the bundle
on camera position coordinates acquired NRTK system;
a couple of Leica 1200 reference s, properly mounted in the higher zones of the basin. The
was guaranteed by a direct radio if troubles occurred, by measuring the targets
with acquisition times of about 15 minutes. In this processed in laboratory by using Leica LGO 8.4 suite and contemporary satellite info recorded by the
Spatial distribution of UAV camera positions (white Earth pseudo-3D view. processing
through eMotion order to synchronize the frames and the coordinates
were principally obtained from some frames, acquired during few differential correction between Leica GS15 local base station
in these cases, data from the local -processed using the same Hence, all the coordinates of camera position
igh accuracy and were
processed with the standard Photoscan Pro 1.4 code.
The total number of aligned camera stations was 2071 for a . The mean ground sampling distance Image matching and alignment, at medium sing camera positions as reference for images
hours.
acquired during the topographic survey placed on the model as GCP
optimise the exter adjustment. Both targets
projected in the Italian
Rete Dinamica Nazionale 2008/Zona 32 TM32); altimetry was converted from ellipsoidal
by adopting info from OF RESIDUALS model was generated much as possible
accuracy and frame alignment quality. adjustments approaches were the topographic points (ground points, and the bundle-adjustment was based only
coordinates acquired thanks to a couple of Leica 1200 reference s, properly mounted in the higher zones of the basin. The radio connection or, if troubles occurred, by measuring the targets in the
Rapid-with acquisition times of about 15 minutes. In this processed in laboratory by using Leica LGO 8.4 suite and contemporary satellite info recorded by the
V camera positions (white 3D view.
eMotion 3 software in order to synchronize the frames and the coordinates of camera principally obtained from acquired during few differential correction between Leica GS15 local base station placed in in these cases, data from the local processed using the same camera positions and were stored in exif
th the standard SfM was 2071 for a sampling distance Image matching and alignment, at medium sing camera positions as reference for images acquired during the topographic survey GCPs and Check e the exterior orientation
targets and camera Italian reference Rete Dinamica Nazionale 2008/Zona 32
TM32); altimetry was converted from ellipsoidal by adopting info from ConveRgo
S
using different possible, information accuracy and frame alignment quality. In s approaches were the ground points, GPs) adjustment was based only
thanks to the on-a couple of Leicon-a 1200 reference s, properly mounted in the higher zones of the basin. The , -with acquisition times of about 15 minutes. In this
processed in laboratory by using Leica LGO 8.4 suite and contemporary satellite info recorded by the
in camera principally obtained from acquired during few differential correction between in in these cases, data from the local processed using the same s exif SfM was 2071 for a sampling distance Image matching and alignment, at medium sing camera positions as reference for images acquired during the topographic survey heck ior orientation and camera reference Rete Dinamica Nazionale 2008/Zona 32 TM32); altimetry was converted from ellipsoidal go
different information In s approaches were the GPs) adjustment was based only -The International Archives of the Photogrammetry, Remote Sensing and Spatial Information Sciences, Volume XLII-2/W13, 2019
b) A small number of measured topographic points was used as GCPs and the remaining as CPs. The bundle-adjustment was based on camera position coordinates and GCPs; c) Topographic points were used as in the case of a traditional
not-NRTK UAV survey; the bundle-adjustment was based on camera position coordinates and GCPs;
d) Topographic points were used as in the case of a traditional not-NRTK UAV survey; the bundle-adjustment was based only on GCPs.
Tables 3 and 4 report the Root Mean Square Errors (RMSEs) of camera positions, GCPs and CPs in the different configurations (i.e. a, b, c and d). Conf. Nr. of used GCPs Nr. of used CPs Use of camera positions GCP XY RMSE (cm) CP XY RMSE (cm) Cam. XY RMSE (cm) a 0 64 Yes - 83 11.6 b 14 50 Yes 12 42 18.8 b 24 40 Yes 7.7 30.48 22.15 b 35 29 Yes 6.31 28.62 23.17 c 49 15 Yes 6.06 15.58 25.26 d 14 50 No 0.5 7.51 89.2 d 24 40 No 0.6 7.08 89.8 d 35 29 No 0.92 5.43 86.4 d 49 15 No 1.18 4 86
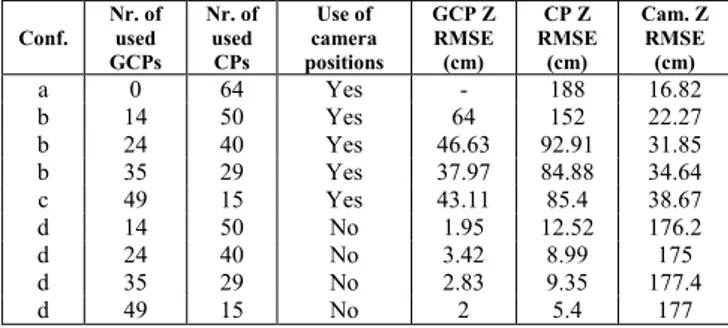
Table 3. Planimetric XY RMSEs (cm) in different bundle-adjustment configurations. Conf. Nr. of used GCPs Nr. of used CPs Use of camera positions GCP Z RMSE (cm) CP Z RMSE (cm) Cam. Z RMSE (cm) a 0 64 Yes - 188 16.82 b 14 50 Yes 64 152 22.27 b 24 40 Yes 46.63 92.91 31.85 b 35 29 Yes 37.97 84.88 34.64 c 49 15 Yes 43.11 85.4 38.67 d 14 50 No 1.95 12.52 176.2 d 24 40 No 3.42 8.99 175 d 35 29 No 2.83 9.35 177.4 d 49 15 No 2 5.4 177
Table 4. Altimetric Z RMSEs(cm) in different bundle-adjustment configurations.
5. DISCUSSION AND CONCLUSIONS
UAV NRTK system, together with LiDAR derived DEM, resulted very useful for navigation purposes and allowed performing complex flight plans, necessary for obtaining the expected accurate outputs.
The high accuracy camera positions stored in the exif metadata format, allowed completing the alignment phase of the SfM process (in reference preselection modality) of 2071 images in 2 hours with a Dual Xeon Workstation, 128 Gigabyte RAM and 2 GPU.
Table 3 and 4 show the calculated results in different bundle-adjustment configurations: the accuracy level was analysed on the CPs which were not used in bundle block adjustment but only as assessment points. Indeed, the relevant information for this work are the differences between the coordinates measured from the obtained block model and the real coordinates measured in the field trough the GNSS topographic survey. In the first approach (a) the resultant XY RMSE was equal to 83 cm, while the RMSE on the Z coordinate was 188 cm. The use of a certain number of GCPs (approach “b”, 14 GCPs and 50 CPs) results in a lower error, with a planimetric RMSE of 42 cm
and an RMSE of 152 cm on the Z coordinate. Passing to 49 GCPs and 15 CPs (approach “c”) the calculated RMSE on XY coordinates was equal to 15.58 cm, but on Z the RMSE remained still high (85.4 cm). The exclusion of camera coordinates from the bundle adjustment (approach “d”) resulted in a better accuracy with a planimetric RMSE of 4 cm and a RMSE of 5.4 cm on the Z coordinate (i.e. with 49 GCPs and 15 CPs configuration).
Anyway, with reference to the approach “d”, the RMSE on CPs resulted quite low even with a small number of GCPs (only 14 well distributed points); in particular, the RMSEs resulted of 7.51 cm on XY and 12.51 on Z coordinate.
These errors, related to the CPs residuals, can be considered acceptable for the creation of a 3D model to be used for cartographic aims at a scale of 1:1,000. The errors in elevation, which result from models generated following the approach “a” (lower than 2m) are acceptable only for the production of1:10,000 topographic maps.
To conclude, despite the technological progresses with SfM and NRTK on-board systems, the results of this research shows the necessity of measuring a homogeneous distribution of ground points in order to produce large-scale cartography. This is particularly true in a very complex morphological environment such as the mining area used for this test.
In addition, for a better understanding of the influence of camera position coordinates (recorded through a GNSS-NRTK receiver) on bundle block adjustment, a more detailed analysis may be beneficial. For example, a segmented approach, with a flight by flight analysis in subset areas could be useful to investigate the influence of the satellites signal degradation or the lack of real-time connection due to mobile internet signals instability, especially in the most depressed part of the site.
ACKNOWLEDGEMENTS
The authors would thank to Dumas F. and Omya GmbH personnel, especially Fantin G.P., Strauss H. and Pirkopf V., for the possibility given to carry out the project. Thanks also to Vernacchia L. and Rindinella A. for the help in the extensive fieldwork and Lanciano C. for the help in some image processing steps.
REFERENCES
Agisoft LLC, 2018. Agisoft Photoscan User Manual, Professional Edition, Version 1.4. agisoft.com
Carmignani, L., Kligfield, R., 1990. Crustal extension in the Northern Apennines: the transition from compression to extension in the Alpi Apuane core complex. Tectonics, 9, 1275– 1303.
Fonstad, M.A., Dietrich, J.T., Courville, B.C. and Carbonneau, P.E., 2013. Topographic structure from motion: a new development in photogrammetric measurements. Earth Surface Processes and landforms, 20: 817-827.
Fraser, C. S., 1997. Digital camera self-calibration. ISPRS
Journal of Photogrammetry and Remote sensing, 52(4),
149-159.
Gonçalves, J. A. and R. Henriques, 2015. UAV photogrammetry for topographic monitoring of coastal areas. ISPRS Journal of Photogrammetry and Remote Sensing 104: 101-111.
The International Archives of the Photogrammetry, Remote Sensing and Spatial Information Sciences, Volume XLII-2/W13, 2019 ISPRS Geospatial Week 2019, 10–14 June 2019, Enschede, The Netherlands
Mancini, F., Dubbini, M., Gattelli, M., Stecchi, F., Fabbri, S. and Gabbianelli G., 2013. Using unmanned aerial vehicles (UAV) for high-resolution reconstruction of topography: the structure from motion approach on coastal environments. Remote Sens., 5, pp. 6880-6898, 10.3390/rs5126880.
Molli, G., Meccheri, M., 2012. Structural inheritance and style of reactivation at mid-crustal levels: a case study from the Alpi Apuane (Tuscany, Italy). Tectonophysics 579, 74-87.
Molli, G., 2008. Northern Apennine-Corsica orogenic system: an updated review. In S. Siegesmund, B. Fügenschuh& N. Froitzheim (Eds.), Tectonic aspects of the Alpine-Dinaride-Carpathian System (Vol. 298, pp.413–442). Geological Society of London, Special Publication.
Remondino, F., and Fraser, C., 2006. Digital camera calibration methods: considerations and comparisons. International
Archives of Photogrammetry, Remote Sensing and Spatial Information Sciences, 36(5), 266-272.
Salvini, R., Giovannini, R., Vanneschi, C., Riccucci, S., Francioni, M. and Stead, D., 2014. The use of remote sensing for discontinuity mapping and analysis in a large marble quarry, Carrara, Italy. In International discrete fracture network engineering conference, Vancouver, Canada.
Snavely, N., Seitzs, N. and Szeliski R., 2008. Modeling the world from internet photo collections. International Journal of computer vision, 80: 189-210.
Ullman, S., 1979. The interpretation of visual motion. MIT Press, Cambridge, MA, USA.
Westoby, M.J., Brasington, J., Glasser N.F., Hambrey, M.J. and Reynolds, J.M., 2012. ‘Structure-from-Motion’ photogrammetry: a low-cost, effective tool for geoscience applications. Geomorphology, 179: 300-314
Zhang, Z., 2000. A flexible new technique for camera calibration. IEEE Transactions on pattern analysis and machine
intelligence, 22.
The International Archives of the Photogrammetry, Remote Sensing and Spatial Information Sciences, Volume XLII-2/W13, 2019 ISPRS Geospatial Week 2019, 10–14 June 2019, Enschede, The Netherlands