International Journal of Advances in Management and Economics
Available online at:
www.managementjournal.info
RESEARCH ARTICLE
Under-Capitalization and Other Factors that Influence the
Survival of Young Italian Companies
Domenico Nicolo
1(*) (**), Bruno Ricca
2 (**)1.Department DIGIES/ University Mediterranea of Reggio Calabria, Italy.
2.Department of Economics/ University of Messina, Italy. *Corresponding Author: Email: [email protected].
** D. Nicolò is the author of “Introduction” and “Conclusion, Findings and Research Perspectives”. B. Ricca is the author of “Survey and Variables”, “Methodologies” and “Survival Estimates”
Abstract : Start-ups or young companies are susceptible to a variety of general pressures, as well as specific, and this phenomenon affects companies across the spectrum due to the shared characteristics common to all. This paper approaches some factors that influence the survival of companies in the first stage of life (with case studies and data referring to the first five years of operation) and presents the variables that may influence a company’s survival, such as: operational and financial risks, total assets, share capital, business sector and geographical area. To this aim, our concentration pinpointed the 5-year survival rates of Italian companies throughout 2008, 2009, 2010 and 2011. Our analysis points out as the capitalization and the geographical area influence the chance to survive of the Italian companies.
Keywords: Company’s survival rates, Start-ups, Young firms.
Article Received: 03 Feb. 2019 Revised: 10 Feb. 2019 Accepted: 23 Feb. 2019
Introduction
Young companies suffer greater vulnerability than mature ones [1, 2, 3]. Their first years of life are fraught with high levels of fragility [4, 5, 6, 7, 8, 9] due to high mortality rates present in different nations and sectors, with relative invariance over time [10, 11, 12]. Whilst the specific causes may differ from company to company, it is certainly true that there is a ubiquitous nature to the instability and vulnerability encountered by start-ups which typically affect young firms. Thus, higher levels of fragility are an inherent characteristic for companies in their early stages of development.
As young firms are by their very nature untried and lacking in corporate reputation, there too lies another barrier on their survival. There is no quantifiable record or even accounts of the company’s ability to face its competitors [13] or fulfil obligations to its stakeholders (lenders, investors, suppliers, client companies, workers, etc.).
Consequently, trust with stakeholders can be lacking. At the first sign of difficulty any modicum of trust is shattered, while some companies may succumb to the lack of human, technical and financial resources necessary and can cease operations altogether. Previous
research into has already highlighted how young companies have pinned their corporate reputations on the image of the founder and that founder’s entrepreneurial successes, or their experienced and highly skilled workforce and/or actual strategic partners whose success can vouch for the company, in order to stretch the lines of reputation between individuals and companies. Reputation can also be devolved within the ecosystem in which the company operates in. Thus, if located in an area of renowned tourism, those companies associated with the tourist industry can accelerate the process of enhancing their corporate reputations.
To the same ends, businesses situated in an industrial district of companies specialising in the same sector with an established reputation will act as a beacon for all [10, 11, 12]. New companies are also hampered by their limited size, increasing fragility both in general terms and within the universal nature of business[14, 15, 2].
It is This Dogma Which Best Reflects the Typical Weaknesses of Small Firms
The lack of skilled and experienced human resources [16,17];
A scarcity of financial resources [18] due to initial teething in shorter planning [19, 20, 21, 22, 23, 24, 25, 26, 27, 28, 29, 30, 31]. Should a business plan be ill-prepared, or adequate assessment be misjudged, it is very easy to underestimate the financial needs and, consequently, cash flow problems may rear up long before reaching break-even or securing any market objectives;
Higher unit costs compared to bigger companies [32];
The heightened risks related to low diversification, as new companies are ill-placed to implement costly diversification strategies [33].
Survival May Also be Linked to Specific Characteristics Which Vary between Companies, Such As
The attributes and characteristics of their founder (or members of the co-founders' team) [34, 35, 36, 37, 38, 39, 40, 41, 42] such as gender [43, 44], education, competence and entrepreneurial experience [45, 46, 47, 48, 49], reputation [10, 11, 12]; risk tolerance [50], fear of failure [51, 52, 53, 54], persistence [55, 56];
The functions or activities performed before and immediately after commencing operations [57, 58, 59, 60, 61, 62, 63, 64] and the sequence with which these activities were performed (37; 65; 66; 67];
The characteristics of their entrepreneurial ecosystem [68, 69, 70, 71, 72];
The consistency between the strategies which have been put into practice and the composition of their industry [73, 74, 75, 76, 77, 78];
All or any strategic alliances [79];
Experience gained during business plan competitions [80, 81, 82, 83, 84, 85] and incubation / acceleration programs for start-ups [86].
This paper attempted to focus on the following key factors that influence survival rates in new companies: operational and financial risks, share capital, total assets, business sector, and geographical area of operations. This research paper investigated Italian companies with a share capital not less than€20.000, 00.
The database deliberately excluded the scores of micro-enterprises from the 5-year survival rates. Survival is linked to
under-capitalization a factor which offsets other factors. The inclusion of micro-enterprises would certainly have distorted the research results.
Whilst the conclusions only explain the causes of vulnerability in Italian start-ups with a share capital not less than €20.000, 00, they are of interest in comparing the obstacles encountered by start-ups in other nations. All findings were based on the five-year survival rates for Italian companies within the following cohorts: 2008-13, 2009-14, 2010-15 and 2011-16, to verify whether, and to what extent, their survival/cessation was influenced by the above-mentioned variables.
The Findings Identify the Following Research Questions
RQ1: operational and financial risk rates in the first years of operations;
RQ2: amount of share capital;
RQ3: amount of total assets;
RQ4: business sector;
RQ5: geographical area.
The investigation centred on a medium-long term period (as stated above: 4 cohorts) to determine whether the 5-year survival rates of Italian companies can be considered relatively constant over time, whilst eliminating factors related to the wider economic pattern. Any company involved in the processes of liquidation (either forced or voluntary) or bankruptcy in the first five years of life, is considered wound up.
Such procedures may often be prolonged over some considerable time. Certain companies were evaluated as wound up, despite their continued activity, due to the inevitability of such an end, despite their survival beyond the period under observation. Among such companies were those with no sales revenues during two years of the initial five.
Survey and Variables
A process of ‘cleaning up’ all data extracted from AIDA was pursued. In certain instances, the results produced in the database which were not useful for research purposes (e.g. SALES <0) or not available. Wherever sensitive or interesting data was deemed incongruous it was deleted from the database of such companies.
Furthermore, since only one third of the companies investigated provided accurate and real evidence concerning the number of actual employees; such information could not be used as verified data and consequently was not included in the final data analysis. For each company and cohort, the values relating to operational and financial leverage were calculated as follows:
Operating Leverage = (1)
Financial Leverage= (2)
Where t = 1 with t = 1 (first year of each cohort), 2 … 5, 6 (last year of each cohort) Moreover, when gauging the nature for the
calculation of these two evaluations, it was also necessary to eliminate those companies that declared their value as equal to zero in the fields of Ebitt, Salest, Shareholders Fundst. Thereafter, companies were distinguished as "Active" or "Not-Active" according to the Status field reported in the AIDA database. Hence, those companies whose value of the Status variable was attributable to the following definitions were considered "Not-Active": default of payment, insolvency proceedings, bankruptcy, dissolved, demerger, liquidation, merger or take-over. Finally, those companies that in the last two years of each cohort had declared no turnover were added, and therefore considered "Not-Active". The survey was executed by studying the following subset of the original population:
Table 1: Total Number Of Companies Included In The Cohorts For Statistical Analysis
Cohort Total Companies Not-Active Companies
2008-2013 7896 625
2009-2014 7166 660
2010-2015 8174 1315
2011-2016 7376 1905
Variables considered for the analysis Table 2: Variables and Categories
Variable Meaning/Importance
Status =0 ACTIVE; =1 NOT ACTIVE
Time Month
Total number of months between the date of company activation and the date on which the company performed the first of these procedures: default of payment, insolvency proceedings, bankruptcy, dissolved,
demerger, liquidation, merger or take-over
Industries The variable was divided into the following modalities: Industry in strict sense; Commerce, Hotels e restaurant; Construction; Agriculture; Other services Geographical
area
The variable was divided into the following modalities: Northwest; North East; Centre and South and islands
Capital The variable was divided into 4 modalities based on quartiles: H= High; MH = medium-high; ML = medium-low and L = Low Total Asset The variable was divided into 4 modalities based on quartiles: H= High; MH = medium-high; ML = medium-low and L = Low
Operating Leverage
The variable was divided into 4 modalities based on quartiles: H= High; MH = high; ML = medium-low and L = Low
Financial
Leverage The variable was divided into 4 modalities based on quartiles: H= High; MH = medium-high; ML = medium-low and L = Low It is important to clarify that for each cohort
the main duration variable; expressing Time_Month, was calculated as the duration period measured in months between the creation of the company in the first year of each cohort, and the moment at which the company became at risk of bankruptcy (in this case variable STATUS is equal to one of
the states described above which define NO Active company).
Thus, an estimation was made of the probability that a company established in the first year of each cohort could depart the production system within the five-year term defining the same cohort.
Methodologies
The decision to adopt non-econometric methodologies acquired from other research fields was taken [87] due to their appropriacy in economic dynamics [88, 89, 90]. Lancaster demonstrated that a simple transition model that describes duration in a single state has two characterisations: the duration distribution F (t) and the risk function θ(t) [89]. The risk function can be defined as the conditional probability of exit from state at time t which is conditioned by survival always at time t:
(3) Hence, f (t) = F '(t) is the duration density function, which, when expressed in terms of a risk function will be
(4) The basis, therefore, of all other survival models lies in his formulation [89] and can be seen as elaborations of the basic probabilistic identity. The duration models can be parametric, semi-parametric and non-parametric.
This survey engaged the Kaplan-Meier non-parametric survival function as a first step [91], while the parametric estimate of the Hazard Rate was obtained by using the semi-parametric proportional hazards model of Cox [87].
This model in conjunction with non-parametric characterises the parametrisation of the relationship between the duration and the regressors. The Cox model provides a direct estimate based on the observed data preventing the imposition of conditions on the duration function. The Kaplan–Meier estimator is the product limit estimator and, as such, is a non-parametric statistic used to calculate the survival function from lifetime data [91].
The estimator is presented as
(5)
Where ti is a time when an event occurred (in this case the month in which the company's closure procedure begins), ki is the number of events that occurred at time ti and ni the surviving enterprises (which have not yet encountered an event or been censored) at time ti.
In this case the Kaplan-Meier estimator was obtained from the maximum probability estimation of hazard function. By adopting the Kaplan-Meier non-parametric method, the characteristics of the process under examination can be described without forming hypotheses concerning the distribution of events whilst considering the shortened survival times (censored) in which the event did not occur. By use of the Kaplan-Meyer procedure the survival table is achievable by estimating time, cumulative survival, standard error, cumulative and remaining events, mean survival time, the standard error at 95% confidence interval, thus providing graphs for the elaboration of the survival functions, the risk functions and logarithm of the survival functions.
Three non-parametric tests may also be used to evaluate the equality or not of the survival curves for different categories of the factor under examination, namely: Log-rank test [92], Wilcoxon test [93] and Tarone Ware test [94-95].
The aforementioned are based on a Chi-square test. The p_value is lower and significant differences can be noted between the groups. The proportional hazards model was developed by Cox [87] to deal with continuous time survival data. The Cox method does not suppose any distinct distribution with regards to survival times, but instead surmises that the effects of the variables on survival are constant over time and are additive.
As a consequence, any understanding of the risk function is the probability that a company can initiate the closing procedure within a short-time interval since it has survived up till the beginning of such interval.
Any interpretation would therefore be the risk of failure at time t. The risk function (indicated by λ (t, X)) can be estimated using the following equation: Λ (t,X) = λ0 (t)exp(β X) (6) where λ (t, ...) indicates the resulting risk, given the values of the m covariate for the respective case X and the respective survival time (t).
The term λ0 (t) is termed the baseline risk, which in this case is the risk to the respective enterprise when all the values of the
independent variable are equal to zero. It is possible to linearize this model by dividing each side of the equation by λ0 (t) and then calculating the natural logarithm for each side: log (λ (t, X)/ λ0 (t)) = β X (7) achieving a relatively "simple" linear model that can be rapidly estimated.
Survival Estimates
Kaplan-Meier survival estimates
The survival functions related to the cohorts (Figure 1) plainly indicate that the economic crisis that began in 2008 has brought with-it ever-increasing consequences over time. Were the result to depend on the selection of companies, the graph clearly demonstrates that the surviving companies within each cohort would be in a state of constant decline over time (between the cohorts).
Figure 1: Kaplan-Meier survival estimates distinct by cohort Cohorts: 2008-13 2009-14 2010-15 2011-16
The Kaplan-Meyer procedure could furnish a critical evaluation of the survival functions thus obtained, in order to compare the single modalities of each variable and cohort when analysing the data. That said; the elevated number of graphs necessary for the purpose of evaluating company’s survival differences,
both at each variable and cohort, meant that the Log-Rank test results were the most suitable option, Wilcoxon and Tarone Ware. However, when observing Table 3, it is transparent that, in each cohort, there are significant differences (p-value <0.05) in the companies’ probability of survival.
Table 3: Non-Parametric Test Of The Survival Functions Equality, Distinct On Covariates
Cohort Variable Statistics Log-rank Wilcoxon Tarone-Ware
2008-2013
Business sector Value 76,744 47,260 60,902 p-value < 0,0001 < 0,0001 < 0,0001 Geographical area Value 5,869 5,643 5,671 p-value 0,118 0,130 0,129 Capital Value 2,792 2,568 2,885 p-value 0,248 0,277 0,236
Total Asset Value 16,790 15,511 17,036
p-value 0,001 0,001 0,001
Operating leverage Value 36,499 27,765 32,396 p-value < 0,0001 < 0,0001 < 0,0001 Financial leverage Value 38,358 34,631 89,583
p-value < 0,0001 < 0,0001 < 0,0001 Cohort Variable Statistics Log-rank Wilcoxon Tarone-Ware 2009-2014 Business sector Value 21,752 11,163 15,645
Data Analysis with Cox Proportional Hazards Model
As the aforementioned analysis described previously (see Table 3) provides a concept of significance, yet no valid quantitative estimate of the difference between the
different modalities of the variables assessed, to understand the differing regressors on probability of survival, data analysis using the Cox proportional risk model would ensure Geographical area Value 11,567 8,456 9,941 p-value 0,009 0,037 0,019 Capital Value 9,358 8,146 8,793 p-value 0,009 0,017 0,012
Total Asset Valore 22,220 13,255 17,461
p-value < 0,0001 0,004 0,001 Operating leverage Value 10,722 6,455 8,085
p-value 0,013 0,091 0,044
Financial leverage Value 59,980 41,993 50,573 p-value < 0,0001 < 0,0001 < 0,0001 Cohort Variable Statistics Log-rank Wilcoxon Tarone-Ware
2010-2015
Business sector Value 38,576 27,728 33,475 p-value < 0,0001 < 0,0001 < 0,0001 Geographical area Value 12,671 17,542 15,700 p-value 0,005 0,001 0,001 Capital Value 5,818 7,772 6,935 p-value 0,121 0,051 0,074
Total Asset Value 75,661 71,870 75,774
p-value < 0,0001 < 0,0001 < 0,0001 Operating leverage
Value 3,695 2,408 3,040
p-value 0,296 0,492 0,385
Financial leverage Value 56,682 52,404 55,830 p-value < 0,0001 < 0,0001 < 0,0001 Cohort Variable Statistics Log-rank Wilcoxon Tarone-Ware
2011-2016
Business sector Value 40,881 28,184 34,174 p-value < 0,0001 < 0,0001 < 0,0001 Geographical area Value 18,639 11,353 14,506 p-value 0,000 0,010 0,002 Capital Value 6,041 6,207 6,606 p-value 0,049 0,045 0,037
Total Asset Value 163,938 141,017 156,085 p-value < 0,0001 < 0,0001 < 0,0001 Operating leverage Value 14,812 8,723 11,839
p-value 0,002 0,033 0,008
Financial leverage Value 86,838 84,960 89,583 p-value < 0,0001 < 0,0001 < 0,0001
maximum probability. Tables 4 and 5 show the results of the estimates gained from applying the Cox proportional hazard model. To facilitate reading we report only, the analysis concentrates on the four cohorts, risk coefficients (HR) and associated p_values to ensure the report is not ambiguous. The probability ratio tests (see Tables 4 and 5) confirm that the models are adequate, whereby; under investigation an impact of the covariates is examinable. To these ends, the only significant results of each modality for each variable were identified and examined.
Industries (Control Modality Other Services)
The modalities "Industry in the strict sense" and "Commerce, hotels and restaurants" are of great importance in all cohorts, conveying a propensity to fail, statistically lower than "Other services" sector. A case in point would be companies belonging to "Industry in the strict sense" sector, where the risk of leaving the production system is lower when compared to "Other services" sector, with percentage values ranging between -49.7% (2010-15) and 17.1% (2009-14).
A not too dissimilar picture appears when considering the behaviour for the category "Commerce, hotels and restaurants" whose risk of "bankruptcy" is lower than the "Other services" sector with percentages ranging between -33.8% (2010-15) and -15% (2011-16). "Construction" and "Agriculture" categories have only one significant value. In the cohort 2008-2013, those companies affiliated to the Agriculture sector had a susceptibility to bankruptcy which was lower than "Other services" sector of -34.1%. The hazard rate is different for the companies in the "Construction" sector, which show a greater risk of exit, resulting in + 31.4% in the period 2010-15.
Zone (Control Modality “South and island”)
However, one geographical feature does appear; that of companies based in the "North-Western" of Italy, which have a significant Hazard Ratio across all cohorts. This always results in a risk of exit lower than Southern Italian companies with percentages ranging from -18.9% (2010-15) to -12.9% (2011-16). Furthermore, those companies located in Central Italy have a decrease (-18.5% for the cohorts 2009-14 and -10.1% 2011-16).
Capital (Control Modality “Low”)
By analysing the significant modalities of the Capital variable in all the cohorts it can be clearly ascertained that companies with a Stock Capital defined as High, Medium-High and Medium-Low, in all cases, have a greater risk of exit from the entrepreneurial ecosystem than companies with "Low" Stock capital, by evidencing all stand out + 49.7% of the "High" companies in the 2008-15 cohort and + 20.6% of the "Medium High" companies in the 2011-16 cohort.
Total Asset (Control Modality “Low”)
Evidence also shows that the parametrical estimate of the hazard rate of the significant modalities demonstrates that, without exception and in all cohorts, those companies with a Total Asset defined as "High", "Medium-High" and "Medium-Low" exhibit a lower risk of failure than companies with "Low" Total Assets.
This is especially true when evaluating the risk for companies with "High" Total Asset, which varies from 48.4% (20082011) to -28.2% (2011-16). The 2011-16 cohort, in addition, shows that companies in the category "Medium-High" and "Medium-Low" have a risk rate of bankruptcy of respectively -51,7% and -40.1% over those companies with "Low" Total Asset.
Operating Leverage (Control Modality “Low”)
There is no great significance, in the main, among the modalities of Operational Leverage variable, as a consequence, for this variable; it is not possible to evaluate the risk of exit from entrepreneurial ecosystem over any degree of time.
Financial Leverage (Control Modality “Low”)
By scrutinising significant hazard rates, it is clear that the risk of exit for companies that have Financial Leverage values defined as High, Medium-High and Medium-Low, without exception and present in all cohorts, is lower than for companies with "Low" Financial Leverage.
This tendency is especially true of companies belonging to category: “High” -40,9% (2009-14), -38,3% (2010-15) and -12,5% (2011-16); ”Medium-High” -20,9% (2008-13), -44,7% (2009-14) and -20,7% (2011-16); “Medium-Low” -32,7% (2008-13), -38,6% (2010-15) and -23,1% (2011-16).
Table 4: Cox proportional hazard model (2008-13 and 2009-14)
Cohorts 2008-2013 2009-2014
Variable exponent Pvalue exponent Pvalue
Business sector: Manufacturing 0,6788 0,0000 0,8291 0,0020 Business sector: Commerce,
Hotels, Restaurants 0,8430 0,0039 0,6673 0,0021
Business sector: Constructions 1,1431 0,1140 1,1387 0,2669 Business sector: Agriculture 0,6588 0,0696 0,8797 0,6673 Business sector: Other services
Geographical area: North-West Italy 0,8579 0,0416 0,8692 0,0177 Geographical area: North-East Italy 0,9356 0,4002 1,1736 0,1336 Geographical area: Central Italy 0,9522 0,5254 0,8148 0,0852 Geographical area: South Italy and
Islands
Capital: High 1,4969 0,0005 1,2494 0,0688
Capital: Medium High 1,0918 0,2329 1,0558 0,6084
Capital: Medium Low 1,0444 0,5719 0,8493 0,1606
Capital: Low
Total Asset: High 0,5162 0,0000 0,5802 0,0002
Total Asset: Medium High 0,6015 0,0000 0,6566 0,0016
Total Asset: Medium Low 0,6878 0,0000 0,8367 0,1274
Total Asset: Low
Operating leverage: High 1,0560 0,4905 0,8435 0,1331
Operating leverage: Medium High 0,9416 0,4540 1,0329 0,7579 Operating leverage: Medium Low 1,0710 0,3747 0,8570 0,1682
Operating leverage: Low
Financial leverage: High 0,9781 0,8095 0,5905 0,0000
Financial leverage: Medium High 0,7910 0,0054 0,5530 0,0000 Financial leverage: Medium Low 0,6731 0,0000 1,0457 0,7189
Financial leverage: Low
Likelihood of final solution: -10943,0 - Log-Likelihood of Null model (all ß's=0): -11018,6 - Chi-Square (Null model - final solution): 151,2930 df=19
p=0,00000
Log-Likelihood of final solution: -5399,68 - Log-Likelihood of Null model (all ß's=0): -5458,32 -
Chi-Square (Null model - final solution): 117,2910
df=19 p= ,00000 Table 5: Cox proportional hazard model: estimates for cohorts 2010-15 E 2011-16
Cohorts 2010-2015 2011-2016
Variable exponent Pvalue exponent Pvalue Business sector: Manufacturing 0,5026 0,0000 0,7841 0,0008
Business sector: Commerce,
Hotels, Restaurants 0,6620 0,0001 0,8498 0,0044 Business sector: Constructions 1,3137 0,0102 1,0044 0,9527
Cohorts 2010-2015 2011-2016 Business sector: Agriculture 0,6196 0,1608 1,1045 0,5399 Business sector: Other services
Geographical area: North-West Italy 0,8107 0,0412 0,8712 0,0409 Geographical area: North-East Italy 1,1439 0,2416 1,0348 0,5915 Geographical area: Central Italy 1,1736 0,1631 0,8994 0,0887 Geographical area: South Italy and Islands
Capital: High 1,2545 0,0167 1,2127 0,0084 Capital: Medium High 1,0469 0,6981 1,2057 0,0113 Capital: Medium Low 1,1941 0,0967 0,9889 0,8660
Capital: Low
Total Asset: High 0,9728 0,8442 0,7176 0,0000 Total Asset: Medium High 0,8550 0,2062 0,4831 0,0000 Total Asset: Medium Low 0,7780 0,0588 0,5993 0,0000
Total Asset: Low
Operating leverage: High 1,0675 0,5261 0,9828 0,7920 Operating leverage: Medium High 0,6529 0,0004 0,9176 0,1959 Operating leverage: Medium Low 0,7362 0,0074 1,0831 0,2071
Operating leverage: Low
Financial leverage: High 0,6170 0,0001 0,8754 0,0839 Financial leverage: Medium High 0,8794 0,3047 0,7933 0,0009 Financial leverage: Medium Low 0,6136 0,0000 0,7693 0,0000
Financial leverage: Low
Log-Likelihood of final solution: -5154,48 - Log-Likelihood of Null model (all ß's=0): -5229,98 - Chi-Square (Null model
- final solution): 150,9914 df=19
p=0,00000
Log-Likelihood of final solution: -15688,7 - Log-Likelihood of Null model (all ß's=0): -15795,5 - Chi-Square (Null model - final
solution): 213,6189 df=19 p=0,00000
Conclusion Findings and Research
Perspectives
The findings of the investigation concentrated on the selected variables and the five-year survival rates of Italian companies established with a capital not less than €20,000.00.
RQ1: Young Firms’ Survival and Operational and Financial Risk Rate
The prospects for survival are affected by the level of operational and financial risk faced. Previous studies analysed risk and survival forItalian companies with a share capital not less than €50.000, 00. The results demonstrated that their survivals in the first
5 years of operations were not affected by high operational and financial risk. Findings showed that the percentages of companies with a high operational and financial risk rate, which survived or ceased, were practically identical in all the cohorts under scrutiny. Clearly, such a result depends on The relatively high capitalisation of these companies. As this research examines the five-year survival rates of companies established with a share capital not less than €20,000.00, whilst excluding the scores of micro-enterprises set up with lower capital, thus expanding the sample under observation. Operational risk was quantified by operational leverage, as the ratio between
the annual variation of operating income and the annual variation of revenues.
By using this indicator, it was possible to explain the relation between fixed costs and operational risk rates. Clearly there is greater vulnerability for companies with relatively higher fixed-cost levels and a higher operating risk rate; if sales decrease, operating income decreases disproportionally. However, as there is no significant statistical evidence to correlate operational risk and a company’s five-year survival rates, it can be stated that survival is not significantly affected by a high operational risk rate. Furthermore, the impact of initial level of financial risk on the chances of the young firms to survive five years after their birth was also examined.
Thus, a firm’s financial risk was substituted by the firm’s financial leverage to examine the ratio between total asset and net assets. Since no significant statistical evidence appeared in the correlation between financial risk and companies’ five-year survival rates, it can be argued that survival is not significantly affected by a high financial risk rate, in companies with a relatively high share capital (in this research, by hypothesis, not less than €20,000.00).
When focussing on financial risk, the study has pinpointed how survival rises despite increases in financial risk.
However, such a discrepancy can still be clarified. Those companies operating with high levels of debt, on the one hand, and that are at risk of insolvency, on the other hand, have, however, shown sound prospects of survival by benefitting from the trust of banks and suppliers.
RQ2 and RQ3: Total Assets and Share Capital in Survival of Italian Young Companies
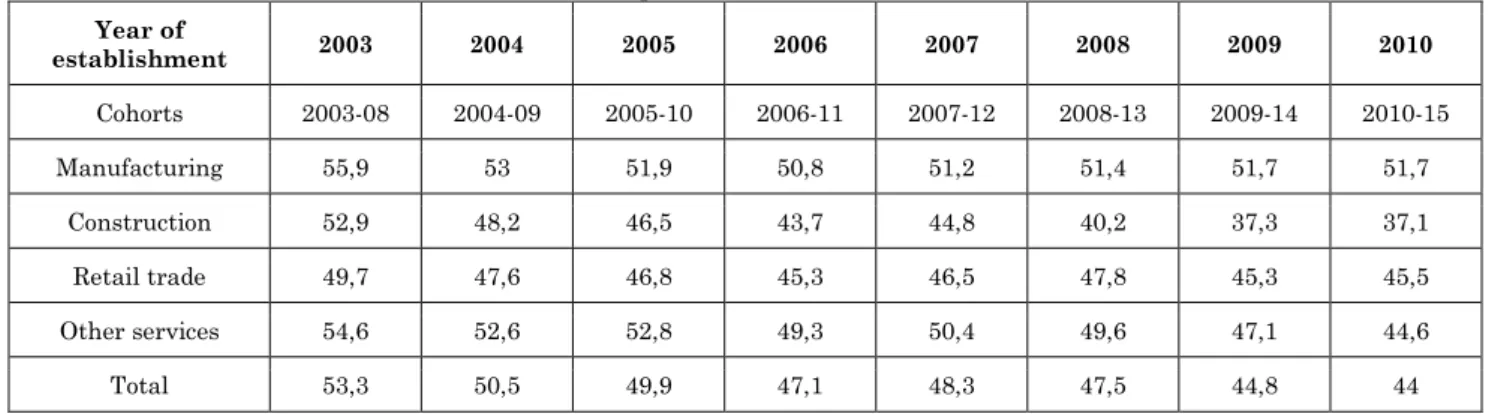
The Italian National Institute of Statistics (ISTAT) calculates annually the survival rates of companies born in Italy (see the following Table 6). Such survival rates cover all companies born in Italy, and also include the countless one-man businesses, which represent more than 60% of the total number of companies incorporated in Italy.
Clearly these micro-enterprises are very fragile with very low survival rates. In 2016, a total of 225,367 out of 363,488 companies born in Italy (62%) belonged to the category of individual enterprises (one-man businesses). When considering the cohorts of companies born between 2003 and 2010, the 5-year survival rates calculated by the Italian National Institute of Statistics demonstrate a low volatility within each sector and vary from a minimum of 37% (the construction sector, which has born the brunt of the consequences of the global crisis) to a maximum of almost 56%.
Table 6: Five-Year survival rates of the Italian companies Year of establishment 2003 2004 2005 2006 2007 2008 2009 2010 Cohorts 2003-08 2004-09 2005-10 2006-11 2007-12 2008-13 2009-14 2010-15 Manufacturing 55,9 53 51,9 50,8 51,2 51,4 51,7 51,7 Construction 52,9 48,2 46,5 43,7 44,8 40,2 37,3 37,1 Retail trade 49,7 47,6 46,8 45,3 46,5 47,8 45,3 45,5 Other services 54,6 52,6 52,8 49,3 50,4 49,6 47,1 44,6 Total 53,3 50,5 49,9 47,1 48,3 47,5 44,8 44
Source: Italian National Statistics Institute (ISTAT)
This research only considered survival rates for companies with a share capital not less than €20,000.00. The resulting data shows much higher five-year survival rates than those calculated by the Italian National Institute of Statistics, ranging from a maximum of 92% (2008-2013 cohort) to a minimum of 74% (2011-2016 cohort).
Notwithstanding such a profound reduction in these rates over time, a direct consequence of the global financial crisis, the survival rates over five years remained higher than the Italian National Institute of Statistics calculations regarding levels for all companies born (see the following Table 7).
The previous sections demonstrated that larger companies are less vulnerable than their smaller counterparts in the first stage of life, which this research establishes, thus
confirming the narrative; that five-year survival rates increase as the size of capital invested increases.
Table 7: The survival rates of Italian companies measured in this research
Cohorts companies Observed companies Surviving companies Ceased Five-year survival rates Five-year death rates Total %
2008-2013 7.896 7.271 625 92,08% 7,92% 100,00
2009-2014 7.166 6.506 660 90,79% 9,21% 100,00
2010-2015 8.174 6.859 1.315 83,91% 16,09% 100,00
2011-2016 7.376 5.471 1.905 74,17% 25,83% 100,00
These high five-year survival rates are uniform, mirroring in similarity those gained from previous research on the survival of Italian companies with a share capital not less than €50,000.00. For the three cohorts scrutinised for companies born in Italy in 2009, in 2010 and 2011, the five-year survival rates were 93.45%, 92.74% and 82.78% respectively.
The aim of targeting significant results meant that the survey was limited to companies with a share capital not less than €20,000.00. As previously stated, one-man businesses were excluded from this research; the reason being their micro-nature renders them indistinguishable from the entrepreneur or director, a criterion that cannot be institutionalised.
Consequently, a host of very small economic entities, such as, crafts-workers, farmers, self-employed workers and other professional figures are considered unrepresentative in this research, however, the survival and cessation of these micro-enterprises is inextricably linked to subjective factors and the personality of the entrepreneurs. Clearly any inclusion in this research would have given them equal "weight" to large companies, which would have prejudiced the results, with a consequential distortion of the results obtained.
The companies under investigation were classified into four groups on the basis of their equity holding as the five-year survival rates of companies decrease with the growth of equity. However, such evidence, when singularly considered, is inconsequential as it gives no consideration to the percentage weight of equity on investments in total assets.
In addition, such a result is at odds with the previously reported positive correlation between survival rates and total assets of companies; therefore, such an inconsistency becomes apparent.
However, by correlating this evidence with the previously described positive correlation between high indebtedness and five-year business survival, it may be argued that, those companies constituted with equity of not less than €20,000.00, the five-year survival expectations may grow as increased investments in total assets, even if they finance their investments mainly through debts. Accordingly, the positive the survival of newly established companies is evident given the positive effects of leverage.
Therefore, the high mortality of micro-enterprises in the first five years of life most likely depends on a lack of liquidity, due to low equity. Cash is depleted quicker and before economic equilibrium is reached. Equity, therefore, plays a crucial role in the survival of these young companies in their first 5 years of life.
RQ4 and RQ5: Business Sector and Geographical Area in Survival of Young Italian Companies
Survival rates of companies operating in different sectors endure to a higher extent. However, these differences disappear when measuring the 5-year survival rates of all companies as a whole, as they tend to compensate each other. One of the aims of this research was to verify whether the sectors are characterised by similar or different survival rates. This study exhibit that Italian companies included in macro-sectors "Industry in the strict sense"
and "Commerce, hotels and restaurants" show greater survive probability than those operating in the "Other services" sector. “Construction” suffers far higher mortality rates than other sectors.
The divided geographical nature of Italy with a strong North-South economic divide: the northern and central regions are economically advanced compared to their southern counterparts. Furthermore, the economic environment can boost or impede the survival of companies. Hence, a company born in an economically developed area can benefit from a higher demand for goods, but it can suffer the effects of higher competition. This research demonstrated that, in all the cohorts, young enterprises from central and northern Italy are significantly less vulnerable than those in southern Italy. They are generally able to exploit operations in better developed business environment to a
greater extent than the disadvantage resulting from a fiercer competition.
Research Perspectives
This paper examined variables that may influence a company’s survival in the first years of life, such as: operational and financial risks, total assets, share capital, business sector and geographical area. The empirical evidence was obtained by observing the five-year survival rates of Italian companies founded with relatively large dimensions, in terms of share capital (not less than €20,000.00).
Here lies the starting line for any future research aimed at calculating the effects of various influential variables on business survival concurrently. Such an analysis could also benefit from the comparison between the evidence of this study and similar research carried out on young companies from other countries.
References
1. Stinchcombe AL (1965) Social structure and organizations, in: March, J.P., (Ed.), Handbook of organizations (Chicago: Rand McNally). 2. Strotmann H (2007) Entrepreneurial survival,
Small Business Economics, 28(1):87-104. 3. Fackler D, Schnabel C, Wager J (2012)
Establishment exits in Germany: the role of size and age, Small Business Economics, 41(3): 683-700.
4. Hall BH (1987) the relationship between firm
size and firm growth in the U.S.
manufacturing sector, The Journal of
Industrial Economics, 35(4):583-606.
5. Evans DS (1987) the relationship between firm growth, size and age: estimates for 100 manufacturing industries, The Journal of Industrial Economics, 35(4):567-581.
6. Dun and Bradstreet (1988) Business failure record: 1986 final/1987 preliminary. (New York: Dun and Bradstreet Corporation).
7. Dunne T, Roberts MJ, Samuelson L (1989) the growth and failure of U.S. manufacturing plants, The Quarterly Journal of Economics, 104(4):671-698.
8. Knaup AE (2005) Survival and longevity in the business employment dynamics data, Monthly Labor Review, 50-56.
9. Knaup AE, Piazza MC (2007) Business Employment Dynamics Data: Survival and Longevity, Monthly Labor Review, 3-10.
10. Nicolò D (2015) Towards a theory on corporate reputation and survival of young firms, in 2nd International Conference “Economic Scientific Research - Theoretical, Empirical and Practical Approaches, ESPERA 2014, 13-14 November
2014, Bucharest, Romania, Procedia
Economics and Finance, 2212-6671, Elsevier B.V, 296-303.
11. Nicolò D, Ferrara N (2015) Corporate reputation, business plan and start-up sustainability, in Nicolò D. (Ed.) Startups and start-up ecosystems: Theories, models and case studies in the Mediterranean area (Craiova, Romania: ASERS Publishing, University of Craiova Printing House).
12. Nicolò D (2017) Young firms’ sustainability and corporate reputation: A comparison of the survival rates in the US and EU, in Vasile Andrei J., Nicolò D. (eds.) Sustainable entrepreneurship and investments in the green economy (Hershey Pa USA: IGI Global).
13. Damodaran A (2009) Valuing young, start-up and growth companies: Estimation issues and Valuation Challenges (Stern School of Business, New York University).
14. Aldrich HE, Auster E (1986) even dwarfs started small: Liabilities of size and age and their strategic implications, Research in Organizational Behaviour, 8:165-198.
15. Esteve-Pérez S, Sanchis Llopis A, Llopis JA (2004) The determinants of survival of Spanish
manufacturing firms, Review of Industrial Organization, 25(3):251-273
16. Cefis E, Marsili O (2006) Survivor: The role of innovation in firms’ survival, Research Policy, 35:626-641.
17. Abowd JM, Mckinney KL, Vilhuber L(2009) The link between human capital, mass layoffs and firm deaths, in T. Dunne, J.B. Jensen & M.J. Roberts (Eds.), Producer dynamics-new evidence from micro data. (Chicago: University of Chicago Press) 447-472.
18. Carreira C, Silva F (2010) No deep pockets: Some stylized empirical results on firms’ financial constraints, Journal of Economic Surveys, 24:731-753.
19. Ansoff HI, Avner J, Brandenburg R, Portner F, Radosevich R (1970) does planning pay? The effect of planning on success of acquisition in American firms, Long Range Planning, 3(2):2-7.
20. Bracker J, Keats B, Pearson J (1988) Planning and financial performance among small firms in a growth industry, Strategic Management Journal, 9:591-603.
21. Bracker J, Pearson J (1986) Planning and financial performance of small, mature firms, Strategic Management Journal, 7:503-522 22. Grinyer P, Al-Bazzaz S, Yasai-Ardekani M
(1986) towards a contingency theory of corporate planning: Findings in 48 U.K. companies, Strategic Management Journal, 7:3-28.
23. Ramanujam V, Venkatraman N, Camillus J
(1986) Multi-objective assessment of
effectiveness of strategic planning: A discriminant analysis approach, Academy of Management Journal, 29: 347-372.
24. Haswell S, Holmes S (1989) Estimating the small business failure rate: A reappraisal, Journal of Small Business Management, 27:68-74.
25. Venkataraman S, Van De Ven AH, Buckeye J, Hudson R (1990) starting up in turbulent environment: A process model of failure among firms with high customer dependence, Journal of Business Venturing, 5:277-296.
26. Buttà C (1995) La genesi dell'impresa (Milano, FrancoAngeli).
27. Buttà C (2003) Elementi per una
concettualizzazione Del processo genetico, Sinergie, 61(62):71-95.
28. Davis A, Olson Eric M (2008) Critical competitive strategy issues every entrepreneur should consider before going into business, Business Horizons, 51(3):211-221.
29. Nicolò D (2011) Caratteristiche generali delle imprese e del vertice imprenditoriale, Grado di
evoluzione del sistema informativo e dissesto: Evidenze di un'indagine empirica, in M. Ferro, P. Bastia e Giacomo M. Nonno (Eds.), L'accertamento del passivo. Procedimento di verifica dei crediti, Giudizi di impugnazione e questioni critiche: i risultati di una ricerca sui fallimenti italiani (Milano: IPSOA, Gruppo Wolters Kluvers).
30. Nicolò D, Nania I (2017) Risk, capitalization and survival of young firms: Empirical survey on Italian companies, Key Note Address at 3rd Dubrovnik International Economic Meeting DIEM 2017, Managing Business Growth in a
Volatile Environment, University of
Dubrovnik, Dept. of Economics and Business Economics, October 12-14th 2017, Dubrovnik, Croatia, 3-23.
31. Nicolò D (2018) Carenze informative e vulnerabilità delle imprese giovani. Il ruolo del business plan, Management Control, 2, Special Issue, 37-52.
32. Santarelli E, Klomp L, Thurik RA (2006) Gibrat’s Law: An overview of the empirical
literature, in E. Santarelli (Ed.),
Entrepreneurship, growth, and innovation (New York: Springer) 41-73.
33. Geroski PA, Mata J, Portugal P(2010) Founding conditions and the survival of new firms, Strategic Management Journal, 31:510-529
34. Child J (1972) Organization structure, environment and performance: The role of strategic choice, Sociology, 6:2-22.
35. Kirzner IM (1979) Perception opportunity and profit (Chicago: University of Chicago Press). 36. Carland JW, Hoy F, Boulton WR, Carland
JAC(2007) Differentiating entrepreneurs from small business owners: A conceptualization. in Entrepreneurship (Berlin, Heidelberg: Springer) 73-81.
37. The Academy of Management Review (1984), 9 (2):354-359.
38. Gartner WB(1985) A Conceptual framework for describing the phenomenon of new venture creation, Academy of Management Review, 10(4):696-706
39. Katz JA, Gartner WB (1988) Properties of
emerging organization, Academy of
Management Review, 13 (3):429-441.
40. Miles RE, Snow CC, Meyer AD, Coleman H Jr(1988) Organizational strategy, structure and process, in Quinn J.B., Mintzberg H., James R.M., The strategy process (Englewood Cliffs, N.J: Prentice-Hall Inc).
41. Storer DJ (1988) Entrepreneurship and new firm (Routledge).
42. Shaver K, Scott L (1991) Person, process, choice: The psychology of new venture creation, Entrepreneurship: Theory and Practice, 16(2):23-45.
43. Åstebro T, Bernhardt I (2003) Start-up financing, owner characteristics, and survival, Journal of Economics and Business, 55:303-319.
44. Birley S (1989) Female entrepreneurs: Are they really different? Journal of Small Business Management, 27 (1):32-37.
45. Brush CG (1992) Research of women business owners: Past trends, a new perspective and future directions, Entrepreneurship: Theory and Practice 16 (4):5-30.
46. Weick KE (1972) the social psychology of organizing (New York: Random House).
47. Sandberg WR (1986) new venture
performance: The role of strategy and industry structure (Lexington, MA: Lexington Books). 48. Bird BJ (1993) Demographic approaches to
entrepreneurship: The role of experience and background. Advances in Entrepreneurship, Firm Emergence, and Growth, 1:11-48.
49. Chandler GN, Hanks SH (1994) Founder competence, the environment and venture performance. Entrepreneurship: Theory and Practice, 18 (3):77-90.
50. Rasmussen EA, Sǿrheim R (2006) Action-based entrepreneurship education, Technovation, (26):185-194.
51. Brockhaus RH (1980) Risk taking propensity of entrepreneurs, Academy of Management Journal, 23 (3):509-520.
52. Cressy R (2006) why do most firms die young? Small Business Economics, 26:103-116
53. Cacciotti G, Hayton JC (2015) Fear and entrepreneurship: A review and research agenda, International Journal of Management Reviews, 17 (2):165-190.
54. Cacciotti G, Hayton JC, Mitchell JR, Giazitzoglu A (2016) A reconceptualization of fear of failure in entrepreneurship, Journal of Business Venturing, 31 (3):302-325.
55. Kollmann T, Stöckmann C, Kensbock Julia M (2017) Fear of failure as a mediator of the relationship between obstacles and nascent entrepreneurial activity-An experimental approach, Journal of Business Venturing, 32:280-301.
56. Brockhaus RH, Horwitz PS(1986) The psychology of the entrepreneur, in D.L. Sexton and R.W. Smilor, (Eds.), The Art and the Science of Entrepreneurship (Cambridge, MA: Ballinger)25-48.
57. Gatewood J, Shaver KS, Gartner WB (1995) A longitudinal cognitive factors influencing start-up behaviours and success at venture creation, Journal of Business Venturing, 10:371-391. 58. Gartner WB (1988) who is an entrepreneur? Is
the wrong question, American Journal of Small Business 12(4):11-32.
59. Bygrave WD (1989) the entrepreneurship paradigm (II): Chaos and catastrophes among quantum jump, Entrepreneurship: Theory and Practice, 14 (2):7-30.
60. Timmons J (1990) new venture creation, 3rd ed. (Homewood, IL: R.D. Irwin).
61. Vesper KH (1990) new venture strategies (Englewood Cliffs, NJ: Prentice Hall).
62. Longsworth EK (1991) the anatomy of a start-up (Boston: Inc. Publishing).
63. Van De Ven AH, Poole MS (1995) Explaining development and change in organizations, Academy of Management Review, 20 (3):510- 540.
64. Carter N, Gartner B, Reynolds P(1996) Exploring start-up event sequences, Journal of Business Venturing,11 (3):151-166.
65. Van De Ven AH, Engleman RM (2004) Event-
and outcome-driven explanations of
entrepreneurship, Journal of Business
Venturing, 19:343-358.
66. Delmar F, Shane S (2002) What firm founders do: A longitudinal study of the startup process, in William D. Bygrave, Candida G. Brush, Per Davidsson, & James Fiet (Ed.), Frontier of Entrepreneurship Research, (Babson Park, MA: Babson College).
67. Liao J, Welsch H, Wee-Liang Tan (2005)
Venture gestation paths of nascent
entrepreneurs: Exploring the temporal
patterns, Journal of High Technology Management Research, 16:1-22.
68. Nicolò (2013) Monitoraggio delle sequenze e risultati aziendali, Management Control, 3:35-50.
69. Mintzberg H (1973) the nature of managerial work (New York: Harper & Row).
70. Dubini P, Schillaci CE (1988) L’influsso delle variabili ambientali nella decisione di avviare una nuova impresa, in G. Lorenzoni, A. Zenoni (eds.), Gli studi sull’imprenditorialità in Italia, (Roma: Bulzoni,) 80-110.
71. Moore JF (2006) Business ecosystems and the view from the firm, The Antitrust Bulletin, 51 (1):31-75.
72. Adner R, Kapoor, R (2010) Value creation in innovation ecosystems: How the structure of technological interdependence sffects firm
performance in new technology generations, Strategic Management Journal, 31:306-333. 73. Moss Kanter R (2012) Can America competes?
Strategies for economic revival, Harvard Magazine.
74. Biggadike RC (1976) corporate diversification: Entry, strategy and performance (Cambridge, MA: Harvard University Press).
75. Miller A, Camp B (1985) Exploring determinants of success in corporate ventures, Journal of Business Venturing, 1:87-105. 76. Cooper AC, GE Willard, CY Woo (1986)
Strategies of high-performing new and small firms: A re-examination of the niche concept, Journal of Business Venturing, 1 (3):247-260. 77. Cooper AC (1993) Challenges in predicting new
firm performance, Journal of Business Venturing, 8 (3):241-254.
78. Sandberg WR (1986) new venture
performance: The role of strategy and industry structure (Lexington, MA: Lexington Books). 79. McDougall P, Robinson, Jr R, De Nisi A (1992)
Modelling new venture performance: An analysis of new venture strategy, Industry structure, and venture origin. Journal of Business Venturing. 7:267-289.
80. Chang SJ (2004) Venture capital financing, strategic alliances and the initial public offering of Internet startups. Journal of Business Venturing, 19 (5):721-741.
81. Cannice MV (2004) Getting in on the university business plan competition circuit, Entrepreneur.com, Oct.
82. Wen CT, Chen YW (2007) the innovation process of entrepreneurial teams in dynamic business plan competition: from sense-making
perspective, International Journal of
Technology Management, 39 (3/4):346-363. 83. Russell R, Atchison M, Brooks R (2008)
Business plan competitions in tertiary institutions: Encouraging entrepreneurship education. Journal of Higher Education Policy and Management, 30 (2):123-138.
84. Bell J (2010) Student business plan competitions: Who really does have access? In Small Business Institute National Conference Proceedings, 34 (1):18-25.
85. Ross LW, Byrd KA (2011) Business plan competitions: Start-up “idols” and their twenty-first century launch pads, Journal of Higher Education Theory and Practice, 11 (4):53-64.
86. Ruisi M (2015) the role of business competitions in the processes of defining and launching a new venture. Cases of companies involved in the “Start Cup” Palermo and grown inside the academic incubator ARCA, in Nicolò D. (Ed.) Startups and start-up ecosystems: Theories, models and case studies in the Mediterranean area (Craiova, Romania: ASERS Publishing, University of Craiova Printing House,).
87. Dagnino G (2015) the academic incubator as a fluid mosaic: An ecological interpretative framework, in Nicolò D. (Ed.) Startups and start-up ecosystems: Theories, models and case studies in the Mediterranean area (Craiova, Romania: ASERS Publishing, University of Craiova Printing House).
88. Cox DR (1975) Partial likelihood, Biometrika, 62 (2):269-276.
89. Lancaster T (1979) Econometric methods for duration of unemployment, Econometrical, 47:939-56.
90. Lancaster T (1990) the analysis of transition data (New York: Cambridge University Press). 91. Heckman JJ, Singer B (1984) A method for
minimizing the impact of distributional assumptions in economic model for duration data, Econometrica, 52:271-320.
92. Kaplan EL, Meier P (1958) Nonparametric
estimation from incomplete
observations, Journal of American Statistical Association, 53(282):457-481
93. Bland KM, Altman DG (2004) the log rank test. British Medical Journal, 328:7447-1073. 94. Gehan EA, Thomas DG (1969) the performance
of some two-sample tests in small samples with and without censoring, Biometrika, 56:127-32.
95. Tarone RE, Ware J (1977) on distribution-free tests for equality of survival distributions. Biometrika, 64:156-160.