Squalene epoxidase is a bona fide
oncogene by amplification with
clinical relevance in breast cancer
David N. Brown
1,*, Irene Caffa
2,*, Gabriella Cirmena
2, Daniela Piras
2, Anna Garuti
2,
Maurizio Gallo
2, Saverio Alberti
3, Alessio Nencioni
2,4, Alberto Ballestrero
2,4&
Gabriele Zoppoli
2,4SQLE encodes squalene epoxidase, a key enzyme in cholesterol synthesis. SQLE has sporadically been reported among copy-number driven transcripts in multi-omics cancer projects. Yet, its functional relevance has never been subjected to systematic analyses. Here, we assessed the correlation of SQLE copy number (CN) and gene expression (GE) across multiple cancer types, focusing on the clinico-pathological associations in breast cancer (BC). We then investigated whether any biological effect of SQLE inhibition could be observed in BC cell line models. Breast, ovarian, and colorectal cancers showed the highest CN driven GE among 8,783 cases from 22 cancer types, with BC presenting the strongest one. SQLE overexpression was more prevalent in aggressive BC, and was an independent prognostic factor of unfavorable outcome. Through SQLE pharmacological inhibition and silencing in a panel of BC cell lines portraying the diversity of SQLE CN and GE, we demonstrated that SQLE inhibition resulted in a copy-dosage correlated decrease in cell viability, and in a noticeable increase in replication time, only in lines with detectable SQLE transcript. Altogether, our results pinpoint SQLE as a bona fide metabolic oncogene by amplification, and as a therapeutic target in BC. These findings could have implications in other cancer types.
The gene SQLE, found on chromosome 8q24.13 in humans1–3, encodes squalene epoxidase, one of the key enzymes in the later stages of cholesterol synthesis3–7. SQLE catalyzes the oxidation of squalene to 2,3-oxidosqualene5,6,8, downstream HMG-CoA reductase (HMGCR), the target of the statin class of cholesterol-lowering agents9. SQLE expression is almost ubiquitous in humans, with higher levels in skin, gastrointestinal mucosa, and central nerv-ous system, and lower expression in skeletal muscle10. SQLE homologs can be found in several eukaryotic organ-isms. Indeed, fungal squalene epoxidase is inhibited by antimycotic agents, in use either topically or by oral administration since the 1990s (reviewed in11). Of interest, some of those drugs also block the activity of SQLE at high concentrations in in vitro models12,13. Several investigators actively pursued the development of potent, selective human SQLE inhibitors as a feasible way to lower cholesterol14–16. However, the description of potential side effects such as skin rash18 or peripheral demyelination19 in animal models and the widespread adoption and efficacy of statins17 halted the clinical development of SQLE inhibitors and their use in humans11,20: this happened in a possibly premature way and in spite of promising results21. As a consequence, the interest in SQLE-targeted drug development progressively faded in later years, and to our knowledge, no clinical study has been conducted to this day.
With the advent of –omics technologies and high-dimensional cancer multilayered analyses (exemplified by22), several works were published, identifying cancer genes with a potential for copy-number (CN) driven over-expression. In breast cancer, research results highlighted the high correlations between CN and gene expression (GE) of unsuspected and widely known oncogenes by amplification, such as ERBB2 (coding the ERBB2 protein, also known as Her2) and MYC23–31. Scarce interest was dedicated, however, to the not infrequent appearance of
SQLE among the top CN-GE correlating genes in several of those works (e.g., in23,24,26,30). This was possibly due to SQLE relative proximity to MYC2, and to the then-prevailing focus on aberrations in the targetable kinome, 1J.-C. Heuson Breast Cancer Translational Research Laboratory, Institut Jules Bordet, Brussels BE. 2Department of Internal Medicine (Di.M.I.), University of Genova, Genova IT. 3Unità di Patologia Oncologica CeSI, Università “G. D’Annunzio”, Chieti Scalo (Chieti) IT. 4Istituto di Ricovero e Cura a Carattere Scientifico Azienda Ospedaliera-Universitaria San Martino and National Cancer Institute, Genova IT. *These authors contributed equally to this work. Correspondence and requests for materials should be addressed to G.Z. (email: [email protected]) Received: 07 September 2015
Accepted: 11 December 2015 Published: 18 January 2016
a major topic of oncological research in the 2000s32. Few articles from mid-size datasets described the potential role of SQLE overexpression in the definition of a prognostically unfavorable stage I-II estrogen receptor positive (ER+ ) breast cancer subgroup33 or in Afro-American luminal-A breast cancer patients34, and the identification of clusters of breast tumors characterized, among other alterations, by SQLE CN amplification and overexpression25, or by its aberrant methylation and expression patterns in concomitance with MYC amplification35. No further systematic, large-scale effort was however undertaken as a follow-up of those isolated observations.
In the present work, we set up to exhaustively analyze the correlation of SQLE CN and GE across multiple cancer histological types, Here, we provide the first, systematic, large-scale assessment of the prevalence and interaction of SQLE CN amplification with its GE variation in breast cancer and other tumor types in humans. We subsequently focused our efforts on the association of clinical and pathological factors with SQLE in breast cancer as well as on the potential prognostic relevance of SQLE in that disease. Finally, we investigated whether any biological effect of SQLE inhibition could be demonstrated from experiments performed in thoroughly char-acterized breast cancer cell line models.
Results
SQLE gene expression shows a high correlation with its locus copy number in breast
can-cer.
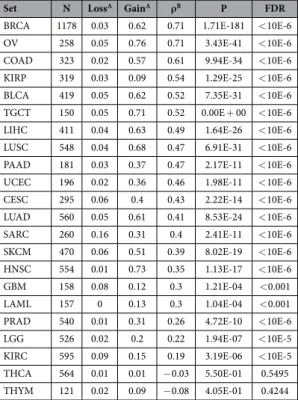
To systematically assess which cancer histotypes showed an association between chromosome 8q24.13 locus CN, where SQLE resides1,2, and SQLE gene expression, we analyzed publicly avaimlable data generated by The Cancer Genome Atlas (TCGA), limiting our study to 22 cancer types with at least 100 assessed patients (n = 8,783 cases, see Table 1), and with available SNP6 arrays and RNA-sequencing data. Gains at the SQLE locus, defined according to the GISTIC2.0 algorithm36,37, presented the highest frequency in ovarian cancer and the lowest in glioblastoma multiforme (76% and 12% of affected patients respectively, see Fig. 1A, leftmost panel). 62% of breast cancer patients were characterized by gains at the SQLE locus. After correction for multiple testing, we found that 20 of the 22 cancer sets still presented a positive association between SQLE locus CN and SQLE GE, with a false discovery rate (FDR) < 0.001 (see Fig. 1A, rightmost panel). However, only breast, ovarian, and colorectal cancers showed a large effect size38 for that association, with breast cancer presenting the strongest correlation (ρ = 0.71, see Fig. 1C top left) since it also represented the largest TCGA dataset, with 1,178 collected cancer specimens. Ovarian cancer had a similar SQLE CN-GE correlation coefficient (ρ = 0.71, see Fig. 1D top left), followed by colorectal cancer with ρ = 0.61. Taken together, these data suggest that SQLE CN may have a tissue-dependent role in contributing to the variability of SQLE GE, and that breast and ovarian cancers show the tightest correlation between those two parameters. As a comparison, it is worth noting that a prototypical oncogene driven by copy number amplification, ERBB2, shows a ρ = 0.63 in the same TCGA breast cancer dataset where SQLE was assessed.SQLE and MYC are transcriptionally independent in breast and ovarian cancer, albeit residing
in close proximity on chromosome 8.
Since its cloning and characterization39, MYC has been one ofSet N LossA GainA ρB P FDR
BRCA 1178 0.03 0.62 0.71 1.71E-181 < 10E-6 OV 258 0.05 0.76 0.71 3.43E-41 < 10E-6 COAD 323 0.02 0.57 0.61 9.94E-34 < 10E-6 KIRP 319 0.03 0.09 0.54 1.29E-25 < 10E-6 BLCA 419 0.05 0.62 0.52 7.35E-31 < 10E-6 TGCT 150 0.05 0.71 0.52 0.00E + 00 < 10E-6 LIHC 411 0.04 0.63 0.49 1.64E-26 < 10E-6 LUSC 548 0.04 0.68 0.47 6.91E-31 < 10E-6 PAAD 181 0.03 0.37 0.47 2.17E-11 < 10E-6 UCEC 196 0.02 0.36 0.46 1.98E-11 < 10E-6 CESC 295 0.06 0.4 0.43 2.22E-14 < 10E-6 LUAD 560 0.05 0.61 0.41 8.53E-24 < 10E-6 SARC 260 0.16 0.31 0.4 2.41E-11 < 10E-6 SKCM 470 0.06 0.51 0.39 8.02E-19 < 10E-6 HNSC 554 0.01 0.73 0.35 1.13E-17 < 10E-6 GBM 158 0.08 0.12 0.3 1.21E-04 < 0.001 LAML 157 0 0.13 0.3 1.04E-04 < 0.001 PRAD 540 0.01 0.31 0.26 4.72E-10 < 10E-6 LGG 526 0.02 0.2 0.22 1.94E-07 < 10E-5 KIRC 595 0.09 0.15 0.19 3.19E-06 < 10E-5 THCA 564 0.01 0.01 − 0.03 5.50E-01 0.5495 THYM 121 0.02 0.09 − 0.08 4.05E-01 0.4244
Table 1. TCGA cancer sets and SQLE CN/GE. ASQLE fraction of losses and gains defined by GISTIC 2.0. BSpearman’s correlation coefficient. Full definitions of the TCGA acronyms can be found at https://tcga-data. nci.nih.gov/tcga.
the most studied cancer-related genes. It is physically located on chromosome 8q24.21, the cytoband imme-diately adjacent to the SQLE locus, towards the telomeric end2. We therefore explored MYC and SQLE associ-ations in terms of GE and CN in the breast and ovarian cancer TCGA datasets (see Supplementary Table S1 and Supplementary Fig. S1 online). Although almost invariably SQLE and MYC loci presented identical or near similar log2 ratio values (ρ = 0.96 in breast cancer and 0.89 in ovarian cancer, see Fig. 1C,D bottom right), SQLE and MYC transcripts were not correlated with each other (see Fig. 1C,D bottom left). Moreover, MYC showed a much lower CN-GE correlation coefficient than SQLE in both breast and ovarian cancers (ρ = 0.11 in breast cancer and 0.40 in ovarian cancer, see Fig. 1C,D top right). These observations may imply that the locus, spanning chromosome 8q23.13-q24.21 is a strong driver for SQLE expression in breast and ovarian cancer, explaining a relevant proportion of its variability across samples, whereas possibly other variables, in addition to copy dosage, may concur in determining MYC transcriptional levels in those two cancers. Finally, MYC transcript does not seem to behave as a transcriptional driver of SQLE expression in breast and ovarian cancer, as anticipated by the absence of MYC promoter elements upstream of SQLE40.
SQLE is overexpressed in clinically aggressive breast cancer.
To explore the associations of SQLE expression with classical clinical and pathological variables in breast cancer, i.e. age, tumor size, number of Figure 1. Correlation of SQLE copy number and gene expression is highest in breast and ovarian cancers. All cancer histotypes with at least 100 cases collected by the TCGA were assessed for the presence of SQLE copy number gains and losses (blue and orange respectively, left bar chart (A), and log2 ratios were correlated with normalized SQLE gene expression using the Spearman’s correlation coefficient (ρ value on the x-axis, decreasing from highest to lowest, right bar chart (A). SQLE copy number/gene expression correlation was invariably higher than for MYC, which is physically closely located on chromosome 8q, in both breast (topmost panels, (B) and ovarian cancer (topmost panels, (C). Moreover, SQLE and MYC gene expression values were not correlated in those cancer types (bottom left B and C), whereas copy number values were almost identical due to the aforementioned chromosomal proximity (bottom right B and C). Topmost y-axes and bottom left x- andy-axes C and D: normalized log2 gene expression intensity. Bottom right x- and y-axes C and D: log2 ratios for
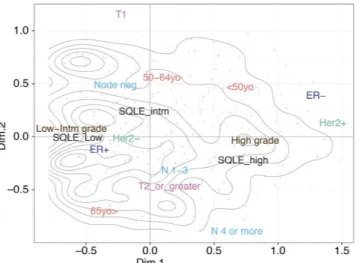
positive lymph nodes (NPLN), histological grade, ER and Her2 status, we took advantage of the data generated by METABRIC, currently the single largest clinically annotated CN and GE breast cancer dataset publicly available31. Using multiple correspondence analysis (MCA), a multivariate statistical method similar to principal component analysis, but suited for categorical data41, we reduced our variables of interest to two dimensions, explaining the largest fraction of the variance characterizing the factors we considered from the METABRIC data. Clinical and pathological variables together with SQLE expression levels were projected as vectors in a space defined by those two dimensions (see Fig. 2). The position of the variable categories in this two-dimensional space reflects their mutual associations, with no a priori assumption on the underlying structure of the data. We observed that ele-vated SQLE expression lay in close proximity with high histological grade, and in the same spatial region where positive nodal status and larger (T2 or greater) T size were positioned. On the other hand, low SQLE expression clustered together with low/intermediate grade, ER + and Her2- status. Overall, this implies that patients devel-oping less aggressive, ER+ , Her2- breast cancer have lower SQLE expression levels, whereas aggressive tumors are more often characterized by high SQLE transcript values.
High grade and Her2 + status are highly associated with SQLE overexpression.
By univaria-ble linear regression, we confirmed the associations observed by MCA. In particular, ER + status was positively associated with low SQLE expression (Δ log2 expression = − 0.36, 95% CI = − 0.45–− 0.26, P = 5 × 10⁻¹³), as were smaller tumors (Δ log2 expression = − 0.13, 95% CI = − 0.21–− 0.04, P = 0.0032). On the other hand, we found a significant association of elevated SQLE levels with high-grade tumors (Δ log2 expression = 0.51, 95% CI = 0.43–0.58, P < 2 × 10⁻¹⁶), node positive cancers (Δ log2 expression for NPLN greater or equal 4 vs. 0 = 0.17, 95% CI = 0.04–0.31, P = 0.0086 and NPLN 1–3 vs. 0 = 0.14, 95% CI = 0.03–0.24, P = 0.0072, overall P = 0.0011), and Her2 + neoplastic malignancies (Δ log2 expression = 0.41, 95% CI = 0.30–0.54, P = 1.7 × 10⁻¹¹). The larg-est effect sizes for those associations could be observed for histological grade and Her2 status, which indeed remained independently significantly associated with SQLE GE in a multivariable linear regression model includ-ing all the aforementioned clinical and pathological parameters (see Table 2). In summary, by both MCA analysis and classical statistical tests we could demonstrate that, in breast cancer, high SQLE GE characterizes clinically aggressive tumors (higher grade, larger size, and positive nodal status ones), and that SQLE tends to be overex-pressed in Her2 + and ER- cases.CN alterations in the SQLE-MYC locus denote a poorer outcome in breast cancer.
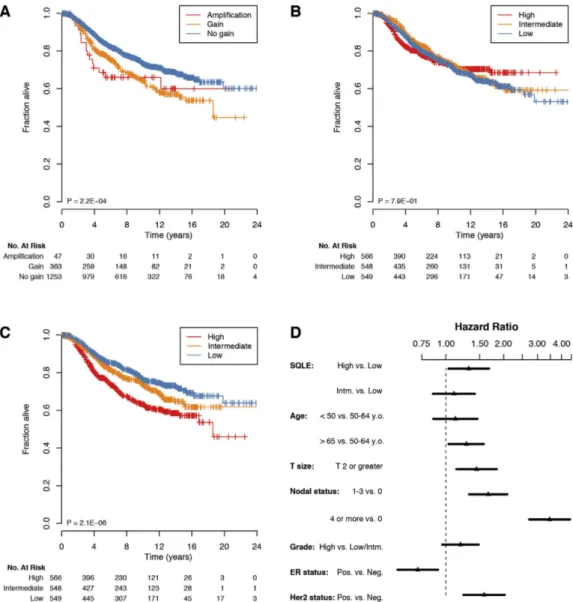
We subse-quently assessed the prognostic value of chromosome 8q24.13-q24.21 CN alterations in the METABRIC dataset. Due to the extremely high correlation of SQLE and MYC log2 ratio values in this set (ρ = 0.93), we used the mean of log2 ratios for those two regions as a proxy for the CN status of chromosome 8q24.13-q24.21. Alterations at this locus purported a poor prognosis in breast cancer, with a significantly shorter overall survival in patients carrying CN gains or, with an even higher hazard ratio, amplifications (HR for gains = 1.51, 95% CI = 1.22– 1.86, P = 0.0002; HR for amplifications = 1.67, 95% CI = 1.01–2.77, P = 0.0447; overall log-rank P = 0.0002, see Fig. 3A).Figure 2. Multiple correspondence analysis (MCA) defines the structure of clinical and pathological associations with SQLE gene expression in breast cancer. x- and y-axes represent the first and second dimension (Dim.1 and Dim.2) of the MCA analysis performed on clinical and pathological data, as well as
SQLE expression, from 1,663 breast cancer patients reported in the METABRIC dataset. The contour lines
display areas of similar sample density, with smaller circles representing peaks in such density. Grey dots represent individual patients, with darker shades indicating more data points falling in the same MCA region. Variable categorical levels are automatically positioned according to their correlations with such dimensional reduction vectors and with each other. In particular, patients with high-grade tumors also show low SQLE expression levels (bottom right region), whereas the cluster of patients with SQLE low expresser tumors is also characterized by low and intermediate (Low/Intm) grade, Her2-, ER + cancers (center left region).
Variable Odds Ratio 95% CIA P
Age < 50 vs. 50–64 years old 1.01 0.91–1.13 0.8571 65 or > vs. 50–64 years old 0.99 0.90–1.08 0.7183 T size T2 or > vs. T1 1.07 0.99–1.17 0.0889 ° NPLN 1–3 vs. 0 1.08 0.99–1.17 0.0895 ° 4 or > vs. 0 1.03 0.92–1.15 0.5810 Grade High vs. Low/Intermediate 1.54 1.42–1.67 < 2 × 10⁻¹⁶***
ER status Positive vs. Negative 0.92 0.83–1.02 0.1055 Her2 status Positive vs. Negative 1.29 1.15–1.45 1.9 × 10⁻⁵ ***
Table 2. Multiple linear regression of clinical and pathological variables associated with SQLE expression in breast cancer. AConfidence interval. NPLN: Number of Positive Lymph Nodes. Significance codes: 0 ‘***’ 0.001 ‘**’ 0.01 ‘*’ 0.05 ‘°’ 0.1.
Figure 3. SQLE high expression is independently associated with unfavorable prognosis in breast cancer. Patients affected by tumors bearing chromosome 8q24.13-q24.21 (the region encompassing SQLE and MYC) gains or amplifications are characterized by poorer overall survival (OS), (A). However, whilst MYC expression levels have per se no prognostic value (B), SQLE overexpression is not only associated with worse OS by univariable analysis (C), but also maintains its independent prognostic value in a Cox proportional hazard model, including all classical clinical and pathological parameters, as shown in the forest plot depicted in panel (D) (HRs represented by black triangles and 95% CIs showed as horizontal black lines). Data are from the METABRIC set. P values in the bottom left area of Kaplan-Meier curves are obtained using the log-rank test. Panel D abbreviations: Intm. = Intermediate, y.o. = years old, NPLN = number of positive lymph nodes.
SQLE overexpression, but not MYC overexpression, is an independently significant
unfavora-ble prognostic biomarker in breast cancer.
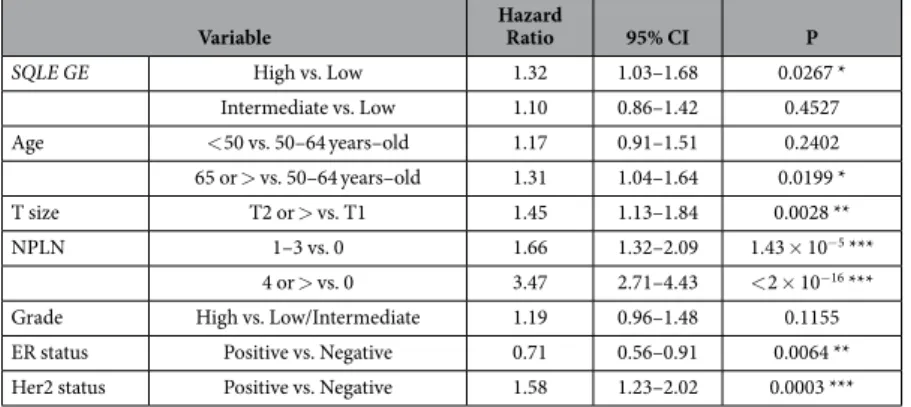
Next, we asked whether SQLE or MYC expression could bear any association with survival in breast cancer patients. To our surprise, there was no difference in survival rates in patients who developed tumors with low, intermediate, or elevated levels of MYC in the METABRIC data-set (P = 0.7945, see Fig. 1B). On the other hand, when stratifying patients by their SQLE GE values, we observed that the instantaneous risk of disease-specific death increased as a function of SQLE transcript abundance (HR for intermediate vs. low SQLE levels = 1.25, 95% CI = 0.98–1.61, P = 0.0754; HR for high vs. low SQLE levels = 1.79, 95% CI = 1.42–2.25, P = 9 × 10⁻⁷; overall log-rank P = 2 × 10⁻⁶, see Fig. 3C). Of even greater relevance, in a Cox proportional hazards regression model starting from all the classical clinical and pathological parameters (i.e., age, tumor size, NPLN, histological grade, ER, and Her2 status), as well as both MYC and SQLE GE values, only SQLE was retained, together with clinico-pathological parameters, as an independently significant variable for survival prediction in the final model (adjusted HR for the SQLE high vs. low expression strata = 1.32, 95% CI = 1.03–1.68, P = 0.0267; overall P of the final model = 0, see Table 3 and Fig. 3D). We intentionally did not include the integrative clustering subgroups31 or the PAM50 intrinsic subtypes42 as variables in our model: due to the strong independent prognostic value of those genomic classifiers, they would be retained at the cost of exclud-ing more traditional parameters such as grade and ER status, which were the focus of this exploratory charac-terization of SQLE in breast cancer. To summarize, we demonstrated that SQLE overexpression is independently associated with an unfavorable outcome in breast cancer, even when taking into consideration classical clinical and pathological variables such as age, tumor size, nodal status, grade, ER, and Her2 status.Breast cancer cell lines show highly variable SQLE CN and GE.
With the purpose of establishing anin vitro breast cancer cell line panel for SQLE characterization, we selected and acquired six breast cancer lines
reported to present alterations in SQLE CN and GE levels from the CCLE43 or the NCI-60 cell line panel44, after assessing the data available through the cBioPortal for Cancer Genomics45. We then characterized those lines for ploidy and absolute SQLE CN value by array-CGH, and GE by qPCR (see Table 4, Fig. 4A,B, and Supplementary Fig. S2 online). SK-BR-3 and MCF-7 (see Fig. 4A) showed the highest levels of SQLE CN, each with more than 8 copies, through focal amplification of the chromosome 8q24.13 cytoband. Hs 578T presented the highest
SQLE GE values and 5 copies of the gene through chromosome 8q gain, while MDA-MB-468 and T-47D were
hypo-triploid, and were not characterized by SQLE focal alterations. MDA-MB-231 was unique, in that it behaved as a natural knockdown for SQLE, carrying only one copy of this gene and almost undetectable SQLE GE levels (see Fig. 4B). Altogether, the six breast cancer cell lines we selected were representative of the full spectrum of
SQLE possible alterations, ranging from high-degree focal amplification, through arm-level gains with SQLE
overexpression, to deletion with almost undetectable endogenous SQLE transcript.
Variable Hazard Ratio 95% CI P
SQLE GE High vs. Low 1.32 1.03–1.68 0.0267 *
Intermediate vs. Low 1.10 0.86–1.42 0.4527 Age < 50 vs. 50–64 years–old 1.17 0.91–1.51 0.2402 65 or > vs. 50–64 years–old 1.31 1.04–1.64 0.0199 * T size T2 or > vs. T1 1.45 1.13–1.84 0.0028 ** NPLN 1–3 vs. 0 1.66 1.32–2.09 1.43 × 10⁻⁵ *** 4 or > vs. 0 3.47 2.71–4.43 < 2 × 10⁻¹⁶ ***
Grade High vs. Low/Intermediate 1.19 0.96–1.48 0.1155 ER status Positive vs. Negative 0.71 0.56–0.91 0.0064 ** Her2 status Positive vs. Negative 1.58 1.23–2.02 0.0003 ***
Table 3. Cox proportional hazards multiple regression, with overall survival as outcome variable. Significance codes: 0 ‘***’ 0.001 ‘**’ 0.01 ‘*’ 0.05.
Cell line Mean ploidy CNA / focalB GEC ± 95% CI IC
50 [μM]D ± 95% CI DTE-hours (scrambledF) ± 95% CI DT - hours (siSQLEG)
MCF-7 3.57 9/yes 0.94 ± 0.03 32.1 ± 3.1 61.7 ± 3.7 90.4 ± 5.6 Hs 578T 2.45 5/no 2.02 ± 0.14 52.2 ± 4.0 146.8 ± 5.8 170.3 ± 5.5 SK-BR-3 3.85 13/yes 0.92 ± 0.21 84.9 ± 6.8 n.p.H n.p. MDA-MB-468 2.79 4/no 1.28 ± 0.02 115.4 ± 10.3 n.p. n.p. T-47D 2.62 4/no 0.47 ± 0.02 140.8 ± 18.4 55.3 ± 1.3 73.5 ± 1.2 MDA-MB-231 2.64 1/yes 0.05 ± 0.01 220.9 ± 8.8 48.3 ± 4.2 48.7 ± 2.0
Table 4. Breast cancer cell line SQLE characteristics and experimental results. ACopy number. BDefined thus when aberration encompasses less than 20% of chromosomal arm. CGene expression. DTerbinafine micromolar concentration inhibiting cellular growth by 50%. EDoubling time. FNegative siRNA control. GSQLE-targeting siRNA. HNot performed.
SQLE pharmacological inhibition decreases breast cancer cell line viability in a copy-dosage
correlated way.
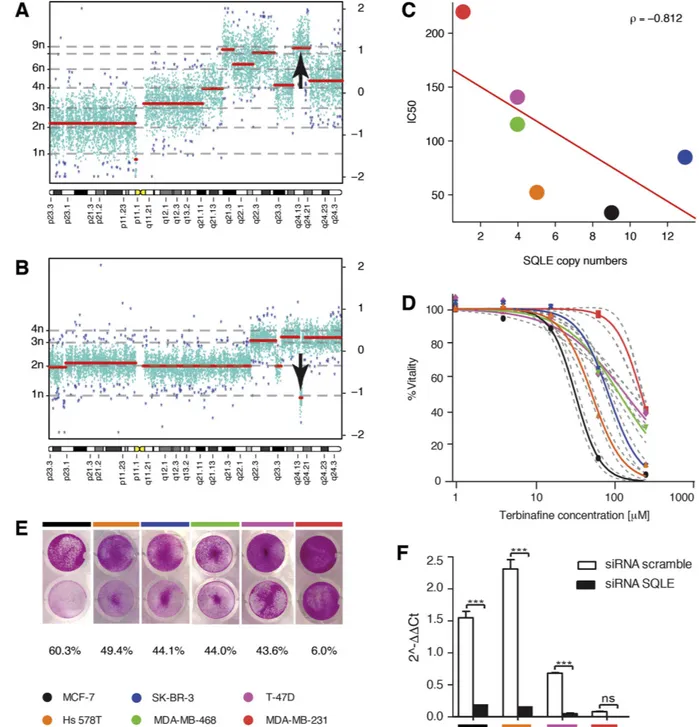
Due to SQLE association with breast cancer aggressiveness, we hypothesized that its inhi-bition would lead to a decrease in cell proliferation. To control for potentially aspecific toxic effects of choles-terol biosynthesis inhibition, we assessed in parallel cell lines with differential levels of expression of SQLE. We therefore tested the viability of our six breast cell lines upon challenging with a SQLE inhibitor, terbinafine46.Figure 4. The cytotoxic action of the SQLE inhibitor terbinafine is associated with SQLE copy dosage in breast cancer cell lines. The chromosome 8 karyogram of breast cancer cell lines with the lowest (MCF-7) (A), and highest (MDA-MB-231) (B), IC50 for terbinafine are reported: along the x-axis are chromosomal coordinates, left y-axis shows the absolute copy number for segmented regions (thick red lines), and right y-axis reports log2 ratios. Turquoise points are individual probes used for segmentation, whereas dark blue asterisks are array outliers. A vertical thick black arrow points toward SQLE locus in both karyograms. Terbinafine IC50 is anti-correlated (red line representing linear regression and ρ being Spearman’s correlation coefficient) with
SQLE copy dosage (C), with a greater than 7-fold difference between least and most sensitive cell line
(D), dashed grey lines representing 95% confidence intervals). Sulforhodamine B coloration shows the residual cell mass upon 48 hours of terbinafine treatment (E). Silencing efficiency by SQLE-directed siRNA was always greater than 90% in treated lines (***P < 0.001, whiskers represent S.E.M.) (F). Color codes for cell lines are reported in the bottom left of the figure.
Terbinafine is used as an antifungal agent, since it inhibits fungal SQLE at plasma concentrations between 0.34 and 3.4 μ M47. However, it also targets mammalian SQLE at higher concentrations12,13. Terbinafine indeed caused cancer cell demise in our breast lines, with an IC50 varying by almost an order of magnitude across the six assessed lines (see Table 4 and Fig. 4D,E). Of interest, terbinafine exerted its effect in an evident SQLE copy-dosage corre-lated manner (ρ = − 0.81, P = 0.0499, see Fig. 4C). Moreover, Hs 578T showed a peculiar sensitivity to terbinafine, in spite of having a lower SQLE CN value than other lines. Not surprisingly however, Hs 578T was the highest SQLE expresser in our panel, and indeed also SQLE GE levels showed a trend for correlation with terbinafine IC50 in the six lines panel (ρ = − 0.71, P = 0.1361). In summary, we demonstrated that pharmacological inhibition of SQLE effectively decreases breast cancer cell line viability in a copy-dosage correlated manner, suggesting that SQLE may be a treatment target in such disease, and that SQLE CN and/or GE increase could be used as predic-tive biomarkers of sensitivity to selecpredic-tive inhibitors of mammalian SQLE activity.
SQLE silencing increases doubling time only in SQLE-expresser breast cancer cell lines.
Since terbinafine may act at least partially in a non-specific manner at high concentrations48, we induced transientSQLE silencing in two lines with high endogenous SQLE transcript levels (MCF-7 and Hs 578T), one line with
low but detectable SQLE (T-47D), and the cell line carrying a deletion in SQLE, MDA-MB-231. Silencing was highly effective, since it reduced SQLE GE by more than 90% at 24 h in all the three lines with detectable SQLE levels at baseline, compared to scrambled siRNA control (P < 0.001, see Fig. 4F). Upon SQLE silencing, all the three SQLE expresser cell lines showed an increase in their doubling times, by 47%, 17%, and 33% respectively, compared to cells treated with scrambled siRNA (see Table 4). MDA-MB-231, on the other hand, did not show any lengthening in its replication time. Taken together, our results demonstrate that targeting SQLE transcript by transcriptional silencing has an inhibitory biological effect, only in breast cell lines that exhibit endogenous
SQLE transcription, with MDA-MB-231 acting as a natural negative control for our experiments. Moreover, our
findings constitute a methodologically independent confirmation that the decrease in cell viability, observed in cell lines treated with terbinafine is indeed due to SQLE inhibition.
Discussion
In the present article, we assessed the presence of CN and GE aberrations of SQLE, a key enzyme in the synthesis of cholesterol3–7, across more than 8,000 cases from 22 cancer types made available by the TCGA. We found that
SQLE CN gains are frequent in several histologies, that SQLE GE is tightly correlated with its CN values, and
that the strength of this association is tightest in breast cancer, followed by ovarian and colorectal cancer. SQLE CN-GE correlation appears to be systematically stronger in breast and ovarian tumors compared to the same association calculated for MYC in those cancer types, in spite of the close proximity of the two gene loci2, which results in similar CN values for both genes. By exploring SQLE correlations with clinical and pathological varia-bles in METABRIC31 (the single largest, clinically annotated, publicly available CN/GE breast cancer dataset), we established that aggressive cases, defined by high histological grade, larger tumor size, nodal involvement, and by ER- and Her2 + disease, are characterized by SQLE overexpression. Moreover, we observed that SQLE over-expression, but not MYC, is independently significantly associated with unfavorable outcome in breast cancer, even after taking into account the above-mentioned clinical and pathological parameters. Finally, through SQLE pharmacological inhibition and SQLE transcript-directed silencing experiments in a panel of breast cancer cell lines portraying the diversity of SQLE CN and GE, we demonstrated that SQLE inhibition results in a decrease in cell viability that is highly correlated with SQLE copy dosage, and that induced reduction of SQLE GE levels causes a noticeable lengthening in replication time, only in cells with endogenous detectable SQLE transcript.
Altogether, our results pinpoint SQLE as a bona fide metabolic oncogene by amplification, as well as a ther-apeutic target in breast, and possibly, other cancer types, since it responds to major requirements to be consid-ered as an oncogene of therapeutic relevance49: first, SQLE is frequently altered by CN gains in breast cancer, and SQLE GE appears to be tightly regulated by increases in the copy dosage of its gene locus; second, SQLE is a key enzyme in the synthesis of cholesterol, and several studies have pointed toward a therapeutic effect of cholesterol lowering in cancer, possibly by decreasing cholesterol bioavailability, altering cancer cell mem-branes, and through other mechanisms50–52; third, due to the CN-driven GE increase found only in cancer cells,
SQLE may behave as an “oncogene by addiction”53 (as opposed for example to HMGCR, the target of statins, for which no recurrent aberrations have been described in tumors), such that mammalian SQLE inhibition may have a high therapeutic index, leaving healthy cells relatively unharmed by SQLE blockade, whilst provoking cell demise in SQLE-amplified cells only: one such notable example is the selective activity of anti-ERBB2 agents in ERBB2-amplified breast cancer, which has led to their successful adoption in clinical practice; last but not least, researchers have already developed potent and selective inhibitors of mammalian SQLE14–16, albeit with an entirely different scope than the one we foresee, i.e. as anti-cancer agents.
Of interest, several genes, apart from SQLE and MYC, located in the q arm of chromosome 8 may have an even tighter CN-GE correlation than SQLE, and be endowed with essential biological properties for cancer prolifer-ation and survival. A notable example is RAD21, found in close proximity to SQLE on chromosome 8q24.112.
RAD21 encodes a protein involved in DNA double-strand-break repair54, shows high-level amplifications in 37% of the TCGA breast cancer cases, and presents a significant transcriptional correlation with SQLE GE (ρ = 0.62) (data from http://www.cbioportal.org, accessed May 2nd, 2015). Our findings are not in contrast with a pleio-tropic, multipronged impact of the amplification of this region. Notwithstanding, on the one hand a direct role of
SQLE overexpression in promoting neoplastic growth was shown by the clear in vitro evidence we generated, that
SQLE inhibition causes cell demise and slows replication: we have therefore a rationale to consider SQLE as an especially relevant cancer-gene belonging to that region. On the other hand, it is entirely possible that several pro-teins encoded in the same chromosomal region cooperate to determine a more aggressive phenotype in cancer: indeed, it has been demonstrated that genes with a common final function can be physically clustered in the same
genomic interval (see55 and citations therein). We can speculate that SQLE and RAD21 concomitant overexpres-sion would enable a cancer cell to proliferate more effectively through a more proficient DNA damage repair sys-tem while dividing (through RAD21), and at the same time to speed up the process by more efficient membrane synthesis (courtesy of SQLE). However, the key point of our research is another: even if other genes found in the same physical region of SQLE have their own roles in determining an aggressive cancer phenotype, we have also showed experimentally that SQLE is an attractive bona fide target for treatment, while other co-located proteins (such as RAD21) are not readily druggable, and hence less clinically relevant to the purpose of finding novel ther-apeutic targets in breast cancer and other tumor types.
We have to acknowledge that our in vitro experiments are far from exhaustive: the potential for off-targets in pharmacological SQLE inhibition experiments is still present, although terbinafine blocks the activity of mamma-lian SQLE, and albeit selective, SQLE silencing could result in a cytostatic rather than cytotoxic effect on cell lines. Nonetheless, the independent nature of the two methods we used to block SQLE activity (i.e. using a chemical compound known to target also mammalian SQLE and decreasing SQLE transcription by siRNA) corroborates the proof of concept that the detrimental biological effects we observed in breast cancer cell lines are indeed likely to result from the selective inhibition of SQLE activity. Moreover, the SQLE copy-dosage correlation with terbi-nafine activity is per se highly suggestive of an on-target biological phenomenon, worth of further investigation. Copy dosage alone does not explain entirely the sensitivity to SQLE inhibition in our cell set: in the case of Hs 578T, terbinafine effect is elevated in spite of a relatively low copy dosage, while SK-BR-3 exhibit lower sensitivity to terbinafine than MCF-7, while having an even higher copy number in the SQLE region. However, the first cell line exhibits the highest SQLE expression of the six we tested, possibly driven by epigenetic mechanisms worth of further investigation, whereas partial resistance phenomena and other post-translational modifications7 still to be tested could account for the discrepancy observed in the second line. Finally, SQLE inhibition may be toxic in in
vitro, but not in vivo experiments, due to the limited supply of cholesterol in the employed media: however, fetal
bovine serum provides on average 310 μ g/mL of such molecule56, thus proving cultivated cancer cell lines with an external source of cholesterol upon de novo synthesis inhibition.
We are not the first investigators to point out that SQLE may have a biological relevance in breast cancer. Other researchers observed SQLE overexpression in an adverse prognosis group of ER + , stage I/II breast cancer cases33, described aberrant methylation patterns in the 8q12.1-q24.22 genomic region chromosomal region35, or reported that SQLE amplification and increased transcription was enriched (together with other genes) in a distinctive cluster of triple negative breast tumors or in specific ethnic populations25,34. Again, we have to remark that we provided here the first systematic, large-scale assessment of SQLE CN amplification and overexpression in breast cancer and other tumor types in humans. Our analyses have allowed us to identify the tendency of aggressive breast tumors, especially of the Her2 positive, higher grade ones, to overexpress SQLE, and its independent role in determining an unfavorable outcome in breast neoplasms. Finally, to the best of our knowledge no one had so far explored the potential anti-cancer properties of SQLE inhibition in SQLE-amplified breast cancer models.
To conclude, we believe our present research has shed light on a neglected metabolic cancer gene by amplifica-tion in breast cancer, and possibly in other tumor types. Our findings may thus pave the way to addiamplifica-tional studies in the clinical setting, to assess the relevance of SQLE inhibition as a novel cancer treatment option.
Methods
Datasets.
GISTIC aberration calls, log2 ratio CN intensities, and RNA-sequencing pre-processed GE inten-sities generated by the TCGA were downloaded from the Broad Institute TCGA GDAC repository (version 2015/02/04). Only datasets with more than 100 collected cases were considered in our analyses, for a total of 8,783 cases and 22 cancer types. The METABRIC dataset was downloaded from the Sage Bionetworks Synapse repository (last accessed, March 3rd, 2015). In our analyses, we only considered patients from the METABRIC dataset with complete information for age, tumor size, NPLN (categorized as 0, 1–3, 4 or more), histological grade, ER and Her2 status by bimodal gene expression assessment, as well as follow-up status. We also excluded cases with no intrinsic subtype classification, as well as those classified as “normal-like”, in light of the contro-versies that this class of breast cancers may be reflective of too low a cellularity to obtain meaningful CN and GE data57. We were therefore left with 1,633 patients to conduct our downstream tests. For aberrations in the chromo-some 8q24.13-q24.21 region (whose log2 ratios were calculated as the means of SQLE and MYC loci values), we categorized intensities as “gains” if the log2 ratio for a given sample was > 0.32 and ≤ 0.81, and as “amplifications” if > 0.81. Those empirical thresholds would correspond to three and five gene copies respectively, in a fully clonal region of a near-diploid cancer genome with ~ 50% tumor cell fraction (see formula (1) reported below).Cell Lines and Reagents.
Cell lines were purchased from ATCC (LGC Standards S.r.l., Milan, Italy), except T-47D and MDA-MB-468 that were obtained from the Developmental Therapeutics Program of the National Cancer Institute (Frederick, MD). MCF-7, T-47D, MDA-MB-468, and MDA-MB-231 cell lines were maintained in RPMI 1640 medium supplemented with 10% FBS, penicillin (50 units/ml), and streptomycin (50 μ g/ml) (Life Technologies, Italy). Hs 578T cell line was maintained in DMEM medium supplemented with 10% FBS, insulin (0.01 mg/ml), penicillin (50 units/ml), and streptomycin (50 μ g/ml) (Life Technologies, Italy). SK-BR-3 cell line was maintained in McCoy’s 5A medium supplemented with 10% FBS, penicillin (50 units/ml), and streptomycin (50 μ g/ml) (Life Technologies, Italy). Terbinafine Hydrochloride CSR was purchased from Sigma-Aldrich, Italy. ON-TARGETplus siRNA kits were purchased from Dharmacon, Thermo Fisher Scientific Inc., Italy. Taqman®
Gene Expression Assays and TaqMan®
Universal PCR Master Mix were purchased from Life Technologies, Italy.Array-CGH experiments.
DNA from cell lines was extracted using DNeasy Blood & Tissue Kit (Qiagen GmbH, Hilden, Germany). DNA samples were diluted in 200 μ L Nuclease-Free water according to the Manufacturer’s instructions. DNA was quantified with a NanoDrop®
ND-1000 spectrophotometer (ThermoScientific, Inc.). DNA copy number aberrations were determined using high-resolution arrays (SurePrint G3 Human CGH Microarrays, 4 × 180K) (Agilent Technologies, Palo Alto, CA, USA). For DNA labeling and assess-ment of DNA labeling efficiency, 0.8 μ g of amplified test and reference DNA (female normal genomic DNA from Promega, Madison,WI) were labeled using Sure Tag DNA labeling kit (Agilent Technologies, Palo Alto, CA, USA) with Cy5-dUTP and Cy3-dUTP respectively, according to the CGH Enzymatic Labeling Kit Protocol v.7.3 (Agilent Technologies, Palo Alto, CA, USA). Unincorporated nucleotides were then removed using centrifugal fil-ters (Amicon Ultra 0.5ml, Merck Millipore, Merck KGaA, Darmstadt, Germany) according to the Manufacturer’s protocol. Quality analysis and quantification of labeled DNA were performed by NanoDrop
®
ND-1000 (Thermo Scientific, Inc.) spectrophotometer, measuring A260 (for DNA), A550 (for Cy5) and A649 (for Cy3) to evaluate yield, degree of labeling, and specific activity. To perform array hybridization and scanning, Cy5-labeled DNA from cell lines was mixed with an equivalent amount of Cy3-labeled reference DNA. Repetitive sequences were blocked with human Cot-1 DNA (InvitrogenTM, Thermo Scientific, Inc.) and samples were hybridized with Oligo aCGH/ChIP-on-chip Hybridization Kit onto the microarray slides, according to the Manufacturer’s specifica-tions. Following hybridization at 65 °C for 24 h in a rotating oven (Agilent Technologies, Palo Alto, CA, USA) at 20 rpm, slides were washed and scanned using a Agilent Microarray Scanner (G2505C). Resulting images were then elaborated and quality-checked using the Feature Extraction software v11.01.1 (Agilent Technologies, Palo Alto, CA, USA), and exported into .txt files for further analyses.Cell viability assays.
Five thousand MCF-7, 3.5 × 10³ MDA-MB-231, 3.8 × 10³ MDA-MB-468, 5 × 10³ T-47D, 4.5 × 10³ SK-BR-3 or 3.8 × 10³ Hs 578T cells were plated, in quintuplicate, in 96-well plates, and let to adhere overnight. Cells were then treated with terbinafine in the range 250 μ M-250 nM. 72 h later, viability was determined by a colorimetric assay using CellTiter 96®
Aqueous.Sulforhodamine B assays.
Forty-five thousand MCF-7, 2.5 × 10⁴ MDA-MB-231, 3.5 × 10⁴ MDA-MB-468, 4.5 × 10⁴ T-47D, 4.5 × 10⁴ SK-BR-3, or 4.5 × 10⁴ Hs 578T cells were plated in 6-well plates and let to adhere overnight. Cells were treated with 62.5 μ M terbinafine for 72 h, then plates were fixed with cold 50% trichlo-roacetic acid at 4 °C for 30 minutes, washed with cold water and dried overnight. Plates were stained with 0.4% sulforhodamine B (SRB) in 1% acetic acid, gently shaken for 10 minutes, washed with 1% acetic acid to remove unbound stain, dried overnight and photographed. SRB was then dissolved in 10 mM Tris, and optical density was measured at 515 nm on a Tecan Infinite F200 ProTM plate reader.siRNA transfections.
Transient transfection of cells was performed using ON-TARGET-Plus Smart Pool SQLE siRNAs, non-targeting control siRNAs and GAPDH positive control siRNAs. Twenty thousand MCF-7 and T-47D, 1.2 × 10⁵ MDA-MB-231 and Hs 578T cells/well were plated in 6-well plates, allowed to adhere for 24 h, and then transfected with a final concentration of 100 nM siRNA/well using Dharmafect®
according to the Manufacturer’s instructions. 24 h after transfection, cells were plated for SRB based doubling time measurement and RNA isolation. SQLE silencing was verified by qPCR.Doubling time measurements.
After siRNA transfection, MCF-7, T-47D, MDA-MB-231, and Hs 578T cells were plated in 24-well plates and allowed to adhere for 24 h. At different time points (0, 15, 25 and 43 h) cells were fixed and analyzed with the SRB method (see above) and optical density was measured at 515 nm on a Tecan Infinite F200 ProTM plate reader. Doubling time was finally calculated from the signal corresponding to the differ-ent time points using the online tool Roth V. 2006 (http://www.doubling-time.com/compute.php).qPCR.
Total RNA was extracted from cells using the RNeasy minikit (Qiagen S.r.l., Milan, Italy) according to the Manufacturer’s specifications. Concentration and integrity were checked using an Agilent 2100 Bioanalyzer system (Agilent Technologies, Palo Alto, CA, USA). One μ g of RNA was reverse-transcribed in a final volume of 50 μ l using the High Capacity cDNA Reverse Transcription kit (Invitrogen). 5 μ l of the resulting cDNA was used for qPCR, performed in triplicates using a 7900 HT Fast real-time PCR system (Applied Biosystems by Invitrogen) with TaqMan®
Gene Expression Assays for human RPLP0 (Hs99999902_m1), GAPDH (Hs99999905_m1), SQLE (Hs01123768_m1), and TaqMan®
Universal PCR Master Mix. SQLE GE was normalized to housekeeping GE (geometric mean of GAPDH and RPLP0). Comparisons in GE were calculated using the 2−ΔΔCt method.Array-CGH data analyses.
Log10 ratios from Agilent feature extraction .txt files were imported in R (http://www.R-project.org/) using the data.table package, averaged over probe replicates using the limma BioConductor package58, back-transformed into linear scale before converting into log2 ratio data space. After mapping probe location to the NCBI37/hg19 build of the human genome using the UCSC liftOver utility (https://genome.ucsc. edu/cgi-bin/hgLiftOver), data were preprocessed by outlier winsorization with the copynumber package59 using default options, and segmented by penalized least square regression using a heuristically chosen value of γ = 100, which optimized the number of segments per sample, while not leading to excessive information loss. Segmented data were then used to compute cancer cell line mean ploidy and absolute copy number values for SQLE using ABSOLUTE60 with the copy_num_type argument set to “total”, and following the recommendations from the companion website (http://www.broadinstitute.org/cancer/cga/ABSOLUTE).
Once the most likely ploidy and predominant clone cell fraction for a given cell line was selected, the absolute copy number of SQLE locus could be calculated solving the following equation for n:
α α β = + ( − ) ( ) α β, LRR n 2 1 1
where α is the predominant clone fraction in a cell mixture, β is the mean ploidy returned by ABSOLUTE, n is the integer copy number of a segment, and LRR is the measured log2 ratio for that segment, given α and β . Raw α β,
and log2 normalized data are available in GEO (www.ncbi.nih.gov/projects/geo) under the accession number GSE71395.
Statistics.
Continuous-association tests were carried out using the Spearman’s correlation coefficient, which does not hold a priori assumptions over the distribution of the data (normality being systematically violated bylog2 ratio CN measures). FDRs were calculated with the Benjamini-Hochberg multiple testing correction. MCA
was performed using the package FactoMineR (http://factominer.free.fr/contact/index.html), after categorizing
SQLE expression intensities in tertiles (as for MYC) in the METABRIC dataset, and results were represented with ggplot261. Linear regression was employed to analyze the associations of multiple variables with SQLE expression, whereas t tests or one-way ANOVA tests were used for comparison of SQLE expression between categorical vari-ables with two or more levels respectively, using the Tukey honest significant difference method to compare levels in the latter case. Survival curves were plotted using the Kaplan-Meier estimators, generated with the package
survcomp62, and P values were calculated with the log-rank test. For survival analyses including more than one variable, a stepwise backward-forward Cox proportional hazards regression model was employed, starting from all clinical and pathological variables described above, as well as MYC and SQLE expression levels categorized in tertiles, until minimization of the Akaike Information Criterion was achieved (package MASS63). For Cox regression, the P value was calculated using the Wald test. The forest plot in Fig. 3D was generated using the package rms. All the aforementioned analyses were conducted in R, as were the related figures. For terbinafine experiments, Hill slope curves, IC50 concentrations, and 95% CIs were calculated by fitting a nonlinear function to the quintuplicate data points, whereas silencing efficiency on cell lines was tested using one-way ANOVA with contrasts, followed by the Bonferroni correction for multiple testing. These tests and the corresponding plots were generated using GraphPad PRISM 6. All statistical tests were two-tailed, and null-hypotheses were rejected with P values < 0.05. Adobe Illustrator CS6 was used to finalize the illustrations. No data was altered for graphical representation.
References
1. Nagai, M. et al. Localization of the squalene epoxidase gene (SQLE) to human chromosome region 8q24.1. Genomics 44, 141–143, doi: 10.1006/geno.1997.4825 (1997).
2. Nusbaum, C. et al. DNA sequence and analysis of human chromosome 8. Nature 439, 331–335, doi: 10.1038/nature04406 (2006). 3. Laden, B. P., Tang, Y. & Porter, T. D. Cloning, heterologous expression, and enzymological characterization of human squalene
monooxygenase. Arch Biochem Biophys 374, 381–388, doi: 10.1006/abbi.1999.1629 (2000).
4. Yamamoto, S. & Bloch, K. Studies on squalene epoxidase of rat liver. J Biol Chem 245, 1670–1674 (1970).
5. Hidaka, Y., Satoh, T. & Kamei, T. Regulation of squalene epoxidase in HepG2 cells. J Lipid Res 31, 2087–2094 (1990).
6. Hidaka, Y. et al. Effect of a novel squalene epoxidase inhibitor, NB-598, on the regulation of cholesterol metabolism in Hep G2 cells.
J Biol Chem 266, 13171–13177 (1991).
7. Gill, S., Stevenson, J., Kristiana, I. & Brown, A. J. Cholesterol-dependent degradation of squalene monooxygenase, a control point in cholesterol synthesis beyond HMG-CoA reductase. Cell Metab 13, 260–273, doi: 10.1016/j.cmet.2011.01.015 (2011).
8. Willett, J. D., Sharpless, K. B., Lord, K. E., van Tamelen, E. E. & Clayton, R. B. Squalene-2,3oxide, an intermediate in the enzymatic conversion of squalene to lanosterol and cholesterol. J Biol Chem 242, 4182–4191 (1967).
9. Stancu, C. & Sima, A. Statins: mechanism of action and effects. J Cell Mol Med 5, 378–387 (2001).
10. GTEx Consortium. The Genotype-Tissue Expression (GTEx) project. Nat Genet 45, 580–585, doi: 10.1038/ng.2653 (2013). 11. Belter, A.et al. Squalene monooxygenase - a target for hypercholesterolemic therapy. Biol Chem 392, 1053–1075, doi: 10.1515/
BC.2011.195 (2011).
12. Ryder, N. S. & Dupont, M. C. Inhibition of squalene epoxidase by allylamine antimycotic compounds. A comparative study of the fungal and mammalian enzymes. Biochem J 230, 765–770 (1985).
13. Favre, B. & Ryder, N. S. Differential inhibition of fungal amd mammalian squalene epoxidases by the benzylamine SDZ SBA 586 in comparison with the allylamine terbinafine. Arch Biochem Biophys 340, 265–269 (1997).
14. Horie, M. et al. NB-598: a potent competitive inhibitor of squalene epoxidase. J Biol Chem 265, 18075–18078 (1990).
15. Gotteland, J. P. et al. (Aryloxy)methylsilane derivatives as new cholesterol biosynthesis inhibitors: synthesis and hypocholesterolemic activity of a new class of squalene epoxidase inhibitors. J Med Chem 38, 3207–3216 (1995).
16. Sawada, M. et al. Effect of FR194738, a potent inhibitor of squalene epoxidase, on cholesterol metabolism in HepG2 cells. Eur J
Pharmacol 431, 11–16 (2001).
17. Baigent, C. et al. Efficacy and safety of cholesterol-lowering treatment: prospective meta-analysis of data from 90,056 participants in 14 randomised trials of statins. Lancet 366, 1267–1278, doi: 10.1016/S0140-6736(05)67394-1 (2005).
18. Horie, M. et al. Hypolipidemic effects of NB-598 in dogs. Atherosclerosis 88, 183–192 (1991).
19. Wagner-Recio, M., Toews, A. D. & Morell, P. Tellurium blocks cholesterol synthesis by inhibiting squalene metabolism: preferential vulnerability to this metabolic block leads to peripheral nervous system demyelination. J Neurochem 57, 1891–1901 (1991). 20. Chugh, A., Ray, A. & Gupta, J. B. Squalene epoxidase as hypocholesterolemic drug target revisited. Prog Lipid Res 42, 37–50 (2003). 21. Sawada, M., Matsuo, M. & Seki, J. Inhibition of cholesterol synthesis causes both hypercholesterolemia and hypocholesterolemia in
hamsters. Biol Pharm Bull 25, 1577–1582 (2002).
22. Cancer Genome Atlas Research Network. Comprehensive genomic characterization defines human glioblastoma genes and core pathways. Nature 455, 1061–1068, doi: 10.1038/nature07385 (2008).
23. Chin, K. et al. Genomic and transcriptional aberrations linked to breast cancer pathophysiologies. Cancer Cell 10, 529–541, doi: 10.1016/j.ccr.2006.10.009 (2006).
24. Adelaide, J. et al. Integrated profiling of basal and luminal breast cancers. Cancer Res 67, 11565–11575, doi: 10.1158/0008-5472. CAN-07-2536 (2007).
25. Chin, S. F. et al. High-resolution aCGH and expression profiling identifies a novel genomic subtype of ER negative breast cancer.
Genome Biol 8, R215, doi: 10.1186/gb-2007-8-10-r215 (2007).
26. Haverty, P. M. et al. High-resolution genomic and expression analyses of copy number alterations in breast tumors. Genes
Chromosomes Cancer 47, 530–542, doi: 10.1002/gcc.20558 (2008).
27. Mackay, A. et al. A high-resolution integrated analysis of genetic and expression profiles of breast cancer cell lines. Breast Cancer Res
Treat 118, 481–498, doi: 10.1007/s10549-008-0296-7 (2009).
28. Staaf, J. et al. High-resolution genomic and expression analyses of copy number alterations in HER2-amplified breast cancer. Breast
29. Turner, N. et al. Integrative molecular profiling of triple negative breast cancers identifies amplicon drivers and potential therapeutic targets. Oncogene 29, 2013–2023, doi: 10.1038/onc.2009.489 (2010).
30. Cancer Genome Atlas Network. Comprehensive molecular portraits of human breast tumours. Nature 490, 61–70, doi: 10.1038/ nature11412 (2012).
31. Curtis, C. et al. The genomic and transcriptomic architecture of 2,000 breast tumours reveals novel subgroups. Nature 486, 346–352, doi: 10.1038/nature10983 (2012).
32. Manning, G., Whyte, D. B., Martinez, R., Hunter, T. & Sudarsanam, S. The protein kinase complement of the human genome. Science
298, 1912–1934, doi: 10.1126/science.1075762 (2002).
33. Helms, M. W. et al. Squalene epoxidase, located on chromosome 8q24.1, is upregulated in 8q + breast cancer and indicates poor clinical outcome in stage I and II disease. Br J Cancer 99, 774–780, doi: 10.1038/sj.bjc.6604556 (2008).
34. D’Arcy, M. et al. Race-associated biological differences among Luminal A breast tumors. Breast Cancer Res Treat 152, 437–448, doi: 10.1007/s10549-015-3474-4 (2015).
35. Parris, T. Z. et al. Frequent MYC coamplification and DNA hypomethylation of multiple genes on 8q in 8p11-p12-amplified breast carcinomas. Oncogenesis 3, e95, doi: 10.1038/oncsis.2014.8 (2014).
36. Mermel, C. H. et al. GISTIC2.0 facilitates sensitive and confident localization of the targets of focal somatic copy-number alteration in human cancers. Genome Biol 12, R41, doi: 10.1186/gb-2011-12-4-r41 (2011).
37. Zack, T. I. et al. Pan-cancer patterns of somatic copy number alteration. Nat Genet 45, 1134–1140, doi: 10.1038/ng.2760 (2013). 38. Nakagawa, S. & Cuthill, I. C. Effect size, confidence interval and statistical significance: a practical guide for biologists. Biol Rev
Camb Philos Soc 82, 591–605, doi: 10.1111/j.1469-185X.2007.00027.x (2007).
39. Vennstrom, B., Sheiness, D., Zabielski, J. & Bishop, J. M. Isolation and characterization of c-myc, a cellular homolog of the oncogene (v-myc) of avian myelocytomatosis virus strain 29. J Virol 42, 773–779 (1982).
40. Ravasi, T. et al. An atlas of combinatorial transcriptional regulation in mouse and man. Cell 140, 744–752, doi: 10.1016/j. cell.2010.01.044 (2010).
41. Greenacre, M. J. & Blasius, J. r. Multiple correspondence analysis and related methods. (Chapman & Hall/CRC, 2006). 42. Perou, C. M. et al. Molecular portraits of human breast tumours. Nature 406, 747–752, doi: 10.1038/35021093 (2000).
43. Barretina, J. et al. The Cancer Cell Line Encyclopedia enables predictive modelling of anticancer drug sensitivity. Nature 483, 603–607, doi: 10.1038/nature11003 (2012).
44. Shoemaker, R. H. The NCI60 human tumour cell line anticancer drug screen. Nat Rev Cancer 6, 813–823, doi: 10.1038/nrc1951 (2006).
45. Cerami, E. et al. The cBio cancer genomics portal: an open platform for exploring multidimensional cancer genomics data. Cancer
Discov 2, 401–404, doi: 10.1158/2159-8290.CD-12-0095 (2012).
46. Petranyi, G., Ryder, N. S. & Stutz, A. Allylamine derivatives: new class of synthetic antifungal agents inhibiting fungal squalene epoxidase. Science 224, 1239–1241 (1984).
47. Faergemann, J., Zehender, H., Jones, T. & Maibach, I. Terbinafine levels in serum, stratum corneum, dermis-epidermis (without stratum corneum), hair, sebum and eccrine sweat. Acta Derm Venereol 71, 322–326 (1991).
48. Ryder, N. S. Specific inhibition of fungal sterol biosynthesis by SF 86-327, a new allylamine antimycotic agent. Antimicrob Agents
Chemother 27, 252–256 (1985).
49. Vogelstein, B. & Kinzler, K. W. Cancer genes and the pathways they control. Nat Med 10, 789–799, doi: 10.1038/nm1087 (2004). 50. Buchwald, H. Cholesterol inhibition, cancer, and chemotherapy. Lancet 339, 1154–1156 (1992).
51. Zhuang, L., Kim, J., Adam, R. M., Solomon, K. R. & Freeman, M. R. Cholesterol targeting alters lipid raft composition and cell survival in prostate cancer cells and xenografts. J Clin Invest 115, 959–968, doi: 10.1172/JCI19935 (2005).
52. Casey, S. C. et al. Cancer prevention and therapy through the modulation of the tumor microenvironment. Semin Cancer Biol, doi: 10.1016/j.semcancer.2015.02.007 (2015).
53. Weinstein, I. B. Cancer. Addiction to oncogenes–he Achilles heal of cancer. Science 297, 63–64, doi: 10.1126/science.1073096 (2002). 54. Pati, D., Zhang, N. & Plon, S. E. Linking sister chromatid cohesion and apoptosis: role of Rad21. Mol Cell Biol 22, 8267–8277 (2002). 55. Yi, G., Sze, S. H. & Thon, M. R. Identifying clusters of functionally related genes in genomes. Bioinformatics 23, 1053–1060,
doi: 10.1093/bioinformatics/btl673 (2007).
56. Lindl, T. Zell- und Gewebekultur. (Spektrum Akademischer Verlag, 2002).
57. Prat, A. et al. Molecular features and survival outcomes of the intrinsic subtypes within HER2-positive breast cancer. J Natl Cancer
Inst 106, doi: 10.1093/jnci/dju152 (2014).
58. Gentleman, R. Bioinformatics and computational biology solutions using R and Bioconductor. (Springer Science + Business Media, 2005).
59. Nilsen, G. et al. Copynumber: Efficient algorithms for single- and multi-track copy number segmentation. BMC Genomics 13, 591, doi: 10.1186/1471-2164-13-591 (2012).
60. Carter, S. L. et al. Absolute quantification of somatic DNA alterations in human cancer. Nat Biotechnol 30, 413–421, doi: 10.1038/ nbt.2203 (2012).
61. Wickham, H. Ggplot2: elegant graphics for data analysis. (Springer, 2009).
62. Schroder, M. S., Culhane, A. C., Quackenbush, J. & Haibe-Kains, B. survcomp: an R/Bioconductor package for performance assessment and comparison of survival models. Bioinformatics 27, 3206–3208, doi: 10.1093/bioinformatics/btr511 (2011). 63. Venables, W. N., Ripley, B. D. & Venables, W. N. Modern applied statistics with S. 4th edn, (Springer, 2002).
Acknowledgements
G.Z. wishes to thank Dr. Bruna S Dalmasso and Dr. Pietro Blandini for their scientific insights and suggestions. G.Z. is supported by an Associazione Italiana per la Ricerca contro il Cancro (AIRC) “My First AIRC Grant” ID MFAG 10570. A.B. is supported by funds from Compagnia di San Paolo (R.O.L. 4405), by Fondazione CARIGE, by Associazione Italiana per la Lotta contro le Leucemie, i Linfomi e il Mieloma Multiplo (AIL), and by liberal donations from Merck-Serono S.p.A. and from Amgen S.p.A.. A.N. is supported by funds from Compagnia di San Paolo (R.O.L. 689), AIRC (#6108), the FP7 projects PANACREAS (grant agreement #256986) and ATHERO-B-CELL (grant agreement #602114), and from Fondazione Umberto Veronesi.
Author Contributions
G.Z. conceived and coordinated the project, designed experiments, performed statistical analyses, prepared figures, and wrote the manuscript. D.B. designed experiments, performed statistical analyses and prepared figures. I.C. designed and performed experiments and statistical analyses, and prepared figures. G.C., D.P. and A.G. designed and performed experiments. M.G. contributed to database keeping and performed statistical analyses. S.A. contributed to the conceptual development of the project. A.N. and A.B. contributed to the conceptual development of the project and designed experiments. All authors contributed to manuscript preparation.
Additional Information
Accession codes: Raw and log2 normalized data for array-CGH experiments are available in GEO (www.ncbi. nih.gov/projects/geo) under the accession number GSE71395.
Supplementary information accompanies this paper at http://www.nature.com/srep Competing financial interests: The authors declare no competing financial interests.
How to cite this article: Brown, D. N. et al. Squalene epoxidase is a bona fide oncogene by amplification with clinical relevance in breast cancer. Sci. Rep. 6, 19435; doi: 10.1038/srep19435 (2016).
This work is licensed under a Creative Commons Attribution 4.0 International License. The images or other third party material in this article are included in the article’s Creative Commons license, unless indicated otherwise in the credit line; if the material is not included under the Creative Commons license, users will need to obtain permission from the license holder to reproduce the material. To view a copy of this license, visit http://creativecommons.org/licenses/by/4.0/