I
UNIVERSITÀ DEGLI STUDI DI CATANIA
DIPARTIMENTO DI SCIENZE BIOLOGICHE, GEOLOGICHE E
AMBIENTALI
DOTTORATO DI RICERCA IN SCIENZE GEOLOGICHE,
BIOLOGICHE ED AMBIENTALI
XXXI CICLO
UNRAVELLING VOLCANIC TREMOR SOURCE
AT MOUNT ETNA FROM QUANTITATIVE
MULTIPARAMETRIC ANALYSIS AND MOMENT
TENSOR INVERSION
Giancarlo Spedalieri
Coordinatore:
Prof.ssa Agata Di Stefano
Tutor:
Co-Tutor:
Prof. Stefano Gresta
Prof. Andrea Cannata
Dott. Giuseppe Di Grazia
Dott. Luciano Zuccarello
i
Giancarlo SPEDALIERI
STUDIO DELLA SORGENTE DEL TREMORE VULCANICO AL MT. ETNA
MEDIANTE ANALISI QUANTITATIVA MULTIPARAMETRICA ED
INVERSIONE DEL TENSORE MOMENTO.
Abstract: L'interpretazione dei segnali sismici osservati in contesti vulcanici e la descrizione quantitativa dei meccanismi alla sorgente costituiscono gli obiettivi principali della moderna sismologia vulcanica.
Dalla fine degli anni '70, alcuni autori hanno dedicato la loro attività a comprendere le dinamiche ed i meccanismi alla sorgente in grado di generare sismicità a lungo periodo (sismicità LP). La sismicità LP include segnali sismici come il tremore vulcanico e gli eventi a bassa frequenza (eventi LP), caratterizzati da simile contenuto spettrale (0.2 – 5.0 Hz), imputabili alla dinamica dei fluidi magmatici e idrotermali. Il tremore è il segnale sismico più distintivo registrato in contesti vulcanici attivi, può durare minuti, ore, persino mesi o anni ed è possibile osservarlo sia durante fasi quiescenti che duranti fasi eruttive.
L’obiettivo principale di questa tesi è stato lo studio della sorgente del tremore vulcanico al vulcano Etna (Italia). A tale scopo, è stato analizzato il tremore vulcanico registrato durante l’intensa attività eruttiva sommitale verificatasi tra il 2011 ed il 2012. Negli anni in questione, i prodotti emessi a seguito di 25 eventi di fontane di lava hanno determinato la formazione di un nuovo cratere, il Nuovo Cratere di Sud Est (NSEC), a partire da un pit crater formatosi alla fine del 2009. Questo cratere si è andato a sommare a quelli già esistenti, ovvero il Cratere di Nord Est (NEC), il cratere Voragine (VOR), il cratere Bocca Nuova (BN) ed il Cratere di Sud Est (SEC, cratere alla cui base si è impostato il pit-crater precedentemente citato).
Grazie ai dati messi a disposizione dall’Istituto Nazionale di Geofisica e Vulcanologia – Sezioni di Catania (Osservatorio Etneo) e Palermo, la tesi in oggetto si è focalizzata su due differenti aspetti: i) lo studio multiparametrico basato sul
ii
confronto quantitativo tra il tremore vulcanico e dati geochimici come il flusso di CO2 al suolo e di SO2 ai crateri sommitali; ii) l’inversione del tensore momento del
tremore vulcanico registrato durante una delle fontane di lava del 2011.
Il confronto multiparametrico tra dati sismici e geochimici è stato effettuato al fine di individuare e stimare quantitativamente eventuali variazioni di trend analoghe tra le serie temporali poste a confronto, sia sincrone che caratterizzate da ritardi durante gli anni tra il 2011 ed il 2012. A tale scopo, sono state implementate quattro diverse tecniche d’analisi cioè la Correlazione (CC), la Cross-Correlazione Randomizzata (RCC), la Wavelet Coherence e Cross Power Spectrum (WC e CWS) e la regressione lineare (R2). I risultati ottenuti con l’analisi RCC hanno
messo in evidenza come variazioni nell’andamento del flusso di CO2 al suolo siano
analoghi a quelli evidenziati circa 35 giorni dopo nella serie temporale del tremore. Inoltre, variazioni nell’andamento della serie temporale del tremore vulcanico tendono a precedere di qualche giorno analoghe variazioni nel flusso di SO2 ai
crateri sommitali. Compatibilmente alle velocità di risalita stimate per i magmi etnei e considerando i risultati di analoghi confronti quantitativi effettuati precedentemente per altre fasi eruttive allo stesso vulcano, i risultati ottenuti hanno permesso di ipotizzare dinamiche di pressurizzazione e depressurizzazione del sistema di alimentazione superficiale durante le diverse fasi eruttive osservate nel periodo considerato.
Il secondo studio illustrato in questa tesi, invece, rappresenta una novità assoluta per il vulcano Etna: infatti, per la prima volta è stata affrontata un’analisi di inversione del tensore momento applicata al tremore vulcanico al fine di individuarne i parametri alla sorgente. Nello specifico, questa analisi è stata applicata al segnale sismico acquisito durante l’episodio di fontana di lava del 5 Agosto 2011, uno degli episodi più vigorosi tra i 25 che hanno caratterizzato il periodo 2011-2012.
L’analisi di inversione del tensore momento applicata al tremore vulcanico è stata effettuata in quattro step differenti. In primo luogo, al fine di limitare effetti di distorsione dovuti alla topografia, ad eterogeneità e a strutture superficiali,
iii
l’analisi di inversione è stata effettuata nella banda di frequenze 0.2 – 0.5 Hz, ovvero considerando soltanto il contenuto a basse frequenze del tremore vulcanico; dato che tale banda di frequenza è in parte coincidente con quella del microseism, è stato verificato che tale segnale di origine marina/oceanica fosse trascurabile durante l’episodio di fontana di lava in questione. Il secondo step, invece, è stato incentrato sulla necessità di considerare una sorgente puntiforme per l’analisi di inversione; a tale scopo, la localizzazione della sorgente è stata effettuata in due fasi: in primo luogo, (i) un volume delle probabili sorgenti del tremore è stato individuato mediante il metodo di localizzazione basato sul decadimento delle ampiezze, mentre (ii) la migliore soluzione puntuale all’interno di questo volume è stata effettuata mediante l’analisi della distribuzione spaziale dei misfit ottenuti con l’inversione del tensore momento. Con il terzo step, attraverso un'analisi di inversione “unconstrained” si è proceduto ad individuare il tipo di meccanismo sorgente per la fase parossistica dell’episodio di fontana di lava considerato. Infine, con l’ultimo step è stata eseguita un’analisi di inversione “constrained” al fine di confermare il meccanismo alla sorgente. L’analisi di inversione del tensore momento ha permesso di definire un meccanismo alla sorgente caratterizzato prevalentemente da una componente isotropica. I risultati ottenuti hanno permesso di evidenziare un meccanismo sorgente generato da un crack sub-orizzontale prossimo all'area del cratere sommitale, interpretabile come una valvola attraverso la quale il magma ricco in gas arriva in superficie durante l’episodio di fontana di lava.
I risultati ottenuti dal confronto tra serie temporali geofisiche e geochimiche e dall’analisi di inversione del tensore momento del tremore vulcanico non solo hanno permesso di ottenere informazioni sulle dinamiche che hanno caratterizzato il sistema di alimentazione superficiale del vulcano Etna durante l’attività del 2011-2012, ma hanno anche fornito importanti spunti di riflessione da approfondire con eventuali studi futuri.
I
TABLE
OF
CONTENTS
TABLE OF CONTENTS ... I
LIST OF FIGURES ... V
LIST OF TABLES ... XIV
SINTESI IN ITALIANO ... XV
CAPITOLO 1 ... XVI
CAPITOLO 2 ... XVI
CAPITOLO 3 ... XVII
CAPITOLO 4 ... XIX
ACKNOWLEDGEMENTS ... XX
ABSTRACT ... 1
INTRODUCTION ... 4
CHAPTER 1 - BACKGROUND AND STATE OF ART ... 9
1.1 Volcano seismicity ... 10
1.1.1 Transient volcano-seismic signals ... 10
1.1.2. Continuous volcanic-seismic signals ... 19
II
1.2.1 Geological framework ... 21
1.2.2 Geodynamic framework ... 24
1.2.3 Structural framework ... 28
1.2.4 Volcanic tremor at Mt. Etna ... 31
1.2.4.1 Seismic Monitoring network ... 32
1.2.5 Volcanic framework during 2011-2012 activity ... 33
1.3 Methods of analysis routinely performed to monitor volcanic
tremor at Mt. Etna ... 37
CHAPTER 2 – MULTIPARAMETRIC APPROACH FOR
QUANTITATIVE COMPARISON OF VOLCANOLOGICAL TIME
SERIES ... 45
2.1 Introduction ... 46
2.2 Methods of analysis for time series quantitative comparison .. 48
2.2.1 Cross Correlation (CC) ... 49
2.2.2 Randomized Cross Correlation (RCC) ... 50
2.2.3 Wavelet Coherence (WC) and Cross Wavelet Spectrum (CWS) .. 52
2.2.4 Linear regression and coefficient of determination (LR) ... 54
2.3 Data ... 56
2.3.1 Geophysical data ... 56
2.3.1.1 Seismic data ... 56
2.3.2 Geochemical data ... 58
2.3.2.1 Soil CO2 flux ... 58
III
2.4 Data analysis ... 62
2.4.1 RMS amplitude of seismic signals vs soil CO2 flux ... 62
2.4.2 RMS amplitude of seismic signals vs SO2 flux at summit craters 67
2.5 Discussion and conclusions ... 74
2.6 Suggested future work ... 78
CHAPTER 3 – MOMENT TENSOR INVERSIONS OF MT. ETNA
VOLCANIC TREMOR DURING LAVA FOUNTAINING: THE CASE
STUDY OF 05 AUGUST 2011 EVENT ... 80
3.1 Source models and characterization of LP seismic signals ... 81
3.1.1 Source model and trigger mechanism for LP seismicity ... 81
3.1.1.1 The crack model ... 82
3.1.1.2 Self-sustained oscillations ... 83
3.1.1.3 Magmatic-hydrothermal interactions ... 86
3.1.1.4 Magmatic degassing ... 88
3.1.1.5 Brittle fracture of melt ... 89
3.1.1.6 Solid extrusion dynamics and plug stick-slip... 90
3.1.1.7 Slow-rupture earthquake ... 92
3.1.2 Seismic Sources characterization of LP seismicity ... 93
3.1.2.1 The inverse problem ... 93
3.1.2.2 The source function s(t) ... 97
3.1.2.3 The Moment Tensor Inversion ... 102
3.1.2.4 The medium function g(t) ... 113
3.1.3 Distortion effects due to topography, heterogeneity and near surface velocity structure ... 114
IV
3.1.4 The Green’s function library for volcanic tremor on Mt. Etna .. 117
3.1.5 Location of volcanic tremor source ... 120
3.2 Moment Tensor Inversion of Mt. Etna volcanic tremor data of 5
August 2011 lava fountaining event ... 121
3.2.1 Introduction ... 121
3.2.2 The paroxysmal event of 5 August 2011 event at Mt. Etna ... 122
3.2.3 The influence of microseism ... 123
3.2.4 Location of volcanic tremor ... 127
3.2.5 Volcanic tremor source inversion ... 130
3.2.6 Discussion and conclusions ... 140
3.2.7 Suggested future work ... 145
CHAPTER 4 – CONCLUSIONS ... 147
4.1 General summary ... 148
4.2 Suggested future work and perspectives ... 151
V
LIST
OF
FIGURES
Figure 1.1. VT-A type event recorded at Mt. Merapi, Indonesia. The impulsive P- and
S-wave arrivals are clearly visible in this signal, as well as their high-frequency content and short signal duration. The given color coding, representing normalized amplitude spectral density, is valid for all following figures. Also, the amplitudes of the corresponding amplitude-time representation are in arbitrary units and when given are normalized to the amplitude shown in this figure (from Wassermann, 2012). ... 11
Figure 1.2. Typical example of a VT-B type event recorded during a high activity phase at
Mt. Merapi. Note that the overall frequency content is mainly between 1 – 10 Hz with a dominant frequency at roughly 3 Hz (from Wassermann, 2012). ... 12
Figure 1.3. Two different models describing the occurrence of VT –A/B in active volcanoes.
While some VT events are simply caused by reactivation of existing faults by the increasing stress due to magma ascent, the other possible mechanism is directly linked to the emplacement of the magma in the feeder system and the associated tensile faulting. In this picture, the difference between VT-A and VT-B is simply their location with respect to a high scattering region (from Wassermann, 2012). ... 13
Figure 1.4. Example of a LF-wave group recorded at Mt. Merapi. Clearly the dominant
frequency is around 1 Hz (from Wassermann, 2012). ... 14
Figure 1.5. Example of a LF event recorded at two different sites located at Redoubt
volcano, Alaska. The spindle shaped signal is also known as Tornillo. (from Wassermann, 2012). ... 15
Figure 1.6. a) shows a Hybrid event and b) a VT-B event for comparison. The higher
frequencies at the beginning of the Hybrid event are an obvious feature, while the later part shows the similarity with the VT-B event (from Wassermann, 2012). ... 15
Figure 1.7. MP-event recorded at Mt. Merapi during strong dome formation. The
frequency content is restricted between 3 - 10 Hz and resembles that of a VT-B type event at this volcano. (from Wassermann, 2012)... 17
VI
Figure 1.8. An explosion signal recorded at Stromboli volcano, Italy. The seismic station
was located just 400 m from the active vent. The dashed line gives a rough estimate of the onset of a sonic wave also visible as high (red) amplitudes in the time-frequency plot around 5 Hz (from Wessermann, 2012). ... 18
Figure 1.9. (a, b) Geographical position of Mt. Etna volcano. (c) Digital Elevation Model
(DEM) of Mt. Etna volcano. (d) DEM with summit area in detail. ... 20 Figure 1.10. Schematic representation of Etna volcano evolutionary phases: a) Basal
Tholeiitic phase; b) Timpe phase; c) Valle del Bove Centers phase, circle indicate the
location of the volcanoes: td=Tarderia, rc=Rocche, tr=Trifoglietto, gg=Giannicola; sa=Salifizio, cv=Cuvigghiuni; d) Stratovolcano phase (from Branca et al., 2004). ... 21 Figure 1.11. Scheme of the outcropping deposits of the four phases of volcanism on Mt.
Etna volcano. (from Branca et al., 2011b). ... 23
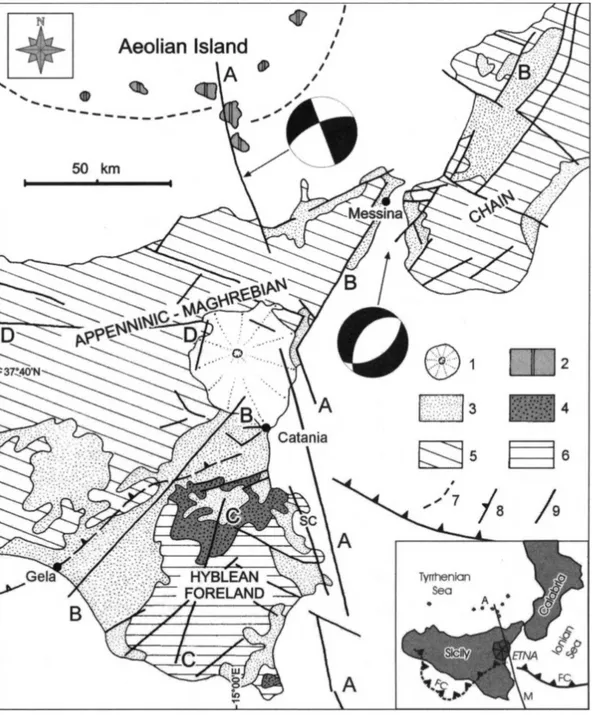
Figure 1.12. Structural setting of central Mediterranean Sea (from Lentini et al., 2006) and
location of Mt Etna. ... 25
Figure 1.13. Structural sketch map of eastern Sicily and southern Calabria (from Bousquet
and Lanzafame, 2004) ... 26
Figure 1.14. Three-dimensional sketch of the South Tyrrhenian subduction zone. Red lines
represent magma rising from the top of the slab to the arc. Black arrows represent local patterns of mantle flow driven by slab motion. Notice that Etna is located outside the Aeolian arc and above a sideways mantle flow coming from under the African plate. a. A
view toward the southeast from a point above the Tyrrhenian Sea. b. A view south and
upward from a point under the Tyrrhenian plate (from Gvirtzman and Nur, 1999). ... 28
Figure 1.15. Tectonic sketch map of Mt. Etna defined by structures with morphological
expression. Fault abbreviations: PF, Pernicana; RF, Ragalna; CF, Calcerana; TMF, Tremestieri; TCF, Trecastagni; FF, Fiandaca; ARF, Acireale; STF, S. Tecla; MF, Moscarello; SLF, S. Leonardello; RF, Ragalna; RP, Ripe della Naca; PD, Piedimonte; CL, Calatabiano. The arrows indicate the strike-slip component, the contour of the rift zones is in red (from Azzaro et al., 2013). ... 29
VII
Figure 1.16. Main kinematic domains of Mount Etna volcano (from Bonforte et al., 2011).
... 30
Figure 1.17. Digital Elevation Model of Mt. Etna with the location of the broadband
seismic stations. The digital elevation model in the upper left corner shows the distribution of the five summit craters (VOR Voragine, BN Bocca Nuova, SEC Southeast Crater, NEC Northeast Crater and the New SEC (NSEC), indicated by the red dot. The black concentric lines in (a, b) are altitude contour lines from 1 to 3 km a.s.l. with spacing of 1 km (from Cannata et al., 2013). ... 33
Figure 1.18. Plot summarizing the eruptive activity during 2011-2012 at Voragine (VOR),
Bocca Nuova (BN), North East Crater (NEC), South East Crater (SEC) and New South East Crater (NSEC). (Viccaro et al., 2014 - mod.) ... 36
Figure 2.1. Synthetic signals obtained by summing Ricker wavelets with random red noise.
The second Ricker wavelet (red) precedes the first one (blue) by 100 samples. ... 48
Figure 2.2. (above) Contour showing the time on the 𝑥𝑥-axis (in samples), the lag between
the two signals in the 𝑦𝑦-axis and the cross-correlation coefficient with the color scale (see colorbar). (below) Cross correlation coefficient (“CCC”, blue dots) and corresponding time
lags (red dots) calculated for different consecutive signal windows (the empty dots represent values with cross correlation lower than 0.9). ... 50
Figure 2.3. (above) Two synthetic signals. (below) Cross correlation function between the
two signals shown above (black thin line), cross correlation values obtained by randomizing the sample order of the second signal (green dots), 99% (±3σ) confidence bounds on the distribution of the cross-correlation values (black dots). ... 51
Figure 2.4. (above) Two synthetic signals, (center) wavelet coherence and (bottom)
cross-wavelet spectrum. The 5% significance level against red noise is shown as a thick contour. The vectors indicate the phase difference between the synthetic signals (a horizontal arrow pointing from left to right signifies in phase and an arrow pointing vertically upward means the first series lags the second one by 90°). The cone of influence (COI), where the edge effects might distort the picture, is shown as a lighter shade. The figures were drawn by the cross-wavelet and wavelet coherence software provided by A. Grinsted. ... 53
VIII
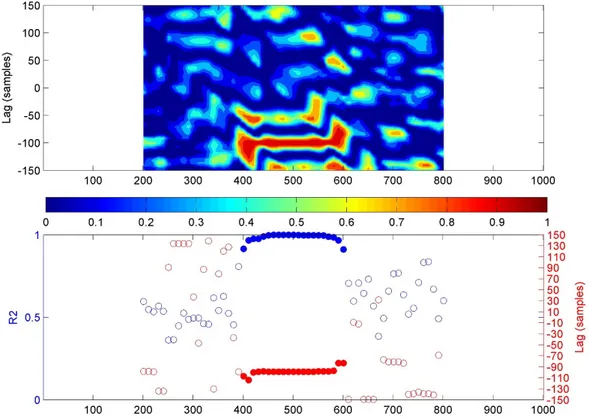
Figure 2.5. (above) Contour showing the time on the x-axis, the lag between the two
signals in the 𝑦𝑦-axis and the R2 with the color scale (see colorbar). (below) R2 (blue dots)
and corresponding time lags (red dots) calculated for different consecutive signal windows (the empty dots represent values with R2 lower than 0.9). ... 55
Figure 2.6. Digital Elevation Model (DEM) of the summit area of Mt. Etna with the main
craters (Bocca Nuova: BN; Voragine: VOR; Cratere di Nord-Est: NEC; Cratere di Sud-Est: SEC; Nuovo Cratere di Sud-Est: NSEC) (a) and DEM of Mt. Etna with seismic stations (b)
... 57
Figure 2.7. RMS amplitude of seismic signals recorded at vertical component of EBEL
station during the years between 2010 - 2012 and filtered in the band 0.5-2.5 Hz. ... 57
Figure 2.8. DEM of the summit area of Mt. Etna with the main craters (Bocca Nuova: BN;
Voragine: VOR; Cratere di Nord-Est: NEC; Cratere di Est: SEC; Nuovo Cratere di Sud-Est: NSEC) (a) and DEM of Mt. Etna with geochemical stations measuring soil CO2 flux (b)
... 58
Figure 2.9. Daily soil CO2 flux measurements by EtnaGas geochemical network of Mt. Etna
from January 2010 to December 2012. Yellow, orange and red dots represent lava fountaining during Phase I, Phase II and Phase III, respectively. ... 59
Figure 2.10. DEM of Mt. Etna with the geochemical stations belonging to the FLAME
network ... 60
Figure 2.11. Daily SO2 flux measurements from the bulk volcanic plume of Mt. Etna from
January 2010 to December 2012. Yellow, orange and red dots represent lava fountaining during Phase I, Phase II and Phase III, respectively. ... 60
Figure 2.12. Cross correlation analysis between RMS amplitude at vertical component of
EBEL station and soil CO2 flux recorded at Mt. Etna from January 2010 to December 2012.
(above) Contour showing the time on the 𝑥𝑥-axis (in samples), the lag between the two
signals in the 𝑦𝑦 -axis and the cross-correlation coefficient with the color scale (see colorbar). (below) Cross correlation coefficient (“CCC”, blue dots) and corresponding time
lags (red dots) calculated for different consecutive signal windows (the empty dots represent values with cross correlation lower than 0.6). ... 63
IX
Figure 2.13. (above) Time series: RMS amplitude at vertical component of EBEL station
(blue line) vs. soil CO2 flux (black line) recorded at Mt. Etna from January 2010 to
December 2012. (below) Cross correlation function between the two signals shown above
(black thin line), cross correlation values obtained by randomizing the sample order of soil CO2 flux time series (green dots), 99% (±3σ) confidence bounds on the distribution of the
cross-correlation values (black dots). ... 64
Figure 2.14. (above) Time series compared: RMS amplitude at vertical component of EBEL
station (blue line) vs. soil CO2 flux (black line) recorded at Mt. Etna from January 2010 to
December 2012, (center) wavelet coherence and (bottom) cross-wavelet spectrum. The
5% significance level against red noise is shown as a thick contour. The vectors indicate the phase difference between the time series (a horizontal arrow pointing from left to right signifies in phase and an arrow pointing vertically upward means the first series lags the second one by 90°). The cone of influence (COI), where the edge effects might distort the picture, is shown as a lighter shade... 65
Figure 2.15. Plots in details of (a) wavelet coherence analysis and (b) cross-wavelet
spectrum analysis. The 5% significance level against red noise is shown as a thick contour. The vectors indicate the phase difference between the time series (a horizontal arrow pointing from left to right signifies in phase and an arrow pointing vertically upward means the first series lags the second one by 90°). The cone of influence (COI), where the edge effects might distort the picture, is shown as a lighter shade. ... 66
Figure 2.16. (above) Contour showing the time on the x-axis, the lag between the two
temporal series in the 𝑦𝑦-axis and the R2 with the color scale (see colorbar). (below) R2
(blue dots) and corresponding time lags (red dots) calculated for different consecutive signal windows (the full dots represent values with R2 lower than 0.9). ... 67
Figure 2.17. Cross correlation analysis between RMS amplitude at vertical component of
EBEL station and SO2 flux at summit craters recorded at Mt. Etna from January 2010 to
December 2012. (above) Contour showing the time on the 𝑥𝑥-axis (in samples), the lag
between the two time series in the 𝑦𝑦-axis and the cross-correlation coefficient with the color scale (see colorbar). (below) Cross correlation coefficient (“CCC”, blue dots) and
corresponding time lags (red dots) calculated for different consecutive signal windows (the empty dots represent values with cross correlation lower than 0.6). ... 68
X
Figure 2.18. (above) Time series compared: RMS amplitude at vertical component of EBEL
station (blue line) vs. SO2 soil flux (black line) recorded at Mt. Etna from January 2010 to
December 2012. (below) Cross correlation function between the two signals shown above
(black thin line), cross correlation values obtained by randomizing the sample order of SO2
flux time series (green dots), 99% (±3σ) confidence bounds on the distribution of the cross-correlation values (black dots). ... 70
Figure 2.19. (above) Time series compared: RMS amplitude at vertical component of EBEL
station (blue line) vs. SO2 flux at summit craters (black line) recorded at Mt. Etna from
January 2010 to December 2012, (center) wavelet coherence and (bottom) cross-wavelet
spectrum. The 5% significance level against red noise is shown as a thick contour. The vectors indicate the phase difference between the time series (a horizontal arrow pointing from left to right signifies in phase and an arrow pointing vertically upward means the first series lags the second one by 90°). The cone of influence (COI), where the edge effects might distort the picture, is shown as a lighter shade. ... 71
Figure 2.20. Plots in details of (a) wavelet coherence analysis and (b) cross-wavelet
spectrum analysis. The 5% significance level against red noise is shown as a thick contour. The vectors indicate the phase difference between the time series (a horizontal arrow pointing from left to right signifies in phase and an arrow pointing vertically upward means the first series lags the second one by 90°). The cone of influence (COI), where the edge effects might distort the picture, is shown as a lighter shade. ... 72
Figure 2.21. (above) Contour showing the time on the x-axis, the lag between the two
temporal series in the 𝑦𝑦-axis and the R2 with the color scale (see colorbar). (below) R2
(blue dots) and corresponding time lags (red dots) calculated for different consecutive signal windows (the full dots represent values with R2 lower than 0.9). ... 73
Figure 3.1. Geometry of the fluid-filled crack model described by Chouet (1986, 1988) 83 Figure 3.2. Model of the generation of volcanic tremor (Julian, 1994 – mod.). Viscous,
incompressible fluid flows in 𝑥𝑥 direction from upstream (bottom) to downstream (top) reservoir through a channel of length 𝐿𝐿 with imperfectly elastic walls (springs and dashpots represent these properties). The model is two-dimensional; all motion occurs in
XI
the 𝑥𝑥𝑦𝑦 plane and is independent of 𝑧𝑧. The dynamical variables are the channel thickness ℎ(𝑡𝑡) and the fluid flow speed 𝑣𝑣(𝑥𝑥, 𝑡𝑡). ... 84
Figure 3.3. Schematic view of the source process of LP events at Kusatsu-Shirane Volcano.
(Nakano et al., 2003) ... 87
Figure 3.4. Cartoon illustrating the conceptual stick–slip model of Iverson et al. (2006) and
Iverson (2008). A constant flux of magma pushes on a rigid plug of solidified magma occupying the upper ~0.5 km of conduit. Extrusion is resisted by the frictional force at the conduit wall and plug weight. Earthquakes result from incremental slip along the plug margins (see Iverson et al., 2006 for details). Figure reproduced from Iverson et al. (2006). ... 91
Figure 3.5. Scaling of long-period seismic moment magnitude versus corner frequency.
The amplitude spectra of 1,150 long-period events, recorded in March 2004 at Mount Etna near-summit station (ECPN) are fitted with 𝜔𝜔2 source model, to determine the corner frequency. The y axis is proportional to the seismic moment. The thin line is best fitting with slope -2.2; the thick line has slope -3 and is broadly consistent with the data. (Reproduced from Bean et al., 2014). ... 93
Figure 3.6. Combinations of double couple equivalent body forces and fault geometry.
Double couple are used to avoid net torque or rotation of the fault, taken from Aki and Richards, (2002). In this scheme, 1 represents the 𝑥𝑥 direction, 2 the 𝑦𝑦 direction and 3 the 𝑧𝑧 direction. ... 98
Figure 3.7. Representation of single couples and dipoles oriented in different directions
(Stein and Wysession, 2003). ... 99
Figure 3.8. Representation of double couple along the 𝑥𝑥𝑦𝑦 direction (Stein and
Wysession,2003). ... 99
Figure 3.9. Representation of single force along the 𝑥𝑥 direction (Stein and
XII
Figure 3.10. Representation of an explosive source using a triple dipole as equivalent body
forces, (energy is equally radiated in all directions). Figure reproduced from Stein and Wysession (2003). ... 106
Figure 3.11. Representation of a slip fault using double couple as equivalent body forces.
Figure reproduced from Stein and Wysession (2003). ... 107
Figure 3.12. P-wave and S-wave radiation patterns and relative moment tensors for
different seismic source types. ... 109
Figure 3.13. Coordinate system used to define crack and pipe orientation (De Barros et
al., 2011). ... 112
Figure 3.14. Cubic elastic scheme, taken from O’Brien and Bean (2004). Each dot
represents the lattice node. Each node is connected to 18 more, by springs and a bond-bending force which is proportional to the angle between adjacent particles. ... 118
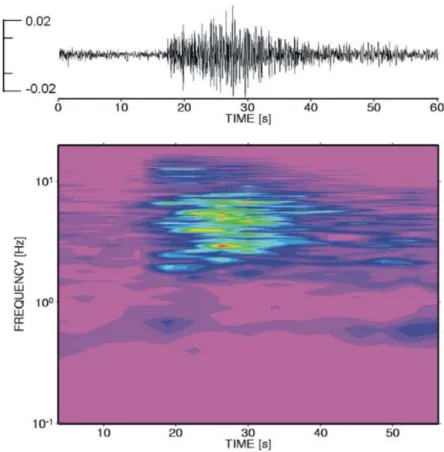
Figure 3.15. Lava fountaining at Mt. Etna of 5 August 2011. (above) Seismic signal
recorded at vertical component of ECPN station during 2-hour long episode, and spectral analysis with results of Normalised Short Time Fourier Transform (center) and peak
frequency (bottom) of seismic signal considered. ... 122 Figure 3.16. Comparison between among different time series, obtained for the whole
2011 and characterized by daily data. a. Significant Wave Height at Catania buoy (by
RON-ISPRA). b. Local speed wind at Catania meteorological station (RMN-ISPRA). c. RMS
amplitude of seismic signal recorded at vertical component of EPOZ station, filtered at low-frequencies band (0.05 – 0.0769 Hz: blue line; 0.1 – 0.2 Hz: black line; 0.2 – 0.4 Hz: red line). The top gray continuous lines and square markers represent periods of eruptive activity and lava fountains, respectively. The red vertical line with the top red square marks the occurrence of 5 August 2011 lava fountaining. ... 126
Figure 3.17. Comparison between time series, obtained for 5 August 2011 and
characterized by hourly data. a. Significant Wave Height at Catania buoy (by RON-ISPRA). b. Local speed wind at Catania station (RMN-ISPRA). Red thick continuous lines represent
XIII
Figure 3.18. Digital elevation model of Mt. Etna with the location of 3-component seismic
stations used to study volcanic tremor source. ... 128
Figure 3.19. Volcanic tremor source location during 5 August lava fountaining at Mt. Etna,
considering 10-minutes-long sliding time windows and 0.2 – 0.5 frequency band. Red dot represents the location during the peak amplitude, while black and blue dots represent locations pre- and post- peak amplitude phases, respectively. ... 129
Figure 3.20. Distribution of misfit at nodes of ELM considering MT + F solutions for
volcanic tremor source during max peak amplitude of seismic signals for 05 August lava fountaining episode. “Best-fit” represent the node with lower value of misfit that we fixed such as the source of volcanic tremor for MTI analysis. “trem_loc”, instead, represent source position of volcanic tremor by amplitude decay method for the same time window. Finally, “NSEC” represent the position of New South-East Cone. ... 133
Figure 3.21. Moment Tensor Inversion results for volcanic tremor at Mt. Etna recorded
during 22:14:10 – 22:15:50 GMT of 05 August 2011: source time function obtained by the unconstrained inversion considering (a) Moment Tensor + Single Forces (MT+F) and (b)
Moment Tensor only (MT). ... 135
Figure 3.22. Waveform (displacement) fit between the data (continuous lines) and the
synthetic seismograms (dashed lines) for the volcanic tremor at Mt. Etna recorded during time interval of 22:14:10 – 22:15:50 GMT of 05 August 2011. ... 136
Figure 3.23. Eigenvectors obtained from the MT+F unconstrained inversion solutions for
the volcanic tremor at Mt. Etna recorded during the time interval of 22:14:10 – 22:15:50 GMT on 05 August 2011. Eigenvectors are sampled every 0.03 s (x = E-W, positive towards the East; y = N-S, positive towards the Nord; z = U-D, positive towards the Up). ... 138
Figure 3.24. Results of the decomposition for the inversion of all tremor windows (MT+F
solution) are shown. The gray, blue and orange dots indicate the percentage of ISO, CLVD and DC components, respectively. ... 139
Figure 3.25. Normal axis orientation of deviatoric component for the inversion of all the
tremor windows (MT+F solution). The blue and orange dots represent the values of azimuth ϕ and dip θ, respectively. ... 140
XIV
LIST
OF
TABLES
Table 1.1. Timing of the various eruptive activities recognized for each episode and
duration both of the lava fountaining phases and the full episodes. (Behncke et al., 2014 - mod.) ... 35
Table 3.1. Location of volcanic tremor source during the peak amplitude phase. ... 130 Table 3.2. Misfit and AIC values for different unconstrained inversions (MT and MT+F),
XV
SINTESI
IN
ITALIANO
STUDIO DELLA SORGENTE DEL TREMORE VULCANICO AL MT.
ETNA MEDIANTE ANALISI QUANTITATIVA MULTIPARAMETRI-CA
ED INVERSIONE DEL TENSORE MOMENTO.
XVI
CAPITOLO
1
Il primo capitolo di questa tesi espone gli argomenti relativi alle conoscenze di base necessarie al fine di condurre il duplice studio del tremore vulcanico presentato con questo elaborato. Nello specifico, si compone di tre parti: la prima parte introduce brevemente la sismicità vulcanica, la seconda parte, invece, descrive il vulcano Etna, mentre la terza parte è dedicata ad una descrizione dei metodi di base per lo studio del tremore vulcanico registrato al vulcano Etna. L’introduzione alla sismicità vulcanica oggetto della prima parte descrive le diverse tipologie di segnali sismici che è possibile osservare nei pressi di un vulcano attivo; sulla base degli studi più recenti, è stata effettuata una descrizione dei segnali sismo-vulcanici, tra cui il tremore vulcanico.
La descrizione del vulcano Etna, oggetto della seconda parte è stata effettuata prendendo in esame i più recenti studi al fine di mostrarne le principali caratteristiche geologiche, strutturali e geodinamiche; particolare attenzione, inoltre, è stata dedicata sia alla descrizione delle caratteristiche e delle modalità di acquisizione dei dati relativi al tremore vulcanico, sia alla descrizione della recente attività, specie per quanto riguarda l’attività eruttiva osservata tra il 2011 ed il 2012.
Infine, la terza parte è stata dedicata alla descrizione delle metodologie d’analisi per la caratterizzazione del tremore vulcanico come ampiezza, contenuto spettrale e localizzazione della sorgente.
CAPITOLO
2
Il secondo capitolo di questa tesi è dedicato al primo dei due studi sul tremore vulcanico effettuati nell’ambito delle attività del Dottorato di Ricerca, ovvero lo studio multiparametrico dell’attività al vulcano Etna tra il 2011 ed il 2012. A tale scopo, dopo una breve descrizione della letteratura concernente diversi casi
XVII
studio analoghi sia al vulcano Etna che in altri contesti vulcanici, ci si è focalizzati sui diversi step in cui è stato articolato il confronto tra la serie temporale del tremore vulcanico ed altre serie temporali acquisite durante lo stesso intervallo temporale. In primo luogo, sono state descritte le quattro tecniche d’analisi differenti scelte per il confronto quantitativo, ovvero la Cross-Correlazione (CC), la Cross-Correlazione Randomizzata (RCC), la Wavelet Coherence e Cross Power Spectrum (WC e CWS) e la regressione lineare (R2). Successivamente, è stata
effettuata una selezione dei dati geofisici (sismici e geodetici) e geochimici (flussi di gas vulcanici e rapporti tra flussi di gas emessi ai diversi crateri sommitali) messi a disposizione dall’Istituto Nazionale di Geofisica e Vulcanologia per il confronto quantitativo delle serie temporali. Successivamente, a causa di periodi in cui l’acquisizione dei dati di alcuni parametri non è stata possibile durante il periodo considerato, le analisi effettuate con i dati a disposizione hanno restituito dei risultati significativi soltanto nel caso dei confronti tra la serie temporale del tremore vulcanico e le serie geochimiche del flusso di gas vulcanici come CO2 al
suolo e flusso di SO2 al plume. Nello specifico, mediante analisi RCC è stato
possibile evidenziare come, rispetto alla serie temporale del tremore, analoghe variazioni di trend siano riscontrabili circa 35 giorni prima nel flusso di CO2 al suolo
e circa 50 giorni dopo nel flusso di SO2 ai crateri sommitali. Ciò ha permesso di
ipotizzare sia dinamiche caratterizzate da pressurizzazione durante le fasi non eruttive e depressurizzazione durante le fasi eruttive del sistema di alimentazione dell’Etna tra la seconda metà del 2010 e la prima metà del 2012, sia di stimare le modalità ed i tempi di risalita dei fluidi vulcanici durante il periodo in questione.
CAPITOLO
3
Il terzo capitolo di questa tesi espone il secondo dei due studi effettuati, ovvero l’Inversione del Tensore Momento (MTI) del tremore vulcanico registrato all’Etna durante la fontana di lava del 5 agosto 2011. Lo studio in questione costituisce una
XVIII
novità assoluta per il vulcano Etna: infatti, si tratta del primo caso in cui un’analisi di inversione delle forme d’onda complete viene applicata al fine di individuare il meccanismo sorgente (tensore momento) del tremore registrato al vulcano in questione; allo stato attuale, l’analisi MTI applicata al tremore vulcanico registrato al vulcano Arenal (Costa Rica) rappresenta l’unico precedente descritto in letteratura.
La prima parte di questo capitolo descrive brevemente la letteratura concernente lo stato dell’arte in materia di caratterizzazione delle dinamiche e dei meccanismi alla sorgente in grado di generare la sismicità a lungo periodo (LP). Oltre ad illustrare i diversi modelli proposti da diversi autori per spiegare l’origine della sismicità LP alla sorgente, in questa prima parte è stata affrontata anche la trattazione matematica della procedura di inversione adottata con questo studio, nonché la descrizione sia dei limiti di questa metodologia sia della libreria delle “Green’s functions” per la rappresentazione matematica della propagazione delle onde sismiche nella porzione superficiale dell’edificio vulcanico etneo.
La seconda parte di questo capitolo, invece, è incentrata sulla descrizione dell’analisi MTI effettuata, con particolare attenzione al principale limite di questa metodologia, cioè la limitata definizione del modello di velocità delle onde sismiche nel mezzo; avendo focalizzato l’analisi MTI sulla componente a bassa frequenza del tremore vulcanico (0.2 – 0.5 Hz), particolare attenzione è stata dedicata sia alla localizzazione della sorgente del tremore mediante il metodo di decadimento delle ampiezze, sia alla possibile influenza dovuta al microseism. Alla fine di questa parte, inoltre, sono stati presentati i risultati ottenuti. L’analisi MTI effettuata ha permesso di ottenere un crack sub-orizzontale con una prevalente componente isotropa come meccanismo sorgente del tremore vulcanico considerato, interpretabile come una valvola attraverso cui il magma ricco di gas viene emesso nell'atmosfera durante l’attività di fontana di lava.
XIX
CAPITOLO
4
Il capitolo 4, ultimo capitolo di questa tesi, oltre a riassumere i principali risultati ottenuti mediante il duplice studio effettuato, espone una serie di considerazioni e suggerimenti per eventuali lavori futuri concernenti studi analoghi.
XX
XXI
The PhD training course at University of Catania gave me a great opportunity and I am very grateful to many people who have contributed to my research activity during the last three years.
First of all, I am deeply grateful to my supervisor Professor Stefano Gresta. I’m honored to have had the opportunity to be introduced into the field of volcano seismology from him. His supervision and his advice in the PhD training course were fundamental.
I would like to thank my tutors, Professor Andrea Cannata, Dr. Giuseppe Di Grazia and Dr. Luciano Zuccarello, their contributions were essential in the development of my PhD studies. They supported me with great scientific enthusiasm and their wide scientific knowledge. I especially thank Professor Andrea Cannata, with his professionalism, his attitude in research and his infinite patience supported me constantly during all phases of doctoral research and writing of this thesis.
I am very grateful to Catania and Palermo Sections of INGV that gave me the chance to work on volcanic monitoring data. I am indebted to all technicians and researchers who have worked on the seismic and geochemical data used for the studies of this thesis.
I am grateful to Drs. Francesca Bianco of the INGV of Naples and Gilberto Saccorotti of the INGV of Florence for the reviews. Their comments were important to improve the originality of this thesis and gave me the opportunity for further investigations and discussion.
I thank the colleague Salvo Moschella for helped me with the significant wave height data used with this thesis.
I would like to thank my PhD coordinator Prof. Agata Di Stefano, for the constant support to the training and all the aspects associated at PhD training program. An invaluable thanks goes to my family, in particular to my parents who gave me motivation and support to overcome all the difficulties in these last years.
Finally, an invaluable thanks also goes to Maricla for her love, her support, her patience, for helping me to improve every day from every point of view, to believe in me and in my abilities.
1
1 ABSTRACT
2
2 ABSTRACT
UNRAVELLING VOLCANIC TREMOR SOURCE AT MOUNT ETNA FROM QUANTITATIVE MULTIPARAMETRIC ANALYSIS AND MOMENT TENSOR INVERSION
Developments of multiparametric monitoring networks, real time analysis techniques and the acquisition of high-resolution data, have allowed to improve the knowledge of the structures and dynamics that characterize the active volcanoes. To understand the dynamics of an active volcano, it is possible to proceed with two different types of studies: i) multiparametric studies based on the joint analysis of different data (such as geophysical, geochemical, petrological data); ii) detailed studies concerning specific data. In order to understand source volcanic tremor at Mt. Etna volcano, volcanic tremor recorded during the vigorous summit of 2011-2012 was analyzed. In particular, this thesis shows the results obtained from the investigation of the volcanic tremor source through a duplex study: i) a multiparametric study based on the quantitative comparison between different time series such as volcanic tremor amplitudes and geochemical data such as soil CO2 flux and the SO2 flux at summit craters; ii) a moment tensor inversion analysis of
volcanic tremor recorded during a lava fountain episode of the considered period. For these studies, data acquired from the multiparametric monitoring network managed by Istituto Nazionale di Geofisica e Vulcanologia were used.The quantitative comparison between seismic and geochemical data was performed in order to identify and quantitatively estimate similar trends variations between the compared time series, both synchronous and characterized by time lags. To this end, four different analysis techniques have been implemented, such as Correlation, Randomized Cross-Correlation, wavelet analysis and linear regression. The obtained results allowed to infer pressurization and depressurization dynamics of the plumbing system during the different eruptive phases observed during the considered period. The moment tensor inversion analysis of the volcanic tremor recorded at Mt. Etna represents a novelty. Specifically, this analysis was applied to volcanic tremor recorded during the lava fountain episode that occurred on 5 August 2011, one of the most vigorous of the 25 episodes that characterized the 2011-2012 period. The results allowed to highlight a source mechanism generated by a sub-horizontal crack near the summit crater area, which can be interpreted as a valve through which gas-rich magma is ejected during the lava fountain activities.
Keywords: seismology, Mt. Etna volcano, volcanic tremor, lava fountains,
3
3 ABSTRACT
4
4 INTRODUCTION
5
5 INTRODUCTION
Volcanology is a multidisciplinary science that deals with the study of volcanoes based on the principles of different aspects of Earth Sciences, such as geology, geophysics and geochemistry. For this reason, the monitoring and surveillance of active volcanoes require the study of various types of geological, geochemical, and geophysical data. Each type of data (such as measurements of seismic signals, gas fluxes, ground deformation, temperature, gravity, etc) provides information about physical processes which may be related to movement of molten rock or other eruption precursory phenomena (McNutt et al., 2000).
In the last two decades, improvements in computerized acquisition, real time analysis systems, and more precise and higher quality data, have allowed to improve the knowledge about the structures and dynamics that characterize active volcanoes.
Generally, starting from the acquired monitoring data at a volcano, to understand the active dynamics it is possible to proceed through two different types of studies: i) multidisciplinary study based on the joint analysis of different data (such as geophysical, geochemical, petrological data), or ii)detailed studies concerning a specific type of acquired data.
Mount Etna volcano (Italy) is one of the most active and monitored volcanoes in the world, characterized by the continuous acquisition of different geophysical and geochemical data. The rapid evolution of the eruptive dynamics that characterizes this volcano and the multiparametric monitoring network, managed by the “Istituto Nazionale di Geofisica e Vulcanologia (INGV)”, allow us to consider Mt. Etna as a natural laboratory.
In the following chapters of this thesis the results, obtained with by the study of the activity that occurred at Mt. Etna during the 2011-12 period, will be presented. These years were characterized by an intense activity showing 25 paroxysmal episodes at the New South-East Crater (NSEC), each one reaching lava fountains at the climax of the activity.
The initial phases of the study concerned the investigation of seismic signals recorded during the considered period, focusing the attention on the features of volcanic tremor (frequency content, amplitude, source location). The following
6
6 INTRODUCTION
work, on the other hand, was articulated in two different types of analyses: i) quantitative comparison of geophysical and geochemical time series recorded during 2011-2012 period, in order to highlight any relationship between different parameters and improve the knowledge on volcano dynamics; ii) moment tensor inversion of volcanic tremor recorded during the 5 August 2011 lava fountaining in order to localize the source of the seismic signals and describe its mechanism and geometry.
The idea of the first study arises from the conclusions obtained by Cannata et al. (2015) which examined the Mount Etna activity during 2013. With a comparative multiparametric study, relating temporal series of parameters such as volcanic tremor, infrasonic signals at summit craters, soil CO2 flux and ground deformation,
the authors highlighted pressurization and depressurization phases of the shallow plumbing system during the alternation between quiescence and eruptive phases, respectively. Considering the similarities of the volcano activity between 2011-2012 and 2013 (Behncke et al., 2014; De Beni et al., 2015), for the first period, a quantitative comparison between the RMS amplitude of the volcanic tremor and geochemical time series, as soil CO2 flux and flow of SO2 from the summit craters
was performed.
The second study described in this thesis concerns the moment tensor inversion analysis of the volcanic tremor recorded at Mount Etna during the lava fountaining of 5 August 2011. At Mount Etna, inversion analyses of waveforms of seismic signals were made; for example, De Barros et al. (2009, 2011) performed a moment tensor inversion analysis of long period events recorded between 18 June 2008 and 3 July 2008. Through this analysis, the authors have obtained information regarding source geometry (De Barros et al., 2009) and mechanisms, (De Barros et al., 2011). As for the volcanic tremor recorded to other volcanoes, moment tensor inversion was carried out only in one case: at Arenal volcano (Costa Rica) by Davi et al. (2012). At Mt. Etna volcano, this type of study has never been performed before and the one presented in this study is the first attempt to do so.
7
7 INTRODUCTION
In Chapter 1 of this thesis, the fundamentals regarding volcano seismicity, geological features and recent activity of Mount Etna, as well as the principal analyses routinely performed on Etna volcanic tremor, have been briefly described. In Chapter 2 and Chapter 3, instead, the main steps of the quantitative multiparametric comparison and the moment tensor inversion studies, were described. Specifically, each of the two chapters was divided into sections concerning general introduction, methods of analysis, description of the results, discussion and conclusions.
Finally, Chapter 4 summarizes the main results obtained with the studies carried out in this thesis, providing some perspectives for possible future studies.
8
8 INTRODUCTION
9
9 CHAPTER 1 - BACKGROUND AND STATE OF ART
10
10 CHAPTER 1 - BACKGROUND AND STATE OF ART
1.1
V
OLCANO SEISMICITYAt active volcanoes, it is common to observe seismicity characterized by different signals with well-defined features. Volcanic seismology studies these signals; in particular, the main objective of this discipline is to understand the nature and dynamics of seismic sources associated with the injection and transport of magma and related to hydrothermal fluids (Chouet, 2003).
An aspect of volcano seismology concerns the classification of volcano-seismic signals. Already since the 70s, several authors with pioneering works have proposed classifications (e.g. Shimozuru, 1972; Minakami, 1974); the current classification refers to more recent works such as those of McNutt (2000, 2005) and Chouet (1996) and Wassermann (2012). According the latter, volcano seismicity can be distinguished into transient and continuous signals, even if some of these continuous signals simply reflect the superposition of discrete signals. On the basis of this subdivision, the main features of the volcano-seismic signals will be discussed below.
1.1.1 Transient volcano-seismic signals
- Volcanic-Tectonic events (deep and shallow).Also called High-Frequency event (HF), deep (below about 2 km) Volcanic-Tectonic
events (VT-A) manifest themselves by the clear onsets of P- and S-wave arrivals
and their high frequency content (between 5 and 15 Hz; Fig. 1.1).
Volcanic-Tectonic events have been attributed to regional tectonic forces, gravitational loading, pore pressure effects and hydrofracturing, thermal and volumetric forces associated with magma intrusion, withdrawal, cooling, or some combinations of any or all of these (McNutt, 2005). They differ from their tectonic counterparts only in the patterns of occurrence, which at volcanoes are typically in swarms rather than mainshock-aftershock sequences (McNutt, 1996).
11
11 CHAPTER 1 - BACKGROUND AND STATE OF ART
Figure 1.0.1. VT-A type event recorded at Mt. Merapi, Indonesia. The impulsive P- and S-wave
arrivals are clearly visible in this signal, as well as their high-frequency content and short signal duration. The given color coding, representing normalized amplitude spectral density, is valid for all following figures. Also, the amplitudes of the corresponding amplitude-time representation are in arbitrary units and when given are normalized to the amplitude shown in this figure (from Wassermann, 2012).
Implementation of a suite of techniques used to improve locations represents one of the main progress in studying VT-A events. These techniques allowed defining many faults that were not discernable in standard locations (e.g. Prejean et al., 2002; McNutt, 2005). Moreover, high-resolution tomography, developed to image subsurface volcanic structures at scales of a few hundred meters (e.g. Dawson et al., 1999; Patanè et al., 2006,) was another recent method mostly based on VT-A events. This type of events is also very useful at volcanoes to determine stress orientations via study of focal mechanisms and stress tensor inversion.
Shallow (above about 1-2 km) Volcanic-Tectonic events (VT-B), instead, show much
more emergent P-wave onsets and sometimes it is even impossible to detect any clear S-wave arrival (Fig. 1.2). The spectral bands are shifted to lower frequencies (1-5 Hz). Both observations are thought to be caused by a shallow hypocenter
12
12 CHAPTER 1 - BACKGROUND AND STATE OF ART
location and therefore a larger amount of scattering during wave propagation, especially affecting higher frequencies. Fig. 1.3 shows schematically models for VT-A and VT-B events.
Figure 1.2. Typical example of a VT-B type event recorded during a high activity phase at Mt.
Merapi. Note that the overall frequency content is mainly between 1 – 10 Hz with a dominant frequency at roughly 3 Hz (from Wassermann, 2012).
13
13 CHAPTER 1 - BACKGROUND AND STATE OF ART
Figure 1.3. Two different models describing the occurrence of VT –A/B in active volcanoes. While
some VT events are simply caused by reactivation of existing faults by the increasing stress due to magma ascent, the other possible mechanism is directly linked to the emplacement of the magma in the feeder system and the associated tensile faulting. In this picture, the difference between VT-A and VT-B is simply their location with respect to a high scattering region (from Wassermann, 2012).
- Low Frequency (LF) events.
Also called Long Period (LP) events (Fig. 1.4), they are generally characterized by emergent P-waves, lack of S-waves and dominant frequencies of 0.5-5 Hz (Chouet, 1996). They may be caused by internal volcanic activities associated with fluid movement, heat and gas supply from magma, and interaction between magma and underground water. Despite the ambiguity regarding the source, many authors have studied these events, focusing on particular features such as spectral content, rates, or relation to eruptions (McNutt, 2005).
Moreover, the use of broadband stations during the last decade also allowed the observation of very long period (VLP) events (with spectral content of 2-100 seconds; Neuberg et al., 1994; Ohminato et al., 1998) at many volcanoes around the world, such as Aso (Legrand et al., 2000), Merapi (Hidayat et al., 2002), Stromboli (Neuberg et al., 1994; Chouet et al., 2003), Popocatépetl (Chouet et al., 2005), Kilauea (Ohminato et al., 1998), Etna (Cannata et al., 2009).
14
14 CHAPTER 1 - BACKGROUND AND STATE OF ART
Figure 1.4. Example of a LF-wave group recorded at Mt. Merapi. Clearly the dominant frequency is
around 1 Hz (from Wassermann, 2012).
They are assumed to be linked to the mass movements and to represent inertial forces resulting from perturbations in the flow of magma and gases through conduits (Uhira and Takeo, 1994; Kaneshima et al., 1996; Chouet, 1996). Some authors use the term Ultra Long Period event (ULP) to refer events with period longer than 100 s (e.g. Ohminato et al., 1998).
Among low frequency events we also find the tornillos, long-period volcano-seismic events (Chouet. 1996) whose shape bears a resemblance to the profile of a screw (Fig. 1.5).
The tornillo signals are characterized by (1) a long duration compared to the amplitude, (2) a long quasi-linear, slowly decaying coda and (3) a low frequency and monochromatic or quasi-monochromatic waveform sometimes showing a weak high-frequency onset superimposed on the low frequency (Torres et al., 1996). At Galeras volcano (Colombia), Narváez et al. (1997) have detected that five
15
15 CHAPTER 1 - BACKGROUND AND STATE OF ART
out of six eruptions, that occurred between July 1992 and June 1993, were preceded by episodes of tornillo signals.
Figure 1.5.Example of a LF event recorded at two different sites located at Redoubt volcano,
Alaska. The spindle shaped signal is also known as Tornillo. (from Wassermann, 2012).
- Hybrid events, Multi-Phases events
The volcano-seismic signals that share signal and frequency characteristics of both LF and VT-(A, B) events are usually labeled as Hybrid events (Fig. 1.6).
Figure 1.6. a) shows a Hybrid event and b) a VT-B event for comparison. The higher frequencies at
the beginning of the Hybrid event are an obvious feature, while the later part shows the similarity with the VT-B event (from Wassermann, 2012).
16
16 CHAPTER 1 - BACKGROUND AND STATE OF ART
This type of signals may reflect a possible mixture of source mechanisms from both event types and/or additionally reflect possible path effects (Harrington and Brodsky, 2007). For example, a VT microearthquake may trigger a nearby LP event. Lahr et al. (1994) and Miller et al. (1998) detected swarms of Hybrid events during the high activity phase of Redoubt (Alaska) and Soufriere Hills volcano (Montserrat, West Indies), respectively. Miller et al. (1998) concluded that such events reflect very shallow activity associated with a growing dome.
Multi-Phase events (MP also Many-Phases event; Shimozuru, 1972) are somewhat
higher in their frequency content (3 to 8 Hz) than Hybrid events but are related to energetic dome growth at a very shallow level (Fig. 1.7). The name reflects their complicated waveforms which seems to consist of multiple phases following to each other.
17
17 CHAPTER 1 - BACKGROUND AND STATE OF ART
Figure 1.7. MP-event recorded at Mt. Merapi during strong dome formation. The frequency
content is restricted between 3 - 10 Hz and resembles that of a VT-B type event at this volcano. (from Wassermann, 2012).
- Explosion-quakes
The explosion-quakes (Fig. 1.8) accompany explosive eruption and many ot them are characterized by air-shock phase in the seismograms. They have been extensively studied in recent years also by using infrasonic microphones or infrasonic pressure sensors: in fact, the infrasonic signal, defined as acoustic waves at frequency lower than the audible component of the sound (<20 Hz), for short distances travels in an almost homogenous atmosphere with no structures which can scatter, attenuate or reflect acoustic waves.
18
18 CHAPTER 1 - BACKGROUND AND STATE OF ART
Figure 1.8. An explosion signal recorded at Stromboli volcano, Italy. The seismic station was located just 400 m from the active vent. The dashed line gives a rough estimate of the onset of a sonic wave also visible as high (red) amplitudes in the time-frequency plot around 5 Hz (from Wessermann, 2012).
Then, unlike the seismic signal whose wavefield is strongly affected by topography (Neuberg and Pointer, 2000) and path effects (Gordeev, 1993), the infrasonic signal maintains almost unchanged its features during the propagation, allowing to obtain information concerning source dynamics. Methods for determining the relative acoustic and seismic contributions during explosive eruptions were developed and showed time variations probably related to changing conduit features and conditions (Johnson and Aster, 2005; Andronico et al., 2013).
19
19 CHAPTER 1 - BACKGROUND AND STATE OF ART
1.1.2. Continuous volcanic-seismic signals
- Volcanic tremor.It remains the most distinctive seismic signal recorded at volcanoes and shares the same frequency band with the LP events (0.2 – 5.0 Hz). The main difference between LP events and volcanic tremor consists in the duration: similar to that of earthquakes for the LP events; minutes to longer than months for volcanic tremor. On the base of it, many authors have concluded that tremor is a series of low-frequency events occurring at intervals of few seconds (Chouet, 1992). In fact, the models developed to explain the tremor source, generally involving complex interactions of magmatic fluids with the surrounding rocks (e.g. Kubotera, 1974; Steinberg and Steinberg, 1975; Aki et al., 1977; Chouet, 1981), are similar to the models of LP events. Harmonic tremor and spasmodic tremor are two special cases of more general volcanic tremor. The former is a low-frequency, often monotonic sinusoid with smoothly varying amplitude, while the latter is a higher-frequency, pulsating, irregular signal (McNutt, 1996).
20
20 CHAPTER 1 - BACKGROUND AND STATE OF ART
1.2
M
OUNTE
TNAV
OLCANOSituated in Eastern Sicily (Italy), Mount Etna (Fig. 1.9) is a polygenetic basaltic volcano among the most active volcanoes in the world, as well as the tallest in Europe with its elevation of 3350 a.s.l. (Branca et al., 2004).
Figure 1.9. (a, b) Geographical position of Mt. Etna volcano. (c) Digital Elevation Model (DEM) of
Mt. Etna volcano. (d) DEM with summit area in detail.
It is characterized by roughly elliptical base (38 × 47 km), occupies a total area of 1250 km2 and the summit area of the volcano is currently characterized by five
main active craters: Voragine (VOR), Bocca Nuova (BN), North- East Crater (NEC) and New South-East Crater (NSEC). Moreover, about 350 craters and minor vents are located in the flanks of volcano, each of which erupted only once.
21
21 CHAPTER 1 - BACKGROUND AND STATE OF ART
1.2.1 Geological framework
The first studies on Mt. Etna were performed in the nineteenth century and successively published by Gemmellaro (1858), Lyell (1859) and Waltershausen (1880). In particular, they compiled the first geological maps of Mt. Etna and performed the first stratigraphic studies that allowed them to recognize the polygenetic origin of the volcano. Waltershausen (1880) published the first geological map of the entire volcano (Branca et al., 2004).
Figure 1.10. Schematic representation of Etna volcano evolutionary phases: a) Basal Tholeiitic
phase; b) Timpe phase; c) Valle del Bove Centers phase, circle indicate the location of the
volcanoes: td=Tarderia, rc=Rocche, tr=Trifoglietto, gg=Giannicola; sa=Salifizio, cv=Cuvigghiuni; d)
22
22 CHAPTER 1 - BACKGROUND AND STATE OF ART
The geological history of Mount Etna is quite recent and began about 500,000 years ago, in the middle of Pleistocene (Branca et al., 2008). The geological evolution of volcano is subdivided in four main phases (Fig. 1.10): (1) the Basal Tholeiitic phase, (2) the Timpe phase, (3) the Valle del Bove centers phase and (4) the stratovolcano phase (Branca et al., 2011a, 2004, 2008).
The earliest volcanic products erupted in Mt. Etna area were grouped in the (1) Basal Tholeiitic phase (Fig. 1.10a). The first subaerial products were erupted about 330 ka ago (Branca et al., 2011b) along the coast of the Ionian Sea immediately to the north of Catania, leading to the Aci Castello formation characterized by pillow lava and hyaloclastic breccia (Corsaro and Cristofolini, 2000, Fig. 1.10a). Overall, the products of the Basal Tholeiitic phase are tholeiitic basalts (Branca et al., 2008). The (2) Timpe phase (Fig. 1.10b) occurred between about 220 ka and 129 ka ago (De Beni et al., 2011) and consisted mainly of repetitive effusive eruptions through N-S oriented fissures along the Timpe fault system (Branca et al., 2011b). The products of this phase are related to the first primitive composite volcano interpreted as a lava shield elongated 22 km on an NNW-SSE basis in correspondence of the actual Acireale scarps on the east flank of the volcano (Branca et al., 2008, 2011b). During this eruptive period, sporadic eruptive activity affected also the lower southwestern and southeastern sectors of the Etna edifice. The products of this phase are mainly constituted by alkali-basaltic lavas (Branca et al., 2008; Corsaro and Pompilio, 2004).
The (3) Valle del Bove phase (Fig. 1.10c) occurred about 110 ka ago and the volcanism shifted from the Ionian coast to the area now occupied by the Valle del Bove. During this period the volcanic activity of Mt. Etna underwent a profound change: from the sporadic fissure eruption of the first two phases it shifted to a central-type polygenetic volcano (De Beni et al., 2011). During a period comprised from 110 ka and 65 ka ago (De Beni et al., 2011) about seven main volcanic centers took place. The principal activity occurred from Trifoglietto volcano (~107 – 99 ka ago) on the southern flank of Valle del Bove. It was mainly characterized by effusive lava flows and explosive activity during the final phases which ended with a Plinian eruption which generated a thick sequence of pumice and flow deposits
23
23 CHAPTER 1 - BACKGROUND AND STATE OF ART
(Branca et al., 2011a). The Trifoglietto edifice reached a maximal elevation of about 2600 m (Branca et al., 2011b).
After the construction of volcanoes of the Valle del Bove the volcanism shifted NNW giving raise to the last (4) Stratovolcano phase (Fig. 1.10d). The composition of the erupted lava changed from alkali-basalt to trachytes (Corsaro and Pompilio, 2004) and was marked by the construction of Ellittico volcano, the main eruptive center recognized in Etna region. Ellittico volcano reached a maximal elevation of about 3600 m and was characterized by both explosive and effusive activity, most from the summit vents and subordinated flank fractures (Branca et al., 2011b).
Figure 1.11. Scheme of the outcropping deposits of the four phases of volcanism on Mt. Etna
24
24 CHAPTER 1 - BACKGROUND AND STATE OF ART
Ellittico volcano began his growth about 57 ka ago and slowly expanded his flanks until it reached, almost 20 ka ago, its maximal areal expansion having a maximum diameter of about 45 km that corresponds to the actual boarders of Mt. Etna volcano (Fig. 1.11). The final stage of Ellittico volcano was characterized by four Plinian eruptions, occurring about 15.5 – 15 ka ago, which ended the Elittico phase and produced a collapse of the summit area which formed the Ellittico caldera (Branca et al., 2011b). Since 15 ka ago the volcanic activity shifted to the actual active vents at the summit of Mt. Etna, namely the Mongibello volcano was born. Effusive summit eruptions gradually filled the Ellittico caldera and many flank fissures generated lava flows which reached the Ionian coast.
About 10 ka ago a collapse involved the eastern flank of the Etna edifice and formed the huge collapse depression of the Valle del Bove (Calvari et al., 1994). In 122 BC the largest explosion of Mongibello occurred, this was a Plinian eruption (Coltelli et al., 1998) that produced widespread pyroclastic scoria fall deposits and huge damage to the ancient Roman town of Catania (Branca et al., 2011b). In 1669 the largest flank eruption of modern times occurred at low altitude in correspondence of Monti Rossi.
The lava flow reached and destroyed part of the town of Catania and many villages on the Etna steps. Since the 17th century the eruptive activity has been
characterized by both periods of explosive activity (Strombolian to lava fountains) and the occurrence of sporadic flank activity which appear to have no systematic relationship with the central activity (Branca and Carlo, 2005).
1.2.2 Geodynamic framework
By a structural point of view, Mount Etna is located in a complex area characterized by different domains (Fig. 1.12).
25
25 CHAPTER 1 - BACKGROUND AND STATE OF ART
Specifically, the volcano is located on the structural domain of the Catania-Gela foredeep chain and delimited by three geostructural units: the Appennine-Maghrebian Chain northward and westward; the Iblean foreland southward, belonging to the Pelagian block, the northernmost part of the African plate; the Ionian basin eastward, opened probably during the middle-late Mesozoic and aborted at some time during the Tertiary (Catalano et al., 2001).
Figure 1.12. Structural setting of central Mediterranean Sea (from Lentini et al., 2006) and location
of Mt Etna.
So, Mount Etna is located on the edge of two crustal domains, whose boundary lies a little further south than the volcano and corresponds to the Malta escarpment (Bousquet and Lanzafame, 2004, and reference therein). The faults of this topographic lineament have been named "Aeolian Maltese fault system". This system extends (Fig. 1.13) from the Malta escarpment, along the south-eastern coast of Sicily, to the south-eastern base of Etna (Timpe faults), proceeding
26
26 CHAPTER 1 - BACKGROUND AND STATE OF ART
across north-eastern Sicily before reaching the Tyrrhenian Sea, where the faults control the volcanism of the Vulcano-Lipari-Salina alignment.
Figure 1.13. Structural sketch map of eastern Sicily and southern Calabria (from Bousquet and
Lanzafame, 2004)
The Aeolian-Maltese fault system divides the Calabrian-Sicilian arc into two different sectors (Bousquet and Lanzafame, 2004): (1) to the east, the calcalkaline volcanism of the Aeolian islands (on the margin of the Tyrrhenian back-arc basin)