© The Author 2015. Published by Oxford University Press on behalf of the Maryland Psychiatric Research Center. All rights reserved. For permissions, please email: [email protected]
Age at First Episode Modulates Diagnosis-Related Structural Brain Abnormalities
in Psychosis
Laura Pina-Camacho*,1–3, Ángel Del Rey-Mejías1,3,4, Joost Janssen1,3, Miquel Bioque1,5, Ana González-Pinto1,6,
Celso Arango1,3, Antonio Lobo1,7, Salvador Sarró1,8, Manuel Desco1,9,10, Julio Sanjuan1,11, Maria Lacalle-Aurioles9,12,
Manuel J. Cuesta13, Jerónimo Saiz-Ruiz1,14, Miguel Bernardo1,5,15, and Mara Parellada1,3; PEPs Group
1Ciber del Area de Salud Mental (CIBERSAM), Spain; 2Department of Child and Adolescent Psychiatry, Institute of Psychiatry,
Psychology and Neuroscience, King’s College London, London, UK; 3Child and Adolescent Psychiatry Department, Hospital
General Universitario Gregorio Marañón, School of Medicine, Universidad Complutense, IiSGM, Madrid, Spain; 4Department of
Methodology, School of Psychology, Universidad Complutense, Madrid, Spain; 5Barcelona Clínic Schizophrenia Unit, Neurosciences
Institute, Hospital Clínic, Barcelona, Spain; 6Department of Psychiatry, Hospital Universitario de Álava (Sede Santiago), EHU/
University of the Basque Country, Vitoria, Spain; 7Department of Medicine and Psychiatry, Hospital Clínico, University of Zaragoza,
IIS Aragón, Zaragoza, Spain; 8FIDMAG Hermanas Hospitalarias, Barcelona, Spain; 9Department of Bioengineering and Aerospace
Engineering, Universidad Carlos III de Madrid, Madrid, Spain; 10Medicina y Cirugía Experimental, Hospital General Universitario
Gregorio Marañón, IiSGM, Madrid, Spain; 11Department of Psychiatry, Hospital Clinic, University of Valencia, INCLIVA, Valencia,
Spain; 12Laboratory of Cerebrovascular Research, Montreal Neurological Institute, McGill University, Montréal, Quebec, Canada;
13Department of Psychiatry, Complejo Hospitalario de Navarra, IdiSNA, Pamplona, Spain; 14Department of Psychiatry, Hospital
Ramon y Cajal, IRYCIS, Universidad de Alcala, Madrid, Spain; 15Department of Psychiatry and Clinical Psychobiology, University of
Barcelona, IDIBAPS, Barcelona, Spain
*To whom correspondence should be addressed; Department of Child and Adolescent Psychiatry, Institute of Psychiatry, Psychology and Neuroscience, King’s College London, 16 De Crespigny Park, London SE5 8AF, UK; tel: +44 (0)20 7848 0746, fax: +44 (0)20 7708
5800, e-mail: [email protected]
Brain volume and thickness abnormalities have been reported in first-episode psychosis (FEP). However, it is unclear if and how they are modulated by brain develop-mental stage (and, therefore, by age at FEP as a proxy). This is a multicenter cross-sectional case-control brain magnetic resonance imaging (MRI) study. Patients with FEP (n = 196), 65.3% males, with a wide age at FEP span (12–35 y), and healthy controls (HC) (n = 157), matched for age, sex, and handedness, were scanned at 6 sites. Gray matter volume and thickness measurements were gener-ated for several brain regions using FreeSurfer software. The nonlinear relationship between age at scan (a proxy for age at FEP in patients) and volume and thickness mea-surements was explored in patients with schizophrenia spectrum disorders (SSD), affective psychoses (AFP), and HC. Earlier SSD cases (ie, FEP before 15–20 y) showed significant volume and thickness deficits in frontal lobe, volume deficits in temporal lobe, and volume enlargements in ventricular system and basal ganglia. First-episode AFP patients had smaller cingulate cortex volume and thicker temporal cortex only at early age at FEP (before 18–20 y). The AFP group also had age-constant (12–35-y age span) volume enlargements in the frontal and parietal lobe. Our study suggests that age at first episode modulates the structural brain abnormalities found in FEP patients in a
nonlinear and diagnosis-dependent manner. Future MRI studies should take these results into account when inter-preting samples with different ages at onset and diagnosis. Key words: first-episode psychosis/age at onset/ schizophrenia/bipolar disorder/cortical thickness/ cortical volume/MRI
Introduction
Brain development during adolescence follows a hetero-geneous pattern with regions maturing at different rates and in a nonlinear fashion.1–4 Consequently, for patients
with neurodevelopmental disorders, a structural brain deficit may be more marked in a compartment under-going pronounced maturation.4 Thus, when assessing
the effect of age at first episode of psychosis (FEP) on diagnostic brain deficits, a sample comprising the various stages of brain maturation is preferred.4
The concept of age at FEP modulating brain deficits is exemplified by patients with first-episode schizophrenia spectrum disorders (SSD) who show focal parietal deficits when onset is in childhood or early-adolescence,5–7 whereas
late-adolescent or early-adult onset are associated with more widespread gray matter (GM) cortical (eg, frontal, temporal,
insular) and subcortical volume and/or thickness deficits.8–19
This pattern has also been reported in patients with first-epi-sode affective psychoses (AFP), with alterations being larger and more widespread in the SSD group.8,12,20–22 Previous
studies assessing the effect of age at FEP on brain structure suggest that earlier onset is associated with greater disrup-tion of structural brain development.7,23–26 However,
inter-pretation of these results may be hampered by using age as a linear variable and disregarding the nonlinear relationship of age with brain development,24,26 stratifying cases into
sev-eral onset (adolescent/adult) groups instead of treating age as a continuous variable,23,25 and using a narrow age-range
sample of patients which does not encompass important stages of brain development.7 We do not know of a study
assessing the nonlinear effect of age on brain deficits in FEP patients whose first-episode onset ranges from early adoles-cence through adulthood.
In this study, we scanned a large sample of FEP patients with a wide age span (12–35 y) and a sample of healthy controls (HC) matched for age, sex, and handed-ness. We aimed to determine whether age at FEP has a nonlinear effect on the diagnostic-related abnormalities detected at start of psychosis. Based on the literature, we hypothesized that FEP patients would have volume and thickness abnormalities in regions undergoing macro-scopic maturation at each particular stage. Therefore, (1) SSD patients with earlier age at FEP would show abnor-malities in frontal, temporal, and cingulate cortices and subcortical regions and (2) AFP patients would have age-modulated abnormalities in similar regions, with mor-phometric measures positioned in between HC and SSD. Methods
Subjects
The sample came from the “Phenotype-genotype and environmental interaction. Application of a predictive model in first psychotic episodes” study (or PEPs study, from its acronym in Spanish), a 2-year, multicenter, natu-ralistic, prospective study, in which 335 FEP patients and 253 HC were recruited from January 2009 to December 2011.27 The patient sample was consecutively recruited
from several outpatient clinics and inpatient units in Spain. Inclusion criteria for patients were: (1) age 7–35 years at the time of first evaluation, (2) psychotic disorder accord-ing to DSM-IV criteria of less than 12 months’ duration, (3) speaking Spanish correctly, and (4) written informed consent. Exclusion criteria for patients were: (1) mental retardation according to DSM-IV criteria,28 (2) history
of head trauma with loss of consciousness, and (3) sys-temic disease with mental health impact. A sample of HC matched for age, sex, ethnicity, and handedness (in the global sample, at each site and across sites) was recruited from the same geographic areas as patients. Inclusion criteria for HC were the same as for patients, except for past or present psychotic symptoms. Exclusion criteria
were the same as for patients plus (1) past or present psy-chotic symptoms or major depressive disorder and (2) first-degree relative with history of psychotic disorder. A complete description of study design and recruitment procedures is provided elsewhere.27 A complete
descrip-tion of the assessment procedures is presented as
supple-mentary material 1.
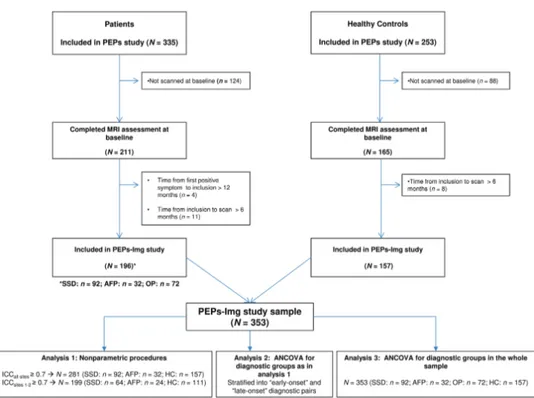
Figure 1 shows the flowchart for study inclusion. Out
of the 16 sites participating in the PEPs Project,27 11 sites
participated in the neuroimaging module (PEPs-Img study). Subjects were then scanned on 6 scanner plat-forms (subjects from different sites within the same city were scanned on the same machine). To minimize the effect of time since FEP onset, we restricted our analy-sis to patients with less than 18 months’ duration from positive psychotic symptom onset to scan acquisition (ie, a maximum of 12 months from onset to recruitment as per inclusion criteria plus a maximum of 6 months from inclusion to scan). A sample of 353 subjects—196 patients (SSD: n = 92, AFP: n = 32, and other psychoses [OP]: n = 72) and 157 HC—was, therefore, included in the PEPs-Img study.
The study was approved by the institutional review boards of all the participant sites and was conducted according to the provisions of the World Medical Association Declaration of Helsinki. Written informed consent was obtained from all participants and also from parents/legal guardians for children under 16 years of age. Image Acquisition and Analysis
T1-weighted magnetic resonance imaging (MRI) scans of the subjects recruited in the PEPs-Img study were acquired on 6 scanner platforms. Full details about the characteristics of each platform and acquisition proto-col are provided in supplementary material 2. Scans were visually assessed for quality prior to image processing, and no scans were deemed of insufficient quality.
Intracranial volume was estimated from skull-stripped segmented T1-weighted images obtained using SPM8 (available at: http://www.fil.ion.ucl.ac.uk/spm) with the VBM8 toolbox (available at: http://dbm.neuro.uni-jena.
de/vbm) by summing total GM and white matter (WM)
and cerebrospinal fluid volumes. Total brain volume (TBV) was calculated as the sum of total GM and WM volumes. The FreeSurfer analysis suite (v5.3, available
at: http://surfer.nmr.mgh.harvard.edu/) was used with
default settings to generate regional volume and corti-cal thickness measurements29 for each cortical region of
interest (ROI),30 including (1) lobar ROIs (frontal,
pari-etal, temporal, and occipital); (2) anterior and posterior cingulate, middle frontal gyrus, medial orbitofrontal cortex, superior and middle temporal gyri, precuneus, and insula; and (3) subcortical/ventricular ROIs (lateral ventricles; third and fourth ventricle; hippocampus; basal ganglia: caudate, putamen, and pallidum; and thalamus).
Note that for the subcortical/ventricular ROI group, only cortical volume was calculated. All measures were summed or averaged over both hemispheres. All segmen-tations were found to be accurate after visual inspection. Processing was supervised by experts with extensive expe-rience in image processing.8,31
The PEPs-Img Reproducibility Study
An interscanner reproducibility study was performed using data from 6 HC scanned at each participating site. Full details about the results derived from the compat-ibility study are presented as supplementary material 2. It was decided that: (1) for all morphometric measurements, site would be included as a covariate in all analyses, (2) only ROIs that showed reasonable reproducibility among the 6 scanners (intraclass correlation coefficient [ICC]all
sites ≥ 0.7) would be studied, and (3) for ROIs with ICCall sites <0.7 but with reasonable reproducibility between sites
1 and 2 (ICCsites 1–2 ≥ 0.7), analyses would be done only for the subsample of patients (n = 131) and controls (n = 111) scanned at those sites.
Statistical Analyses
Differences among FEP patients, diagnostic subgroups, and HC in demographic data and baseline clinical data
were assessed by Chi-square, Fisher exact, or ANOVA tests as appropriate, after normality of distributions and homoscedasticity of variances were checked. Partial Spearman rank correlations, t tests, or ANOVA tests were used to investigate the relationships of demographic and clinical variables with each morphometric measurement. Sex, parental socioeconomic status (SES), and estimated intelligence quotient (IQ) were found to show significant associations with most morphometric measurements.
First, nonparametric statistical procedures were used to assess the nonlinear relationship of age with morphomet-ric measurements. Volume and thickness measurements were corrected by site, sex, SES, estimated IQ, and TBV (volume measurements only), and standardized residu-als were saved. Using nonparametric kernel-smoothing procedures, saved residuals (“y”) were depicted as a func-tion of age at scan (“x”) for 3 diagnostic pairs (SSD vs HC, AFP vs HC, and SSD vs AFP). The OP group was excluded from this analysis due to its reportedly high diagnostic instability, both in pediatric32 and adult FEP
patients33 (figure 1, analysis 1). Bootstrapping procedures
were used to compute 95% CIs for each of the measure-ments. To do so, 10 000 samples were generated and all the curves were computed in each sample. Each point of the bound curves was estimated with the appropriate per-centile (2.5 for lower bound and 97.5 for upper bound).
Fig. 1. Flowchart for inclusion in the PEPs-Img study. AFP, 12-month follow-up diagnosis of affective psychosis (type I bipolar
disorder or major depressive disorder with psychotic symptoms); HC, healthy controls; ICC, intraclass correlation coefficient; MRI, magnetic resonance imaging; OP, 12-month follow-up diagnosis of other psychotic disorder (brief reactive psychosis, delusional disorder, substance-induced psychotic disorder, or psychotic disorder not otherwise specified); PEPs, “first psychotic episode” study; PEPs-Img, PEPs imaging study; SSD, 12-month follow-up diagnosis of schizophrenia spectrum disorder (schizophrenia, schizophreniform, or schizoaffective disorder).
Nadaraya-Watson kernel regression estimates were used. The kernel function was Gaussian and to choose the appropriate degree of smoothness, bandwidth parame-ters were established using Silverman’s rule of thumb.34,35
These analyses were performed using R package “mon-reg” (version 0.1.3).36 To assess if and when curves
dif-fered significantly between groups, the age at CI overlap was determined by visual inspection.
Secondly, to assess the age (“x”) when between-group differences became statistically significant, cases were stratified into “early-onset” and “late-onset” groups at age points where curves showed CI crossover, ie, subjects ≤ 15 vs > 15 years; subjects < 18 vs ≥ 18 years, and sub-jects < 20 vs ≥ 20 years, depending on the curve (figure 1, analysis 2). Separate ANCOVA were conducted for each “early-onset” and “late-onset” diagnostic pair. Volume and thickness measurements were corrected by sex, SES, estimated IQ, and TBV (volume measurements only), and standardized residuals were saved. ANCOVA were performed with age and site as covariates. The signifi-cance threshold was set as P <.05. The Bonferroni correc-tion for multiple comparisons was applied. For variables that reached significance, effect sizes (Cohen’s d) were calculated.37 These analyses were performed using SPSS
(v.18.0).
Thirdly, using the above procedure, diagnostic-group differences were calculated with ANCOVA for the whole sample, with age as a linear covariate (figure 1, analysis 3). This was done to test whether nonlinear procedures reveal details not apparent using linear multivariate analyses.
Results
Demographic and clinical characteristics of the 196 patients and 157 controls included in the PEPs-Img study are presented in table 1. Demographic and clinical char-acteristics of the 131 patients and 111 controls scanned at sites 1 and 2 are presented in table 2. The ratio of patients (and diagnostic subgroups) and controls scanned at each site is presented as supplementary material 3.
Nonlinear effects of age results are shown in figures 2a–c, 3a, and 3b where depicted residuals and CI for volume and thickness measurements (“y”) as a function of age at scan (“x”) for each diagnostic pair are given. Where appropriate, significant diagnosis-related differ-ences between early-onset groups using ANCOVA are shown. Note that in all group comparisons, the sample size of the younger group was smaller, and the effect sizes of the significant group differences were medium to large, according to Cohen’s criteria.37
SSD vs HC
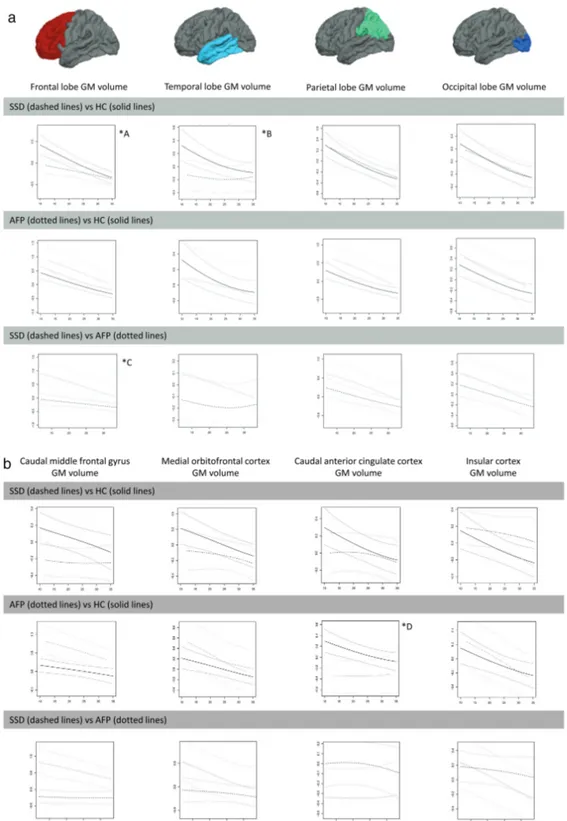
Earlier age at first-episode SSD cases had smaller fron-tal lobe, caudal middle fronfron-tal gyrus, and temporal lobe
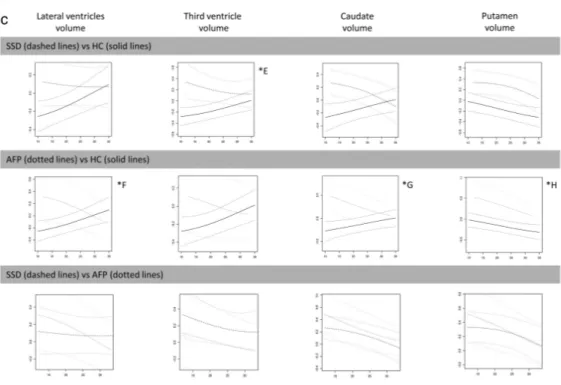
volumes (figures 2a and 2b) as well as larger third ven-tricle, caudate, putamen, and lateral ventricle volumes
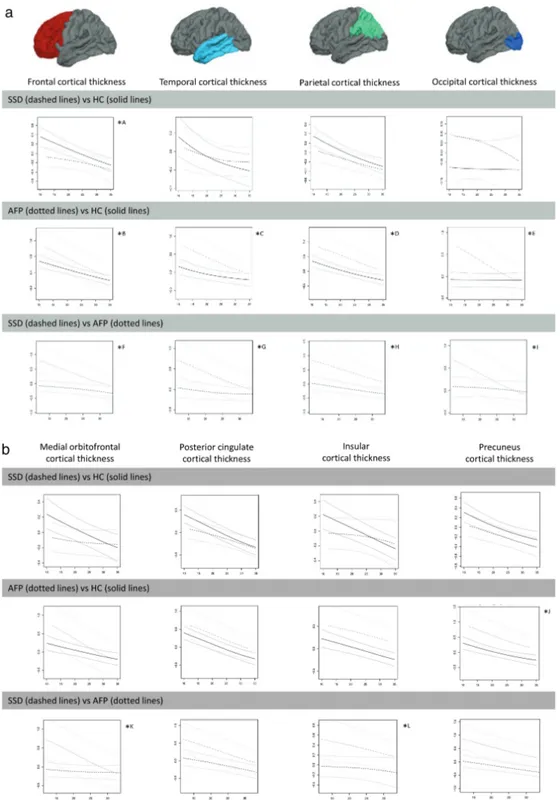
(figure 2c). They also had thinner frontal, medial
orbi-tofrontal, and insular cortices (figures 3a and 3b). SSD cases and HC followed a similar downward pattern in parietal and occipital volumes (figure 2a) and in thick-ness of ROIs such as parietal or temporal lobe or poste-rior cingulate (figures 3a and 3b) across the age span of 12–35 years.
AFP vs HC
Earlier age at first-episode AFP cases had smaller cau-dal anterior cingulate; larger caudate, putamen, third ventricle, and lateral ventricle volumes (figures 2b and 2c); and thicker temporal and occipital lobes (figure 3a). The AFP group also displayed age-constant (12–35-y age span) volume enlargements and/or cortical thickening in frontal and parietal lobes (figures 2a and 3a).
SSD vs AFP
Earlier age at first-episode SSD patients had significantly smaller frontal volumes (figure 2a) and thinner frontal, temporal, parietal, medial orbitofrontal, and insular cor-tices (figures 3a and 3b) than AFP patients. SSD patients also had smaller middle frontal gyrus volumes and thin-ner precuneus cortices throughout the 12–35-years age span (figures 2b and 3b). Besides, both groups showed age-constant (12–35 y) volume deficits in parietal and occipital lobes (figure 2a) as well as in the caudate and putamen (figure 2c).
Between-group differences in volume and thickness measurements residuals for the whole sample using ANCOVA are provided in supplementary material 4. Discussion
This study covering a wide age span (12–35 y) supports our hypothesis that age at first psychotic episode modu-lates the structural brain abnormalities found in patients with FEP in a nonlinear and diagnosis-dependent man-ner. Specifically, patients with SSD and earlier (but not later) age at FEP (around 15–20 y) showed significant volume enlargements in ventricular system and basal ganglia compared to controls, volume and thickness defi-cits in frontal lobe, and volume defidefi-cits in temporal lobe compared to patients with AFP and controls. Similarly, first-episode AFP patients had smaller cingulate cortex volume and thicker temporal cortex only at early ages. Other regions (eg, frontal and parietal lobes) showed age-constant group differences across the 12–35-years age span, enlarged in volume in AFP patients relative to controls. Our results indicate that MRI studies in FEP should take into account the nonlinear effect of age on brain structure when interpreting samples with different age at FEP and diagnosis.
T
able 1.
Demo
gr
aphic and Clinical Char
acteristics of
the PEPs-Img Sample
All FEP ( N = 196) SSD ( N = 92) AFP ( N = 32) OP ( N = 72) HC ( N = 157) Sta tistic; P V alue Post Hoc Age at scan : y (mean (SD)) [r ange] 22.92 (6.00) [12–35] 23.12 (6.01) [12–35] 22.34 (6.04) [12–34] 23.19 (6.21) [13–35] 23.71 (6.01) [10–35] F3, 349 = 0.54; P = .65 Age at scan < 18 y: no . (%) 44 (22.4) 22 (23.9) 8 (25.0) 14 (19.4) 23 (14.6) χ 2 3, 353 = 4.14; P = .25 Se x (male): no . (%) 81 (65.3) 60 (65.2) 21 (65.6) 52 (72.2) 97 (61.8) χ 2 3, 353 = 2.37; P = .50 Time fr
om baseline visit to scan
: d (mean (SD)) [r ange] 10.60 (59.43) [−98 to 180] 10.53 (58.80) [−98 to 180] 9.97 (62.14) [−80 to 155] 2.04 (46.89) [−156 to 154] 21.93 (49.14) [−129 to 169] F3, 349 = 2.60; P = .05 Time fr
om FEP onset to scan
a: d (mean (SD)) [r ange] 151.94 (113.68) [0–497] 168.42 (111.48) [1–497] 149.74 (137.43) [0–452] 131.79 (103.00) [8–389] — F2, 190 = 2.10; P = .13 Ethnicity : no . (%) Caucasian 105 76 29 63 140 Hispanic 7 7 0 1 0 F χ 2 6, 353 = 9.45; P = .12 Other 12 9 3 8 7 Handedness b: no . (%) Right-handed 98 (85.2) 71 (83.5) 27 (90.0) 56 (77.8) 135 (89.4) Left-handed 13 (11.3) 10 (11.8) 3 (10.0) 6 (8.3) 13 (8.6) F χ 2 6, 329 = 2.95; P = .82 Ambide xtr ous 4 (3.5) 4 (4.7) 0 (0) 1 (1.4) 3 (2.0) Socioeconomic status c: no . (%) High 16 (13.1) 14 (15.6) 2 (6.3) 16 (22.2) 29 (18.6) Inter media te-high 17 (13.9) 10 (11.1) 7 (21.9) 7 (9.7) 31 (19.9) Inter media te 30 (24.6) 22 (24.4) 8 (25.0) 16 (22.2) 55 (35.3) χ 2 12, 350 = 33.75; P = .001 SSD , AFP , OP < HC Inter media te-lo w 38 (31.1) 31 (34.4) 7 (21.9) 21 (29.2) 36 (23.1) L ow 21 (17.2) 13 (14.4) 8 (25.0) 12 (16.7) 5 (3.2) Pr emorbid IQ d: scor e (mean (SD)) [r ange] 92.96 (16.82) [60–130] 90.88 (14.64) [60–120] 99.29 (21.24) [60–130] 91.29 (14.39) [65–140] 107.52 (13.92) [75–145] F3, 324 = 30.36; P < .001 SSD , AFP , OP < HC; SSD < AFP Baseline P ANSS : scor e (mean (SD)) [r ange] Total 75.24 (25.78) [30–158] 78.83 (26.13) [35–158] 64.94 (22.06) [30–120] 68.33 (23.46) [30–123] — F2, 193 = 5.60; P = .004 SSD > AFP , OP Positi ve 18.23 (7.82) [7–39] 18.90 (7.69) [7–39] 16.31 (7.99) [7–33] 17.25 (8.49) [7–41] — F2, 193 = 1.57; P = .21 Nega ti ve 19.77 (9.15) [7–43] 21.62 (9.24) [7–43] 14.44 (6.50) [7–34] 16.16 (7.32) [7–32] — F2, 193 = 13.63; P < .001 SSD > AFP , OP Gener al 37.24 (13.76) [16–82] 38.30 (14.11) [18–82] 34.19 (12.39) [16–66] 34.93 (11.61) [16–62] — F2, 193 = 1.92; P = .15 Baseline CGI : scor e (mean (SD)) [r ange] 4.51 (1.17) [1–7] 4.68 (1.09) [1–7] 3.97 (1.27) [1–6] 4.34 (1.02) [1–7] — F2, 184 = 5.16; P = .007 SSD > AFP , OP Baseline GAF/CGAS : scor e (mean (SD)) [r ange] 48.12 (21.14) [11–95] 46.09 (20.17) [11–95] 53.97 (23.04) [15–91] 56.50 (19.20) [15–90] 93.36 (5.41) [80–100] F3, 348 = 219.12; P < .001 SSD , AFP , OP < HC; SSD < OP Antipsy chotic tr eatment at scan : no . (%) 113 (91.1) 87 (94.6) 26 (81.3) 61 (84.7) — F χ 2 2, 196 = 6.47; P = .03 SSD > AFP , OP Antipsy
chotic dose at scan (mg)
e: mean (SD) [r ange] 526.86 (456.89) [0–3,180] 535.65 (388.64) [0–1,888] 501.58 (619.66) [0–3,180] 414.83 (378.49) [0–2,232] — F2, 193 = 1.61; P = .20 Dur ation of antipsy chotic tr eatment until scan : d (mean (SD)) [r ange] 83.76 (85.85) [0–441] 84.49 (86.57) [0–441] 81.66 (85.11) [0–319] 60.72 (58.46) [0–256] — F2, 191 = 2.02; P = .14 Antipsy chotic cumulati ve dose at scan (mg) e: mean (SD) [r ange] 49226.70 (76633.52) [0–599,300] 51952.27 (84522.86) [0–599,300] 41475.84 (47823.72) [0–209,520] 30941.59 (36217.19) [0–210,812] — F2, 191 = 2.09; P = .13
All FEP ( N = 196) SSD ( N = 92) AFP ( N = 32) OP ( N = 72) HC ( N = 157) Sta tistic; P V alue Post Hoc Other tr eatments at scan: no . (%) Lithium 14 (11.3) 1 (1.1) 13 (40.6) 2 (2.8) — F χ 2 2, 196 = 36.75; P < .001 AFP > SSD , OP
Other mood sta
biliz ers 12 (9.7) 4 (4.3) 8 (25.0) 4 (5.6) — F χ 2 2, 195 = 11.05; P = .002 AFP > SSD , OP Antidepr essants 19 (15.3) 11 (12.0) 8 (25.0) 4 (5.6) — F χ 2 2, 196 = 7.51; P = .02 AFP > OP Benzodiaz epines 69 (35.2) 34 (49.3) 8 (11.6) 27 (39.1) — χ 2 2, 196 = 1.75; P = .44 Anticholiner gic a gents 21 (16.9) 16 (17.4) 5 (15.6) 4 (5.6) — F χ 2 2, 196 = 5.73; P = .06 Stim ulants 0 (0) 0 (0) 0 (0) 0 (0) — — Note : AFP , 12-month f ollo w-up dia gnosis of af fecti ve psy
chosis (type I bipolar disor
der or major depr
essi
ve disor
der with psy
chotic symptoms); CGAS
, Childr
en
’s Global
Assessment Scale; CGI: Cinical Global Impr
ession scale; FEP
, first episode of psy chosis; GAF , Global Assessment of Functioning scale; HC , health y contr
ols; IQ, intelligence
quotient; OP , 12-month f ollo w-up dia gnosis of other psy chotic disor ders (brief r eacti ve psy chosis , delusional disor der , substance-induced psy chotic disor der , or psy chotic disor
der not otherwise specified); P
ANSS , P ositi ve and Nega ti ve Symptom Scale; SSD , 12-month f ollo w-up dia gnosis of schizophr
enia spectrum disor
der (schizophr enia, schizophr enif or m, or schizoaf fecti ve disor
der). In all cells
, % r
efers to per
centa
ges (within columns) of
participants f or w hom inf or ma tion w as a vaila ble . Sta tisticall y significant P v alues in bold. F or qualita ti ve v aria bles , chi-squar e ( χ 2) or Fisher tests w er e used. F or quantita ti ve v aria bles , ANO VA w er e used.
aBased on first positi
ve psy
chotic symptom assessed with the Symptom Onset in Schizophr
enia (SOS) in
ventory (see
supplementary ma
terial 1
).
bAssessed with the Edinb
ur gh Handedness In ventory (see supplementary ma terial 1 ). cP ar
ental socioeconomic sta
tus
, assessed with the Hollingshead-R
edlich scale (see
supplementary ma
terial 1
).
dEstima
ted with the v
oca
bulary subtest of
the WISC-IV or W
AIS-III f
or subjects under and o
ver 16 y of a ge , r especti vel y (see supplementary ma terial 1 ). eIn chlorpr omazine equi valents (see supplementary ma terial 1 ): 100 mg chlorpr omazine = a bout 1.5 mg risperidone/5 mg olanza pine/150 mg quetia pine . T able 1. Contin ued
To the best of our knowledge, this is the first study assessing the nonlinear association of age at first episode and structural brain abnormalities in FEP patients whose onset ranges from early adolescence through adulthood. Our results may be interpreted in the context of what is known about the heterogeneity of typical brain maturity, ie, different structures mature at different ages and rates.1–4,38 We and others postulate
that if onset of psychosis coincides with active matura-tional changes in a brain structure, then development of that particular brain structure will be most affected by the disease.4,22 The current study indicates that if SSD
starts after early adolescence, no differences are found in the parietal cortex of cases and controls. The parietal cortex reaches peak maturity in late childhood (around 7.5 y in girls and 9 in boys4), and parietal
abnormali-ties are present in very early-onset psychosis such as childhood-onset schizophrenia.5,6 The frontal and
tem-poral cortices mature later during adolescence,4 and
onset of psychosis during this developmental period has been shown to principally affect frontal and tem-poral regions,8–11 as was the case with the SSD group in
the current study.
Contrary to our expectations, brain morphometric measurements in AFP were not positioned in between healthy individuals and SSD.39 AFP cases showed larger
volume and/or thickness measurements in frontal, tem-poral, and parietal lobe compared to the other groups and smaller cingulate cortex volume in earlier onset AFP patients (as expected) relative to controls. Some studies have not found any differences between first-episode SSD and AFP patients, and many others do not include diag-nostic subgroup comparisons.22 Hence this finding
war-rants further replication. A previous study in first-episode AFP and schizophrenia patients aged 18–40 years also showed brain deficits confined to the subgenual cingulate in this specific subgroup.40 This result is of special
inter-est, as this region has been recently proposed as key in affective symptoms.41,42
Our study found larger caudate and putamen volumes in adolescent- and early-adult-onset psychosis patients, a period at which there is active area expansion in typi-cally developing subjects.43 Hippocampal volume deficits
have been shown in both AFP and SSD patients,44 but
more strongly linked to SSD45 and later-onset cases.26,46 In
this study, nonparametric procedures did not show any diagnosis-related difference in the hippocampus across the age span.
Our findings provide an interpretation for divergent brain abnormalities previously reported for earlier- and later-onset FEP patients. The results also warrant cau-tion when using age at first episode as a categorical dis-criminant factor for comparing FEP patients, especially when patients with positive psychotic symptom onset under and over 20 years are included in the same study. The meaning of these deficits and their correlates at a
T
able 2.
Demo
gr
aphic and Clinical Char
acteristics of the “Site 1–2” PEPs-Img Subsample Site 1–2 FEP (N = 131) Site 1–2 SSD (N = 64) Site 1–2 AFP (N = 24) Site 1–2 OP (N = 43) Site 1–2 HC (N = 111) Statistic; P V alue P ost Hoc Age at scan : y (mean (SD)) [r ange] 21.9 (6.00) [12–35] 21.89 (5.8) [12–35] 21.04 (5.6) [12–33] 22.7 (6.4) [13–35] 23.4 (6.4) [9–35] F3, 238 = 1.34; P = .26 Age at scan < 18 y: no . (%) 39 (29.8) 20 (31.3) 8 (33.3) 11 (25.6) 21 (18.9) χ 2 3, 242 = 4.44; P = .22 S ex (male): no . (%) 81 (65.3) 42 (65.6) 14 (58.3) 32 (74.4) 71 (64.0) χ 2 3, 242 = 2.18; P = .55 Time fr
om baseline visit to scan
: d (mean (SD)) [r ange] 9.8 (54.5) [−98 to 180] 13.63 (70.76) [−98 to 180] 7.9 (54.37) [−56 to 155] 5.00 (44.43) [−92 to 154] 18.60 (54.49) [−129 to 169] F3, 238 = 0.75; P = .52 Time fr
om FEP onset to scan
a: d (mean (SD)) [r ange] 160.48 (115.89) [0–497] 176.19 (111.89) [1–497] 155.22 (141.21) [0–452] 139.79 (105.52) [12–389] — F2, 125 = 1.28; P = .28 Ethnicity : no . (%) Caucasian 109 (83.2) 51 (79.7) 21 (87.5) 37 (86.0) 96 (86.5) Hispanic 7 (5.3) 6 (9.4) 0 (0) 1 (2.3) 10 (9.0) F χ 2 6, 242 = 8.09; P = .20 Other 15 (11.5) 7 (10.9) 3 (12.5) 5 (11.6) 5 (4.5) Handedness b: no . (%) Right handed 106 (80.9) 49 (79.0) 21 (91.3) 36 (92.3) 93 (86.9) F χ 2 6, 231 = 4.60; P = .57 Left handed 14 (10.7) 9 (14.5) 2 (8.7) 3 (7.7) 11 (10.3) Ambide xtr ous 4 (3.1) 4 (6.5) 0 (0) 0 (0) 3 (2.8) Socioeconomic status c: no . (%) High 22 (16.8) 11 (17.7) 1 (4.2) 10 (23.3) 27 (24.5) Inter media te-high 16 (12.2) 8 (12.9) 5 (20.8) 3 (7.0) 19 (17.3) Inter media te 25 (19.1) 12 (19.4) 5 (20.8) 8 (16.8) 34 (30.9) F χ 2 12, 239 = 27.00; P = .008 SSD , AFP , OP < HC Inter media te- lo w 40 (30.5) 22 (32.3) 6 (25.0) 14 (32.6) 26 (23.6) L ow 26 (19.8) 11 (17.7) 7 (29.2) 8 (18.6) 4 (3.6) Pr emorbid IQ d: scor e (mean (SD)) [r ange] 92.9 (15.6) [60–140] 90.4 (14.3) [60–120] 102.9 (18.8) [65–130] 91.5 (13.9) [65–140] 106.3 (13.5) [75–145] F3, 226 = 20.76; P < .001 SSD < AFP , HC; OP < AFP , HC Baseline P ANSS : scor e (mean (SD)) [r ange] Total 74.7 (25.5) [30–158] 81.9 (27.9) [37–158] 64.0 (19.4) [30–99] 69.9 (21.8) [30–118] — F2, 128 = 5.76; P = .004 SSD > AFP , OP Positi ve 18.4 (8.1) [7–41] 19.9 (7.8) [7–39] 16.4 (8.2) [7–33] 17.4 (8.4) [7–41] — F2, 128 = 2.20; P = .12 Nega ti ve 18.7 (8.9) [7–43] 22.0 (9.6) [7–43] 13.8 (5.5) [7–24] 16.6 (7.5) [7–32] — F2, 128 = 10.47; P < .001 SSD > AFP , OP Gener al 37.5 (13.2) [16–82] 39.9 (14.9) [18–82] 33.8 (11.3) [16–57] 35.9 (10.7) [16–55] — F2, 128 = 2.37; P = .10 Baseline CGI : scor e (mean (SD)) [r ange] 4.5 (1.2) [1–7] 4.7 (1.2) [1–7] 3.9 (1.3) [1–6] 4.5 (0.9) [2–7] — F2, 126 = 3.89; P = .02 SSD > AFP Baseline GAF/CGAS : scor e (mean (SD)) [r ange] 51.0 (22.7) [15–95] 46.6 (22.2) [15–95] 55.3 (26.3) [15–91] 55.3 (20.3) [15–90] 93.2 (5.6) [80–100] F3, 237 = 127.01; P < .001 SSD , AFP , OP < HC; SSD < OP Antipsy chotic tr eatment at scan : no . (%) 122 (93.1) 62 (96.9) 19 (79.2) 41 (95.3) — F χ 2 2, 131 = 7.04; P = .02 SSD , OP > AFP
Site 1–2 FEP (N = 131) Site 1–2 SSD (N = 64) Site 1–2 AFP (N = 24) Site 1–2 OP (N = 43) Site 1–2 HC (N = 111) Statistic; P V alue P ost Hoc Antipsy
chotic dose at scan (mg)
e: (mean (SD)) [r ange] 479.68 (394.09) [0–2,232) 539.38 (398.77) [0–1,888) 394.18 (409.77) [0–1,540) 438.53 (372.68) [0–2,232) — F2, 128 = 1.55; P = .22 Dur ation of antipsy chotic tr eatment until scan: d (mean SD) [r ange] 80.6 (83.9) [0–441) 91.0 (97.3) [0–441) 78.9 (83.9) [0–319) 65.8 (57.6) [0–256) — F2, 126 = 1.15; P = .32 Antipsy chotic cumulati ve dose at scan (mg) e: mean (SD) [r ange] 46750.95 (75520.78) [0–599,300] 58849.79 (98849.05) [0–599,300) 34470.60 (39782.24) [0–130,080) 35620.03 (41254.07) [0–210,812) — F2, 126 = 1.60; P = .21 Other tr eatments at scan : no . (%) Lithium 13 (9.9) 1 (1.6) 11 (45.8) 1 (2.3) — F χ 2 2, 131 = 30.05; P < .001 AFP > SSD , OP
Other mood sta
biliz ers 10 (7.6) 3 (4.7) 5 (20.8) 2 (4.8) — F χ 2 2, 130 = 5.73; P = .06 Antidepr essants 17 (13.0) 8 (12.5) 6 (25.0) 3 (7.0) — F χ 2 2, 131 = 4.16; P = .12 Benzodiaz epines 39 (29.8) 19 (29.7) 4 (16.7) 16 (37.2) — χ 2 2, 131 = 3.11; P = .22 Anticholiner gic a gents 19 (14.5) 12 (18.8) 4 (16.7) 3 (7.0) — F χ 2 2, 131 = 2.74; P = .13 Stim ulants 0 (0) 0 (0) 0 (0) 0 (0) — — Note : AFP , 12-month f ollo w-up dia gnosis of af fecti ve psy
chosis (type I bipolar disor
der or major depr
essi
ve disor
der with psy
chotic symptoms); CGAS
, Childr
en
’s Global
Assessment Scale; CGI, Clinical Global Impr
ession scale; FEP
, first episode of psy chosis; GAF , Global Assessment of Functioning scale; HC , health y contr
ols; IQ, intelligence
quotient; OP , 12-month f ollo w-up dia gnosis of other psy chotic disor ders (brief r eacti ve psy chosis , delusional disor der , substance-induced psy chotic disor der , or psy chotic disor
der not otherwise specified); P
ANSS , P ositi ve and Nega ti ve Symptom Scale; SSD , 12-month f ollo w-up dia gnosis of schizophr
enia spectrum disor
der (schizophr enia, schizophr enif or m, or schizoaf fecti ve disor
der). In all cells
, % r
efers to per
centa
ges (within columns) of
participants f or w hom inf or ma tion w as a vaila ble . Sta tisticall y significant P v alues in bold. F or qualita ti ve v aria bles , chi-squar e ( χ 2) or Fisher tests w er e used. F or quantita ti ve v aria bles , ANO VA w er e used.
aBased on first positi
ve psy
chotic symptom assessed with the Symptom Onset in Schizophr
enia (SOS) in
ventory (see
supplementary ma
terial 1
).
bAssessed with the Edinb
ur gh Handedness In ventory (see supplementary ma terial 1 ). cPar
ental socioeconomic sta
tus
, assessed with the Hollingshead-R
edlich scale (see
supplementary ma
terial 1
).
dEstima
ted with the v
oca
bulary subtest of
the WISC-IV or W
AIS-III f
or subjects under and o
ver 16 y of a ge , r especti vel y (see supplementary ma terial 1 ). eIn chlorpr omazine equi valents (see supplementary ma terial 1 ): 100 mg chlorpr omazine = a bout 1.5 mg risperidone/5 mg olanza pine/150 mg quetia pine . T able 2. Contin ued
Fig. 2. Differences between diagnostic groups in volume measurements (“y”) as a function of age at scan (“x”). Standardized
residuals after controlling for total brain volume, site, sex, parental socioeconomic status, and estimated intelligence quotient (y axis) as a function of age at scan (x axis). AFP, affective psychosis; GM, gray matter; HC, healthy controls, ROI, region of interest; SSD,
schizophrenia spectrum disorder. (2a) Note: ICCall sites ≥ 0.8 for all lobar ROIs except for occipital lobe (ICCsites 1–2 ≥ 0.9). *A <20 y SSD <
HC (F1, 66 = 4.66, P = .04, d = 0.532). *B <20 y SSD < HC (F1, 66 = 4.81, P = .03, d = 0.549). *C <20 y SSD < AFP (F1, 30 = 5.41, P = .03,
d = 0.850). (2b) Note: ICCall sites ≥ 0.9 for all cortical ROIs except for medial orbitofrontal cortex (ICCsites 1–2 ≥ 0.7). *D <20 y AFP < HC (F1, 113 = 5.41, P = .02, d = 0.644). (2c) Note: ICCall sites ≥ 0.7 for third ventricle, ICCall sites ≥ 0.9 for lateral ventricles, caudate, and putamen.
*E <20 y SSD > HC (F
1, 66 = 4.34, P = .04, d = 0.154). *F <20 y AFP > HC (F1, 113 = 5.79, P = .02, d = 0.667). *G <20 y AFP > HC (F1,
cellular level, and if and how they affect clinical pheno-type and course of illness, are not yet understood, war-ranting further study.47
Our study also indicates that using linear statisti-cal approaches to assess the effect of age on diagnosis-related brain abnormalities leads to finding no or much less marked differences among diagnostic groups. This was clearly the case in our ANCOVA (supplementary
material 4) despite using a large sample and carefully
handling potential confounders. In our study, although acknowledging the problem with age strata, separate ANCOVA showed that some (but not all) diagnosis-related abnormalities in FEP patients are evident for only “early-onset” groups. This was true even when there was a higher probability of type II errors due to decreased subgroup sample sizes.
Results derived from this study should be interpreted in the context of several limitations. Firstly, in this study “age at psychosis onset” was made comparable to “age at scan” and patients were scanned around the time of onset of positive psychotic symptoms. Onset of positive symptoms may not reflect the actual psy-chotic onset itself and cognitive/negative symptoms are hard to assess accurately using retrospective assess-ments. There may be a possibility that patients with early cognitive impairment have less resilience and therefore manifest reality distortion (ie, a psychotic episode) earlier such that detected brain abnormalities are actually more related to a psychopathology domain than to the onset of psychosis. We cannot rule out this possibility with the current study design. Furthermore, there is a possibility that reported brain abnormali-ties may, to some extent, represent the effect of both
emergence and progression of psychosis over the ini-tial months of the psychotic break.48 However, age at
scan is an objective and reliable measure, as this is a relatively recent-onset sample (mean time since first positive symptoms = 151.94 d) and no significant asso-ciations were found between time since first psychotic symptoms or any of the morphometric measurements under study. Secondly, we used 12-month follow-up diagnosis to categorize patients into psychosis sub-groups, but diagnosis could change over time.32,33,49 Yet,
the OP group was not included in the nonparametric analysis. Thirdly, there was considerable interindividual variability in morphometric measurements, as reflected in the wide CI of the curves, which was more marked in some regions and groups (temporal lobe; affective patients). This variance may decrease the probability of detecting group differences. Fourthly, SSD and younger patients had greater symptom severity, allowing for the possibility that psychopathology modulate brain mor-phology.50 This warrants caution when interpreting our
results. Fifthly, both antipsychotics15,51 and lithium52,53
have been reported to be potential confounders of the brain abnormalities found in FEP patients. However, treatment duration in our sample was relatively short (mean of 80.6 d of antipsychotic exposure and 18.8 d of lithium exposure). Sixthly, despite the use of site as a covariate and despite conducting a reproducibil-ity study beforehand, it is difficult to argue that the effect of site is fully controlled for, so results need to be interpreted with caution. Seventhly, as the PEPs was an observational study, the effect of other potentially relevant confounders that may affect brain structure was not assessed (eg, pubertal status). Finally, although
we corrected for the number of group comparisons, we did not apply any formal correction for the number of variables tested, because of the type of nonparametric
procedure used and as the study was exploratory (ie, assessing whether different ages at FEP affect the dif-ferences in brain structure between cases and controls
Fig. 3. Differences between diagnostic groups in cortical thickness measurements (“y”) as a function of age at scan (“x”). Standardized
residuals after controlling for site, sex, parental socioeconomic status, and estimated intelligence quotient (y axis) as a function of age at scan
(x axis). AFP, affective psychosis; HC, healthy controls; ROI, region of interest; SSD: schizophrenia spectrum disorder. (3a) Note: ICCall sites ≥
0.7 for temporal and occipital lobes, ICCsites 1–2 ≥ 0.7 for frontal lobe, ICCsites 1–2 ≥ 0.8 for parietal lobe. *A ≤15 y SSD < HC (F
1, 12 = 5.14, P = .04, d = 1.309). *B <20 y AFP > HC (F 1, 43 = 6.04, P = .02, d = 0.749). *C <18 y AFP > HC (F1, 22 = 5.35, P = .03, d = 0.987). *D <20 y AFP > HC (F1, 43 = 5.84, P = .02, d = 0.739). *E <18 y AFP > HC (F 1, 22 = 12.6, P = .002, d = 1.513). *F ≤15 y SSD < AFP (F1, 5 = 8.78, P = .03, d = 2.649). *G <20 y SSD < AFP (F 1, 30 = 6.96, P = .01, d = 0.962). *H <20 y SSD < AFP (F1, 27 = 7.21, P = .01, d = 1.034). *I <18 y SSD < AFP (F1,
22 = 6.09, P = .02, d = 1.503). (3b) Note: ICCall sites ≥ 0.7 for all ROIs. *J <18 y AFP > HC (F1, 22 = 5.31, P = .03, d = 0.981). *K ≤15 y SSD <
AFP (F1, 5 = 8.09, P = .04, d = 2.544). *L <20 y SSD < AFP (F
rather than confirming an a priori hypothesis),54,55 and
variables were not independent.
The main strengths of this study include the use of a nonparametric statistical approach and the large age span of the sample, the use of a large patient sample with recent FEP onset, the careful patient-control matching strategy and handling of potential confounders; and the reproducibility study conducted beforehand.
In summary, our study supports that age at first epi-sode determines the type of morphological deficits found in FEP patients in a nonlinear and diagnosis-specific manner. This highlights the need for studies that take into account the nonlinear effect of age when interpret-ing structural brain deficits in wide age-range samples. In addition, our study reflects how the brain is differently affected in psychosis patients depending on maturational stage, particularly when still undergoing major develop-mental changes, and highlights the need for longitudinal studies to further assess abnormal brain developmental trajectories from the very early stages and throughout the illness.
Supplementary Material
Supplementary material is available at
http://schizophre-niabulletin.oxfordjournals.org Funding
This work was supported by the Spanish Ministry of Economy and Competitiveness, Instituto de Salud Carlos III (PI081203, PI1101686); CIBERSAM; Madrid Regional Government (S2010/BMD-2422 AGES); European Union Structural Funds and European Union Seventh Framework Programme (HEALTH-2009-2.2.1-2-241909 [Project EU-GEI], FP7-HEALTH-2009-2.2.1-3-242114 [Project OPTiMISE], FP7- HEALTH-2013-2.2.1-2-603196 [Project PSYSCAN], FP7- HEALTH-2013-2.2.1-2-602478 [Project METSY]); Fundación Alicia Koplowitz (FAK2012, FAK2013); Fundación Mutua Madrileña (FMM2009); and ERA-NET NEURON (Network of European Funding for Neuroscience Research) (PIM2010ERN-00642). L.P.-C. has received a grant from Instituto de Salud Carlos III, Spanish Ministry of Economy of Competitiveness, and from Fundación Alicia Koplowitz.
Acknowledgments
We are extremely grateful to all subjects who took part in this study. We thank Manuel Sueiro for his meth-odological support. The authors declare that there are no conflicts of interest in relation to the subject of this study. PEPs Group: The PEPs group members were Bibiana Cabrera, Barcelona Clínic Schizophrenia Unit,
Neurosciences Institute, Hospital Clínic, CIBERSAM, Barcelona, Spain; Nuria Bargalló, Department of Psychiatry and Clinical Psychobiology, University of Barcelona, IDIBAPS, Image Diagnostic Center, Hospital Clínic, CIBERSAM, Barcelona, Spain; Carmen Moreno, Child and Adolescent Psychiatry Department, Hospital General Universitario Gregorio Marañón, School of Medicine, Universidad Complutense, IiSGM, CIBERSAM, Madrid, Spain; Yasser Alemán-Gómez, Department of Bioengineering and Aerospace Engineering, Universidad Carlos III de Madrid & Medicina y Cirugía Experimental, Hospital General Universitario Gregorio Marañón, IiSGM, CIBERSAM, Madrid, Spain; Myriam Fernández, Department of Psychiatry, Hospital Universitario de Álava (Sede Santiago), EHU/University of the Basque Country, CIBERSAM, Vitoria, Spain; Itxaso González, Department of Psychiatry, Hospital Universitario de Álava (Sede Santiago), EHU/University of the Basque Country, CIBERSAM, Vitoria, Spain; Nicolás Fayed, Department of Radiology, Quiron Hospital, Zaragoza, Spain; Maria-Fe Barcones, Hospital Universitario Miguel Servet, Department of Medicine and Psychiatry, University of Zaragoza, Zaragoza, Spain; Eduardo J. Aguilar, Department of Medicine, University of Valencia, CIBERSAM, Valencia, Spain; Gracian Garcia-Marti, Biomedical Engineering, Quiron Hospital, CIBERSAM, Valencia, Spain; Antonio Bulbena, IMIM (Hospital del Mar Medical Research Institute), Institut de Neuropsiquiatria i Addiccions, Hospital del Mar & Department of Psychiatry, Universidad Autonoma, Barcelona, Spain; Daniel Bergé, IMIM (Hospital del Mar Medical Research Institute), Institut de Neuropsiquiatria i Addiccions, Hospital del Mar, CIBERSAM, Barcelona, Spain; Eduard Vieta, Barcelona Bipolar Disorders Unit, Neurosciences Institute Hospital Clínic, CIBERSAM, Department of Psychiatry and Clinical Psychobiology, University of Barcelona, IDIBAPS, Barcelona, Spain; Carla Torrent, Barcelona Bipolar Disorders Unit, Neurosciences Institute Hospital Clínic, CIBERSAM, Department of Psychiatry and Clinical Psychobiology, University of Barcelona, IDIBAPS, Barcelona, Spain; Josefina Castro-Fornieles, Department of Child and Adolescent Psychiatry and Psychology, SGR-489, Neurosciences Institute, Hospital Clínic, CIBERSAM, Department of Psychiatry and Clinical Psychobiology, University of Barcelona, IDIBAPS, Barcelona, Spain; Inmaculada Baeza, Department of Child and Adolescent Psychiatry and Psychology, SGR-489, Neurosciences Institute, Hospital Clínic, CIBERSAM, Barcelona, Spain; Fernando Contreras, Psychiatry Department, Bellvitge University Hospital-IDIBELL, Department of Clinical Sciences, School of Medicine, University of Barcelona, CIBERSAM, Barcelona, Spain; Auria Albacete, Psychiatry Department, Bellvitge University Hospital-IDIBELL, Department of Clinical Sciences,
School of Medicine, University of Barcelona, Barcelona, Spain; Julio Bobes, Department of Medicine, Psychiatry Area, University of Oviedo, INEUROPA, CIBERSAM, Oviedo, Spain; Maria Paz García-Portilla, Department of Medicine, Psychiatry Area, University of Oviedo, INEUROPA, CIBERSAM, Oviedo, Spain; Roberto Rodriguez-Jimenez, Department of Psychiatry, Hospital Universitario 12 de Octubre, Instituto de Investigación Hospital 12 de Octubre (i+12), Universidad Complutense, CIBERSAM, Madrid, Spain; Isabel Morales-Muñoz, Department of Psychiatry, Hospital Universitario 12 de Octubre, Instituto de Investigación Hospital 12 de Octubre (i+12), Universidad Complutense, CIBERSAM, Madrid, Spain; Judith Usall, Research Unit, Parc Sanitari Sant Joan de Déu, Universitat de Barcelona (UB), CIBERSAM, Barcelona, Spain; Anna Butjosa, Research Unit, Parc Sanitari Sant Joan de Déu, Universitat de Barcelona (UB), CIBERSAM, Barcelona, Spain; Ramón Landin-Romero, CIBERSAM, Spain & ARC Centre of Excellence in Cognition and its Disorders, Neuroscience Research Australia, Sydney, New South Wales, Australia; Edith Pomarol-Clotet, FIDMAG Hermanas Hospitalarias, CIBERSAM, Barcelona, Spain.
References
1. Courchesne E, Chisum HJ, Townsend J, et al. Normal brain development and aging: quantitative analysis at in vivo MR imaging in healthy volunteers. Radiology. 2000;216:672–682.
2. Gogtay N, Giedd JN, Lusk L, et al. Dynamic map-ping of human cortical development during childhood through early adulthood. Proc Natl Acad Sci USA. 2004;101:8174–8179.
3. Shaw P, Kabani NJ, Lerch JP, et al. Neurodevelopmental trajectories of the human cerebral cortex. J Neurosci. 2008;28:3586–3594.
4. Giedd JN, Raznahan A, Alexander-Bloch A, Schmitt E, Gogtay N, Rapoport JL. Child psychiatry branch of the National Institute of Mental Health longitudinal structural magnetic resonance imaging study of human brain develop-ment. Neuropsychopharmacology. 2015;40:43–49.
5. Greenstein D, Lerch J, Shaw P, et al. Childhood onset schizo-phrenia: cortical brain abnormalities as young adults. J Child Psychol Psychiatry. 2006;47:1003–1012.
6. Thompson PM, Vidal C, Giedd JN, et al. Mapping adoles-cent brain change reveals dynamic wave of accelerated gray matter loss in very early-onset schizophrenia. Proc Natl Acad Sci USA. 2001;98:11650–11655.
7. Burke L, Androutsos C, Jogia J, Byrne P, Frangou S. The Maudsley Early Onset Schizophrenia Study: the effect of age of onset and illness duration on fronto-parietal gray matter. Eur Psychiatry. 2008;23:233–236.
8. Janssen J, Alemán-Gómez Y, Schnack H, et al. Cortical mor-phology of adolescents with bipolar disorder and with schiz-ophrenia. Schizophr Res. 2014;158:91–99.
9. Rimol LM, Hartberg CB, Nesvåg R, et al. Cortical thickness and subcortical volumes in schizophrenia and bipolar disor-der. Biol Psychiatry. 2010;68:41–50.
10. Rimol LM, Nesvåg R, Hagler DJ Jr, et al. Cortical volume, surface area, and thickness in schizophrenia and bipolar dis-order. Biol Psychiatry. 2012;71:552–560.
11. Voets NL, Hough MG, Douaud G, et al. Evidence for abnor-malities of cortical development in adolescent-onset schizo-phrenia. Neuroimage. 2008;43:665–675.
12. Janssen J, Reig S, Parellada M, et al. Regional gray matter volume deficits in adolescents with first-episode psychosis. J Am Acad Child Adolesc Psychiatry. 2008;47:1311–1320. 13. Narr KL, Toga AW, Szeszko P, et al. Cortical thinning in
cin-gulate and occipital cortices in first episode schizophrenia. Biol Psychiatry. 2005;58:32–40.
14. Olabi B, Ellison-Wright I, Bullmore E, Lawrie SM. Structural brain changes in First Episode Schizophrenia compared with Fronto-Temporal Lobar Degeneration: a meta-analysis. BMC Psychiatry. 2012;12:104.
15. Radua J, Borgwardt S, Crescini A, et al. Multimodal meta-analysis of structural and functional brain changes in first episode psychosis and the effects of antipsychotic medica-tion. Neurosci Biobehav Rev. 2012;36:2325–2333.
16. Adriano F, Spoletini I, Caltagirone C, Spalletta G. Updated meta-analyses reveal thalamus volume reduction in patients with first-episode and chronic schizophrenia. Schizophr Res. 2010;123:1–14.
17. Giedd JN, Jeffries NO, Blumenthal J, et al. Childhood-onset schizophrenia: progressive brain changes during adolescence. Biol Psychiatry. 1999;46:892–898.
18. Jacobsen LK, Giedd JN, Vaituzis AC, et al. Temporal lobe morphology in childhood-onset schizophrenia. Am J Psychiatry. 1996;153:355–361.
19. Janssen J, Alemán-Gómez Y, Reig S, et al. Regional specific-ity of thalamic volume deficits in male adolescents with early-onset psychosis. Br J Psychiatry. 2012;200:30–36.
20. El-Sayed M, Steen RG, Poe MD, et al. Brain volumes in psychotic youth with schizophrenia and mood disorders. J Psychiatry Neurosci. 2010;35:229–236.
21. Farrow TF, Whitford TJ, Williams LM, Gomes L, Harris AW. Diagnosis-related regional gray matter loss over two years in first episode schizophrenia and bipolar disorder. Biol Psychiatry. 2005;58:713–723.
22. Arango C, Fraguas D, Parellada M. Differential neurodevelop-mental trajectories in patients with early-onset bipolar and schiz-ophrenia disorders. Schizophr Bull. 2014;40(suppl 2):S138–S146. 23. Kyriakopoulos M, Perez-Iglesias R, Woolley JB, et al. Effect
of age at onset of schizophrenia on white matter abnormali-ties. Br J Psychiatry. 2009;195:346–353.
24. Takahashi T, Wood SJ, Soulsby B, et al. An MRI study of the superior temporal subregions in first-episode patients with various psychotic disorders. Schizophr Res. 2009;113:158–166. 25. Tordesillas-Gutierrez D, Koutsouleris N, Roiz-Santiañez R,
et al. Grey matter volume differences in non-affective psycho-sis and the effects of age of onset on grey matter volumes: A voxelwise study. Schizophr Res. 2015;164:74–82.
26. Velakoulis D, Pantelis C, McGorry PD, et al. Hippocampal volume in first-episode psychoses and chronic schizophrenia: a high-resolution magnetic resonance imaging study. Arch Gen Psychiatry. 1999;56:133–141.
27. Bernardo M, Bioque M, Parellada M, et al. Assessing clinical and functional outcomes in a gene-environment interaction study in first episode of psychosis (PEPs). Rev Psiquiatr Salud Ment. 2013;6:4–16.
28. American Psychiatric Association. Diagnostic and Statistical Manual of Mental Disorders. 4th ed. Washington, DC: American Psychiatric Association; 1994.
29. Fischl B, Salat DH, Busa E, et al. Whole brain segmentation: automated labeling of neuroanatomical structures in the human brain. Neuron. 2002;33:341–355.
30. Desikan RS, Ségonne F, Fischl B, et al. An automated labe-ling system for subdividing the human cerebral cortex on MRI scans into gyral based regions of interest. Neuroimage. 2006;31:968–980.
31. Alemán-Gómez Y, Janssen J, Schnack H, et al. The human cerebral cortex flattens during adolescence. J Neurosci. 2013;33:15004–15010.
32. Castro-Fornieles J, Baeza I, de la Serna E, et al. Two-year diagnostic stability in early-onset first-episode psychosis. J Child Psychol Psychiatry. 2011;52:1089–1098.
33. Schwartz JE, Fennig S, Tanenberg-Karant M, et al. Congruence of diagnoses 2 years after a first-admission diag-nosis of psychosis. Arch Gen Psychiatry. 2000;57:593–600. 34. Härdle W. Smoothing Techniques, With Implementations in S.
New York: Springer; 1991.
35. Park BU, Turlach BA. Practical performance of several data driven bandwidth selectors. Computational Statistics 1992;7:251–270.
36. R Development Core Team. R: A Language and Environment for Statistical Computing. Vienna, Austria: R Foundation for Statistical Computing; 2013.
37. Cohen J. Statistical Power Analysis for the Behavioral Sciences. 2nd ed. Mahwah, NJ: Lawrence Erlbaum Associates; 1988. 38. Nie J, Li G, Shen D. Development of cortical
anatomi-cal properties from early childhood to early adulthood. Neuroimage. 2013;76:216–224.
39. Ivleva EI, Bidesi AS, Keshavan MS, et al. Gray matter vol-ume as an intermediate phenotype for psychosis: Bipolar-Schizophrenia Network on Intermediate Phenotypes (B-SNIP). Am J Psychiatry. 2013;170:1285–1296.
40. Koo MS, Levitt JJ, Salisbury DF, Nakamura M, Shenton ME, McCarley RW. A cross-sectional and longitudinal magnetic resonance imaging study of cingulate gyrus gray matter volume abnormalities in first-episode schizophrenia and first-episode affective psychosis. Arch Gen Psychiatry. 2008;65:746–760. 41. Rotge JY, Lemogne C, Hinfray S, et al. A meta-analysis of
the anterior cingulate contribution to social pain. Soc Cogn Affect Neurosci. 2015;10:19–27.
42. Modinos G, Allen P, Frascarelli M, et al. Are we really map-ping psychosis risk? Neuroanatomical signature of affec-tive disorders in subjects at ultra high risk. Psychol Med. 2014;44:3491–3501.
43. Raznahan A, Shaw PW, Lerch JP, et al. Longitudinal four-dimensional mapping of subcortical anatomy in human development. Proc Natl Acad Sci USA. 2014;111:1592–1597. 44. Mathew I, Gardin TM, Tandon N, et al. Medial temporal lobe
structures and hippocampal subfields in psychotic disorders: find-ings from the Bipolar-Schizophrenia Network on Intermediate Phenotypes (B-SNIP) study. JAMA Psychiatry. 2014;71:769–777. 45. Arnold SJ, Ivleva EI, Gopal TA, et al. Hippocampal volume
is reduced in schizophrenia and schizoaffective disorder but not in psychotic bipolar I disorder demonstrated by both manual tracing and automated parcellation (FreeSurfer). Schizophr Bull. 2015;41:233–249.
46. Ebdrup BH, Glenthøj B, Rasmussen H, et al. Hippocampal and caudate volume reductions in antipsychotic-naive first-episode schizophrenia. J Psychiatry Neurosci. 2010;35:95–104. 47. Arango C, Moreno C, Martínez S, et al. Longitudinal brain
changes in early-onset psychosis. Schizophr Bull. 2008;34:341–353. 48. Pantelis C, Yücel M, Wood SJ, et al. Structural brain imag-ing evidence for multiple pathological processes at different stages of brain development in schizophrenia. Schizophr Bull. 2005;31:672–696.
49. Addington J, Chaves A, Addington D. Diagnostic stabil-ity over one year in first-episode psychosis. Schizophr Res. 2006;86:71–75.
50. Padmanabhan JL, Tandon N, Haller CS, et al. Correlations between brain structure and symptom dimensions of psy-chosis in schizophrenia, schizoaffective, and psychotic bipo-lar I disorders. Schizophr Bull. 2015;41:154–162.
51. Lesh TA, Tanase C, Geib BR, et al. A multimodal analy-sis of antipsychotic effects on brain structure and func-tion in first-episode schizophrenia. JAMA Psychiatry. 2015;72:226–234
52. Ho BC, Andreasen NC, Ziebell S, Pierson R, Magnotta V. Long-term antipsychotic treatment and brain volumes: a longitudinal study of first-episode schizophrenia. Arch Gen Psychiatry. 2011;68:128–137.
53. Hafeman DM, Chang KD, Garrett AS, Sanders EM, Phillips ML. Effects of medication on neuroimaging find-ings in bipolar disorder: an updated review. Bipolar Disord. 2012;14:375–410.
54. Brandt J. 2005 INS Presidential Address: neuropsycho-logical crimes and misdemeanors. Clin Neuropsychol. 2007;21:553–568.
55. Perneger TV. What's wrong with Bonferroni adjustments. BMJ. 1998;316:1236–1238.