This is an author version of the contribution published on:
E. BACCHIOCCHI;F. MONTOBBIO
International knowledge diffusion and home-bias effect. Do USPTO & EPO
patent citations tell the same story?
SCANDINAVIAN JOURNAL OF ECONOMICS (2010) 112(3)
DOI: 10.1111/j.1467-9442.2010.01614.x
The definitive version is available at:
International knowledge diffusion and home-bias effect.
Do USPTO & EPO patent citations tell the same story?
∗
Emanuele Bacchiocchi
†and
Fabio Montobbio
‡16th February 2010
Abstract
This paper estimates the international diffusion and obsolescence of technological knowledge by technological field and country using patent citations from the US Patent and Trademark Office (USPTO) and from the European Patent Office (EPO). We control for self-citations and for procedural and legal differences between patent offices in the citation procedures using equivalent patents. We find that: (1) there are clear biases in patent examination processes that generate citations in the two offices; (2) at the EPO we find a strong localization effect at country level, and the size is comparable to that found at the USPTO; (3) technological fields have different properties of diffusion and decay of technical knowledge in the two patent offices that do not depend upon a patent office bias; (4) using EPO data, the USA is not the leading country in terms of citations made and received as occurs at the USPTO.
JEL codes: O31, O33, O34
Keywords: Knowledge flows, Spillovers, Diffusion, Patents, Patent citations
I.
Introduction
This paper uses patent citations to estimate the process of diffusion and obsolescence of technical
knowledge by countries and technological fields. Patent citations are increasingly used to track
knowledge flows between different applicants or inventors and assess the intensity of knowledge
spillovers and their geographical and technological scope1. Many papers show that patent
∗We are grateful to Stefano Breschi, Bruno Cassiman, Dirk Czarnitzki, Bronwyn Hall, Dietmar Harhoff,
Deepak Hedge, Katrin Hussinger, Adam Jaffe, Nicolas Van Zeebrooeck and two anonymous referees. Usual caveats apply. We also thank Gianluca Tarasconi for his valuable assistance with data.
†University of Milan.
‡Corresponding author. University of Insubria, Varese and KITeS - Bocconi University, Milan. E-mail:
1An enormous number of articles use patents and patent citations. Griliches (1990) provides a path-breaking
and renowned survey and OECD (1994) is a highly referenced manual. A set of important papers from the NBER group is collected together in Jaffe and Trajtenberg (2002). Trajtenberg (1990), Harhoff et al. (1999), Lanjouw and Shankermann, (2004), and Hall et al. (2005) are fundamental references on patent citations and the value of innovations. On patent citations and knowledge spillovers, there is a recent survey by Breschi et al. (2005).
citations tend to be geographically localized (Jaffe et al., 1993; Jaffe and Trajtenberg, 1999;
Maruseth and Verspagen, 2002; Bottazzi and Peri, 2003; Peri, 2005; Criscuolo and Verspagen,
2008; Breschi and Lissoni, 2009). In particular, Jaffe and Trajtenberg (1999) analyze patent
citations at the US Patent and Trademark Office (USPTO) and show the existence of a
home-bias in USPTO patent citations: an inventor from one country is much more likely to cite
other inventors from the same country compared to inventors from other countries - this is
especially true for American inventors. Secondly, they suggest that the USA is the most open
and interconnected technological system as US inventors tend to make and receive more citations
than inventors from other countries. This paper asks whether these results are generated by
the specific organizational characteristics of the USPTO or rather reflect true phenomena. The
empirical exercise is based upon the comparison of results from the USPTO and the European
Patent Office (EPO).
We study the process of diffusion and decay of technological knowledge and estimate
sepa-rately at the USPTO and EPO the citation-lag distribution for six different technological fields
and five countries. We take into account many features of the citation process. In particular,
we underline a “patent office”effect due to the different specific institutional practices and legal
rules that generate citations to previous patents. This issue is addressed with a quasi-structural
model as proposed by Caballero and Jaffe (1993) and discussed in Jaffe and Trajtenberg (1996)
and Hall et al. (2001) in order to address the truncation bias in our data: recent cohorts of
patents are less likely to be cited than older ones, because the pool of potential citing patents
is smaller.
Controlling for the presence of self-citations and using patent equivalents, we find the
fol-lowing four main results: 1) there are clear biases in the patent examination processes that
generate citations in the two offices. Despite these biases, 2) at the EPO we find a strong
localization effect at country level, and the size is comparable to that found at the USPTO. 3)
Not only are there some differences across technologies in the knowledge diffusion path, but also
technological fields have different properties of diffusion and decay of technical knowledge in the
two patent offices. These differences cannot be attributed to a patent office bias because using
at the sectoral level is very similar in the two offices. Rather, they have to be attributed to
dif-ferences in the patent activity in the two patent systems. 4) Finally, using EPO data, the USA
is not the leading country in terms of citations made and received as occurs at the USPTO.
This result reported by Jaffe and Trajtenberg (1999) is affected by the different legal rules and
patent examination procedures that generate citations in the two offices. In addition to the
four main results, we show on the methodological side that at the USPTO the approximate
median lag is twice as large relative to the citations at the EPO and that using patent families
generates a selection bias in the direction of patents with a higher value.
The paper is organized into six sections. The following section explains the background and
motivation of the paper, Section III describes our data and shows the differences between the
USPTO and the EPO data. Section IV describes the model and the econometric specification.
Section V shows the results and gives possible interpretations. Section VI provides concluding
observations.
II.
Background and Motivation
Recent macroeconomic modelling has underlined the importance of knowledge spillovers and
externalities, suggesting that the equilibrium path of productivity growth may differ according
to the extent of the diffusion of knowledge2. In fact, recent works have shown the usefulness
of patent citations for exploring knowledge flows across regions, countries and technologies (see
footnote 1). In patent documents, citations are used by examiners and applicants to show the
degree of novelty and inventive steps of the patent claims. They are located in the patent
text, usually by either the inventor’s attorneys or by patent office examiners (depending upon
national regulations, see below for details about the EPO and USPTO) and, once published,
provide a legal delimitation of the scope of the property right. Therefore citations identify the
antecedents upon which the invention stands and, for this reason, they are increasingly used in
economic research to gauge the intensity and geographical extent of knowledge spillovers and
to measure the economic value of innovations (Griliches, 1990, pp. 1688–1689). Typically both
2Many knowledge-driven macroeconomic models draw attention to the different effects on growth rates of
the different types of knowledge flows (Grossman and Helpman, 1991; Rivera-Batiz and Romer, 1991; Griffith et al., 2003 and 2004; Piga and Vivarelli, 2004).
citations from USPTO and EPO patents are used in economic analysis3.
If patent citations are an important track of knowledge spillovers, the citation-lag
distribu-tion indicates for how long new technical knowledge spills over (identifying therefore a process
of knowledge diffusion and obsolescence) and the time needed to observe a sufficient number of
forward citations4and, consequently, to evaluate the importance of the invention. Available
em-pirical evidence regarding citation-lag distribution is mainly based on USPTO data and shows
that the modal lag is about five years and that intra-industry citations are much more likely
than inter-industry ones (Jaffe and Trajtenberg, 1996, 1999). Considerable evidence shows that
patent citations tend to be localized5. Using the NBER-USPTO data Jaffe and Trajtenberg
(1999) show that patents from the same country are 30 to 80 per cent more likely to cite each
other than patents from other countries. In the same vein Peri (2005) shows that knowledge
flows tend to be geographically localized. He also uses the NBER data on patents and patent
citations from the USPTO, for a panel of 113 European and North American regions over 22
years. Turning to EPO citations, Maruseth and Verspagen (2002) use a cross-section of 112
Eu-ropean regions to show that EPO patent citations are geographically localized. Similar results,
also using EPO citations, are obtained by Bottazzi and Peri (2003).
This paper takes its start from the Jaffe and Trajtenberg (1999) results. We ask to what
extent the higher propensity of inventors to cite other inventors from the same country means
that there are real localized knowledge flows or, alternatively, the result is generated by the
specific organizational characteristics of the USPTO. Could it be for example just an artifact
of the search process of the citing behaviour of patent attorneys and examiners? Table 1 looks
at 657,151 patent families6 with at least two equivalent patents: one at the EPO and one at
3The use of patent citations as an index of knowledge flow has been validated by Jaffe et al. (2000) for
the USPTO (with a survey of inventors) and by Duguet and MacGarvie (2005) for the EPO (with Community Innovation Survey data). Jaffe et al. (1993), Verspagen (1997), Maruseth and Verspagen (2002), Malerba and Montobbio (2003) and Malerba et al. (2007) provide evidence on the nature and types of knowledge spillovers using patent citations.
4The citations received by a patent are called “forward citations”. Forward measures are typically informative
of the subsequent impact of an invention. Conversely, “backward citations”are those included in a patent that refer to an antecedent body of knowledge.
5The classic reference is Jaffe et al. (1993). They show that citing patents are up to three times more likely
than control patents to come from the same state as the cited ones, and up to six times more likely from the same metropolitan area. Their methodology and particularly, the way the control sample is constructed have been challenged by Thompson and Fox Kean (2005). A response can be found in Henderson et al. (2005).
6According to OECD (1994; p. 28) ”The (patent) family comprises all the patent documents covering the
the USPTO (the details are explained below in Section V). Column 1 shows the distribution of
the citing patents by the first inventor’s country (which is the same in the two patent offices).
Columns 2 and 3 show the distribution across countries of the cited patents using respectively
the USPTO and EPO patent citations.
[Table 1, about here]
Table 1 shows that 41.6 per cent of citing patents are from American inventors. However,
the two distributions of cited patents show that at the USPTO, the frequency of American cited
patents exceeds 65 per cent, while at the EPO, the same frequency is less than 40 per cent. The
more general result is that, while at the EPO the distribution of cited patents approximately
reflects those of the citing ones, at the USPTO this is unbalanced toward the American-cited
patents. This evidence is affected by the distributions of the potential cited patents in the two
datasets (see below Table 2) and suggests that some bias may exist in the USPTO results. In
order to isolate the organizational effect and to explore the nature of the home-bias, we use
a coherent methodology to test whether, for example, American patents that are granted by
the EPO are also more likely to cite other American patents granted by the EPO, under the
assumption that the EPO examiners are not biased toward searching relevant American prior
art.
Moreover, there are important sectoral variations in the process of diffusion and decay of
technological knowledge. In particular, Jaffe and Trajtenberg (1996) and Hall et al. (2001)
show that patents in Electronics, Computers and Communications are more highly cited than
other sectors of the economy during the first few years after grant and, at the same time, they
decay much faster. Also patents in Drugs and Medical are more highly cited than patents in
other sectors, but knowledge, in this case, has a slower pace of decay. This is explained in terms
of long lead times in pharmaceutical research (and in approval procedures by the Federal Drug
Administration). Therefore, this field is not evolving as fast as Electronics, or Computers and
Communications and new products arrive at a slower rate in the market (Jaffe and Trajtenberg,
1996; Hall et al., 2001).
foreign versions of the application.” There different types of patent families. We follow Haroff et al. (2007) and include patents in the same family when they have the same Paris Convention priorities (see also below for a further discussion).
In order to estimate coherently the sectoral and country effects in the citation-lag
distri-bution, it is necessary to control for a set of confounding factors. In particular, the following
features of the citation process have to be taken into account: (i) “patent office”effects and (ii)
truncation bias and changes over time in the propensity to cite. (i) The modal and average lags
between citing and cited patents are deeply affected by the institutional process governing the
decision (by inventors, inventors’ attorneys or patent examiners) to include a patent citation in
the patent document. In fact, there are relevant differences between citation practices at the
USPTO and EPO. In the USA there is the ‘duty of candor’ rule, which requires all applicants
to disclose all prior art of which they are aware. Therefore, many citations at the USPTO
come directly from inventors, applicants and attorneys and are subsequently filtered by patent
examiners7. At the European Patent Office the ‘duty of candor’ rule does not exist and patent
citations are added by the patent examiners when they draft their search report8. The EPO
guidelines for patent examiners suggest including all technically relevant information within a
minimum number of citations and citations are, with few exceptions, added by the patent office
examiners (Akers, 2000; Michel and Bettels, 2001; Breschi and Lissoni, 2004; EPO, 2005). As
a result, the analysis of diffusion and obsolescence of technological knowledge and knowledge
spillovers may reveal different properties according to the patent dataset that is used and, in
particular, we expect to observe not only a much smaller number of citations at the EPO but
also a shorter lag between citing and cited patents. It is crucial therefore to control for the
different properties of the processes of obsolescence and diffusion in the two patent offices.
(ii) Secondly, three issues related to the time dimension need to be considered. First,
there is a citing year effect due to an increase, particularly at the USPTO, of the number of
citations per patent. This phenomenon of citation inflation is well known at the USPTO and
is mainly due to computerization of the search procedures and changes in the behaviour of
inventors’ attorneys and patent office examiners (for a detailed discussion of this issue, and of
7Alc`acer and Gittelman (2006), using a sample of 442,839 citing patents and 5,434,483 cited patents granted
at the USPTO over the period 2001-2003, show that 40 per cent of the cited-citing pairs are generated by patent examiners.
8The search report at the EPO is a document, published typically 18 months after the application date,
that has the main objective of displaying the prior art relevant for determining whether the invention meets the novelty and inventive step requirements. It represents what is already known in the technical field of the patent application and is a source of additional relevant documentation. Cited documents may be patents or scientific bulletins and publications. Typically cited documents refer to specific patent claims.
the econometric techniques for dealing with it, see Hall et al., 2001). We control also for a cited
year effect. This is typically related to the different fertility of different cohorts of patents.
Finally, citations data are truncated because recent cohorts of patents are less likely to be
cited than older ones, since the pool of potentially citing patents is smaller. These issues are
addressed jointly with a quasi-structural model as proposed by Caballero and Jaffe (1993) and
discussed in Jaffe and Trajtenberg (1996) and Hall et al. (2001). It is possible with this model
to identify separately the contribution to variations in the observed citation rates of changes in
the citation-lag distribution, in the propensity to cite and in the fertility of different cohorts of
patents.
III.
The data
We use the publicly available USPTO Patent and Patent Citations Database, which contains
3,449,478 USPTO (granted) patents from 1963 to 2005 and 37,730,701 citations from (and
to) USPTO, together with the European Patent Office dataset, which contains 1,702,652 EPO
patent applications from 1978 to 2005 and 1,623,094 citations from (and to) EPO patents from
1978 to 20059. From these datasets we select two samples: the universe of all patents and patent
citations between 1978 and 2002 in five countries: France, Germany, Japan, UK and USA.
Self-citations are excluded from the samples10. Summary statistics are displayed in Table 2. Each
patent is characterized by a date, a country (first inventor’s address) and a technological field
(based on the International Patent Classification for EP-CESPRI and the USPTO classification
system for the USPTO-CESPRI). Details for both datasets are provided in Appendix A.
[Table 2, about here]
As expected at the USPTO there are more patents and, in particular, many more citations
9USPTO data are available on a CD delivered directly from the USPTO and on the ftp USPTO server
(ftp://ftp.uspto.gov/pub/patdata/). EPO data come from the Espace Bulletin CD-R produced by the EPO, and patent citations from the REFI tape. PCT citations are also included. Considerable effort has been made to clean up the databases in the CESPRI Research Centre of Bocconi University and therefore we refer to the databases as respectively USPTO-CESPRI and EP-CESPRI.
10The ratios between the total number of self- citations and the total number of citations in our sample are
10 per cent at the USPTO and 32 per cent at the EPO. Since we focus on spillovers we present all our results excluding self-citations. We comment briefly below on some of the results found including also the self-citations.
per patent due to the different institutional processes underlying the citation practices. In
Table 2 the institutional, technological and country composition of the EPO and USPTO
patent samples are compared: cc is the number of (forward) citations by technological field
and nc is the number of (potential cited) patents by technological field. Table 2 shows the
sectoral and national shares sc = cc/c and pc = nc/n (in parentheses) by patent office, where
c and n are respectively the total number of citations and patents. Moreover, in Table 2 we
display an index of citation intensity equal to cintc = sc/pc. The value of cintc is affected by
the characteristics of the patents in the different technological fields. Typically, patents in the
Mechanical sector cite and receive fewer citations than Biotech patents, mainly because of the
different average patent scope in the two fields. As a matter of fact, the Mechanical and Others
sectors receive on average fewer citations than, for example, the Drugs and Medical sector in
both patent offices.
However, we observe that cintc ranks differently in the two patent offices. In particular,
at the EPO we have Drugs and Medical and Chemicals at the top, and then Electrical and
Electronics and Computers and Communications. Conversely, at the USPTO the highest value
of cintc is in Computers and Communication and then Drugs and Medical, Electrical and
Electronics and Chemicals follow. This raises the issue, discussed in the previous section, as to
which other variables affect the citation intensity of a technological field beyond its technological
characteristics. The first possible explanation is that these differences reflect the heterogeneity
of patents and companies in the two patent offices: the sets of patenting firms at the two patent
offices are different and, as long as the value of their patent stock differs, we observe different
levels of citation intensity at the level of the patent office. The second possibility is that this
depends upon the different legal and administrative procedures related to patent citations at
the EPO and at the USPTO.
Likewise, Table 2 shows the geographical composition of the patents in the two patent offices
by country of the first inventor. If the share of total (forward) citations of a country (sp) is
higher than its fraction of total patents (pp in parentheses), this indicates an above average
citation intensity (cintp) for that country. It’s worthwhile noting that, only at the USPTO the
Japan and the UK display the highest values of cintp. Of course cintcand cintp are confounded
by all the factors mentioned in the previous section. The propensity to be cited is then properly
estimated in the following sections.
IV.
Model specification and econometric framework
We describe the random process underlying the generation of citations with a quasi-structural
approach. The model follows the specification in Jaffe and Trajtenberg (1996, 1999), and Hall
et al. (2001). The diffusion process is modelled as a combination of two exponential processes,
one for the knowledge diffusion and the other for the process of obsolescence. The general
formulation of the model is
p (k, K) = α (k, K) exp [−β1(k, K) (T − t)]
× (1 − exp [−β2(k, K) (T − t)]) (1)
where p (k, K) is the likelihood that any particular patent k, granted at time t, is cited by
some particular patent K, granted at time T . The parameters β1 and β2 represent the rate of
obsolescence and diffusion, respectively, and both exponential processes depend on the citation
lag (T − t). The coefficient α does represent a multiplicative factor, as the constant term in
a simple linear regression model. However, as indicated by the dependence of α from (k, K),
such a proportionality factor α (k, K) is allowed to vary with attributes of the citing and cited
patents. The estimate of a particular α (k, K), indicates the extent to which a patent k is more
or less likely to be cited, with respect to a base characteristic patent, by a patent K.
From the formulation above, β1 and β2 single out the main features of the diffusion process.
The lag at which the citation function is maximized, i.e. the modal lag, is approximately
equal to 1/β1, while the maximum value of the citation frequency is approximately equal to
β2/β1. Such features of the model have important implications for both the estimation and
interpretation of the results. In fact, an increase in β1 simply shifts the citation function to the
left, while an increase in β2, leaving β1 unchanged, increases the overall citation intensity, at
identified from variations in the constant term α. Following Jaffe and Trajtenberg (1996), thus,
we prefer to allow variations in α, leaving β2 constant for all observations.
The constant term α and the structural parameter β1 depend on k and K. This indicates
that they depend upon particular features of both cited and citing patents. From the empirical
point of view, however, modelling single pairs of patents (citing and cited), might lead to
dealing with very small expected values. Therefore, we aggregate patents in homogeneous
groups and model the number of citations to a particular group of cited patents by a particular
group of citing patents. We wish to have a finer understanding of the statistical properties of
the citations received (forward citations), since this is the usual way of assessing the value of
patents. The following characteristics of the cited patent k might affect its citation frequency11
(see Appendix A for relative details of USPTO-CESPRI and EP-CESPRI): the application or
priority date t; the first inventor’s country p and, finally, the technological field c. Moreover,
for the citing patent K we consider the application or priority date T , and the first inventor’s
country P .
The number of citations to a specific group of cited patents by a specific group of citing
patents is: ctpcT P. Hence, a treatable formulation of the model, where the various different
effects enter as multiplicative parameters, becomes
E(ctpcT P) = (ntpc) (nT P) αtαcαTαpP exp [− (β1) β1cβ1pP(T − t)]
× (1 − exp [−β2(T − t)]) (2)
or equivalently, in the estimable form
ptpcT P =
ctpcT P
(ntpc) (nT P G)
= αtαcαTαpP exp [− (β1) β1cβ1pP (T − t)]
× (1 − exp [−β2(T − t)]) + εtpcT P (3)
where ntpc and nT P represent the total amount of potentially cited and citing patents for each
of the particular (tpc) and (T P ) groups, respectively. The model (3) can thus be estimated by
11Bacchiocchi and Montobbio (2009) use this model only for EPO data to estimate the citation lag distribution
nonlinear least squares under the well-known hypotheses on the residual terms εtpcT P.
Variations in any particular α (k) (i.e. the multiplicative coefficients related to cited patents)
should be interpreted as differences in the propensity to be cited, with respect to the base
category12. Equivalently, estimates of multiplicative coefficients related to citing patents, α (K),
indicate differences in the propensity to cite compared to a base category. All fixed effects have
been estimated relative to a base value of unity; for each effect thus, the coefficient associated
with the reference group is constrained to unity. Note that following Jaffe and Trajtenberg
(1999), we have introduced into the specification the interaction terms αpP between the cited
and citing country. In this case, the αpP coefficient indicates the relative likelihood that the
average patent granted to country p is cited by a patent granted to inventors in country P .
These interaction coefficients are at the core of our analysis because they are able to measure
the home bias effect, that is, whether an inventor from one country is more likely to cite other
inventors from the same country as compared to inventors from other countries.
A similar interpretation has to be given to variations in β1 coefficients, which represent
differences in the rate of decay across categories of cited and citing patents. Higher values
of β1, with respect to the base category, mean a faster obsolescence, which corresponds to a
downward and leftward shift in the citation function. Also, in this case we have included the
interaction terms β1pP between the citing and cited country.
One more consideration about the specification of the model concerns the difficulties in
estimating citing and cited time effects together with the citation lag; in fact, citation lags enter
the model non-linearly and the identification of all effects is not precluded a priori. However,
due to the great number of parameters to be estimated, we prefer to calculate the fixed effects
grouping cited years into five-year intervals, as in Jaffe and Trajtenberg (1996)13. Moreover,
in estimating the model we faced some problems of convergence due to the contemporaneous
presence of technological fields for cited and citing patents for both α and β1. We thus decided
to exclude technological fields for the citing patents on the β1’s.
12As an example, let us consider an estimated coefficient α ( k=Computers and Communications) = 2.86;
this means that patents belonging to the category ”Computers and Communications” have a more than double
probability (across all lags) to receive a citation in the next few years vis `a vis patents belonging to the base
field.
13Grouping cited year is a reasonable assumption as the fertility of invention does not change substantially
We estimate the model using weighted non-linear least squares. The weights are needed in
order to deal with heteroskedasticity. Since each observation is obtained dividing the number
of citations by the product of the total amount of potentially citing and potentially cited
patents corresponding to a given cell, it has been weighted by (ntpcnT P)1/2, following Jaffe and
Trajtenberg (1996) and Hall et al (2001).
[Table 3, about here]
Table 3 shows the statistics for the regression variables. The data consist of one observation
for each feasible combination of values of t, pP , c and T . For the cited patents we have 25
years, six technological fields, and five countries and for the citing patents we have 25 years and
five countries14. Hence the total amount of observations is: n obs = [(25 × 26) /2] × 6 × 5 × 5 =
48, 750. In each dataset there are some cells with zero citations. We have zeros when ctpcT P
is zero and (ntpc) (nT P) is positive. In the EP-CESPRI 6015 observations have zero citations
(12.3 per cent) while the number of zeros in the USPTO-CESPRI is 863 (1.3 per cent).
V.
Results
In this section we report and comment on the results of the estimation of Equation (3).
Signif-icant tests for any particular α (k), being a proportionality factor, focus on the null hypothesis
H0 :coeff = 1. The null hypothesis for the significance of β1 and β2, instead, remains the
stan-dard H0 : βi = 0, i = 1, 2. The results are presented in a way to facilitate the understanding
of the three main points the paper wants to address: a) the presence of a home bias effect at
USPTO and EPO; b) a test for different diffusion processes between sectors; and finally c) a
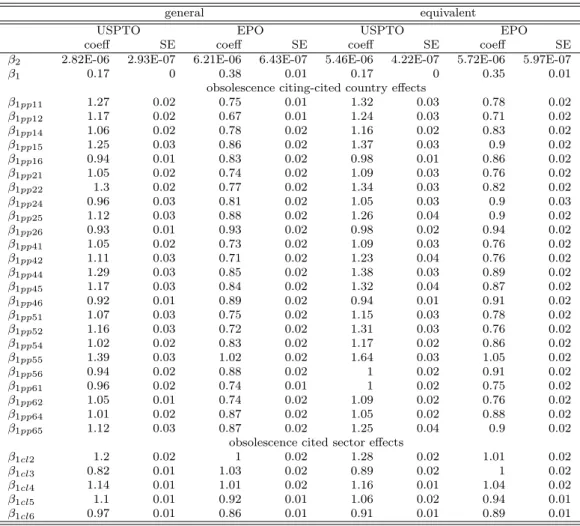
test for patent office effect. The complete set of estimated parameters, with related standard
errors, is reported in Table 9.
Some general features about the estimated diffusion processes should be preliminarily
under-lined. The main general result can be observed from Figure 1. The shapes of the two diffusion
functions are based upon the estimated β1 and β2 coefficients for the two datasets. The rate of
decay for the USPTO is β1 = 0.173 while the one for the EPO is β1 = 0.375. Concerning the β2
coefficients, we obtain that for the USPTO β2 = 2.82×10⁻⁶while for the EPO β2 = 6.21×10⁻⁶.
These results show that patents at the EPO have a higher probability of being cited during the
first few years but this probability decreases faster as time elapses with respect to patents at
the USPTO. The likelihood that a EPO patent is cited becomes half of its estimated maximum
after about 6-7 years while for the USPTO patents, this occurs after 14-15 years. Moreover,
after 20 years the estimated probability for an EPO patent to be cited is almost zero, but for a
USPTO patent it is still one fourth of its maximum value. This is consistent with the different
processes of assigning citations in the different patent offices outlined in Section II.
[Figure 1, about here]
A second general result refers to the estimated time effects for the citing years. The
es-timated citing year effects at the USPTO do not show any upward trend. All eses-timated
co-efficients appear to be greater than one but in many cases they are not significantly different
from one. At the EPO on the other hand, the αT display a steep downward trend. As the
number of potential citing and cited patents increases over time in both datasets, the number
of citations per patent grows faster at the USPTO than at the EPO. This creates the observed
decline in the coefficients for the EPO and the absence of a trend for the USPTO15. Finally,
for the cited time effects a substantial absence of fertility changes characterizes both datasets.
Although the double exponential formulation does not forecast zero probabilities, the adjusted
R2 are ¯R2 = 0.87 for the USTPO and ¯R2 = 0.76 for the EPO. The good approximation for the
two models is not surprising if one observes that the percentage of zeros is 12.3% for the EPO
data while only 1.3% for the USPTO.
Home Bias Effects at USPTO and EPO
In Table 4 we report the estimated coefficients for country interactions in matrix form for
both USPTO and EPO data. In particular, we report the α’s in the upper part of the table, the
15To substantiate this conjecture we calculated the differences in level and trend of the raw amount of backward
citations per citing patent in the two datasets (note that in the two datasets we have the same left truncation bias because we do not consider citations that go to patents granted, or applied for, before 1978). At the EPO backward citations per patent are 1.16 in 1979, they reach a maximum in 1994 at 2.10, declining slightly afterwards. At the USPTO backward citations per patent are 1.26 in 1979 and they grow more steeply reaching a maximum in 1995 at 8.28.
lag (expressed in years) at which the citation frequency reaches its maximum value (1/β1) in the
second panel, and, in the third panel, an estimation of the expected number of citations that
a single patent could potentially receive for all future years16, i.e. αβ2/ (β1) 2
. The estimated
α’s measure the citation intensity (or “fertility”or “importance”) relative to a base category,
and the β1’s measure the speed of diffusion. Higher values of β1 signify a higher rate of decay.
Note that higher values of α and higher values of β1 would generate offsetting effects on the
citation lag distribution. To understand which parameter dominates it is therefore necessary
to estimate the overall cumulative frequencies αβ2/ (β1)2.
Concerning the α’s it is possible to look at the data by row and by column. If we look at
the data by row the citation intensity varies with the characteristics of the citing patents and it
has to be interpreted as the probability of making a citation. So we observe variation in the use
of knowledge. For example, in the case of USPTO data if P =France and p=USA, αpP = 0.38
means that the average patent granted to a French inventor is 38% as likely as a patent granted
to a US inventor to cite any given US patent. If we look at the data by column, the citation
intensity varies with the characteristics of the cited patents and it has to be interpreted as the
probability of receiving a citation. So we observe variation in the importance or fertility of
knowledge. Again in the case of USPTO data if P =USA and p=France, αpP = 0.44 means
that a French patent is 56% less likely to get a citation from an average US patent than is a
random US patent.
Table 4 shows that the diagonal coefficients strongly dominate both the rows and columns
of the matrix using both EPO and USPTO patents. This reinforces the pattern of geographic
localization discussed in Jaffe and Trajtenberg (1999) in two respects: first, because we use
more recent USPTO data (they use data up to 1994, we use data up to 2002); second, our
results show that also at the EPO, with very different citation practices, domestic citations are
more likely relative to citations received from and made to other countries. This is particularly
true for the USA (at the USPTO), for the UK (in both patent offices) and for Japan (at the
EPO).
Another result of Jaffe and Trajtenberg (1999) that we can generalize using EPO data is
the symmetry of the matrices, meaning that the knowledge flows between countries tend to be
bidirectional. It is remarkable that the symmetry of the matrices is very similar using citations
from the two patent offices. In particular for the USA - both at the USPTO and at the EPO
- the highest off-diagonal α0s are for the UK citing the USA and the USA citing the UK while
the lowest off-diagonal number is for Germany citing the USA and the USA citing Germany.
Even if there is not exact correspondence in the symmetry of the two matrices it is important
to emphasize that for most countries the highest off-diagonal elements are the same in both
matrices and describe bi-directional relationships (e.g. for the UK is also the USA, for Japan
is also the USA).
National localization and symmetry are also evident in the β1 coefficients, or equivalently in
the estimated modal lags, as reported in the second panel of Table 4. In this case the diagonal
elements are the smallest ones, in particular at the USPTO. The citation frequency reaches its
maximum value at shorter lags for domestic citations, relative to citations to and from other
countries. For the patents granted at the USPTO, the only exception is in the USA. Japanese,
French and British patents cite US patents with a shorter lag than the average US patent. For
the EPO data, instead, this pattern is less evident, in particular for the European countries.
British, French and German inventors do not seem to have any significantly different behaviour
when citing domestic or foreign patents. American and Japanese inventors, instead, are faster
to cite domestic patents than they are to cite foreign patents. A common result of the two
patent offices is that the fastest citing inventors are the Japanese, and in both cases, to cite
domestic patents.
The third panel in Table 4 summarizes the results for the α and β1coefficients. In particular,
it is shown that for all countries and for both patent offices, the α’s dominate the β1 coefficients.
Higher α0s in principle could be compensated by the higher obsolescence effects measured by
the β10s. The estimated overall cumulative probabilities, presented in the third panel, instead
suggest that such compensation is only partial and that the diffusion effect dominates the
obsolescence one17. The highest values on the diagonal of the matrix with respect to rows and
columns is a common result for both the USPTO and EPO data. All these empirical results
17For all combinations of countries, the estimated overall cumulative probabilities for the USPTO data are
reinforce the home bias effect highlighted in Jaffe and Trajtenberg (1999) that is not confined
to the USPTO patents, but can also be generalized to the EPO patents.
Looking at the cumulative probabilities, our evidence provides only partial support to the
claim by Jaffe and Trajtenberg (1999) that the USA has “the most open and interconnected
economic and technological system in the world”(p. 123). In order to see how the expected
number of citations to a patent varies with the country of origin of the cited patent, we compare
the cumulative probabilities by column. In this case results are the same in both datasets and
confirm the results found by Jaffe and Trajtenberg (1999). In particular, Table 4 shows that
in the UK and Japan, a random US patent is more often cited than another foreign patent. In
the US and France, a random UK patent is more cited than another foreign patent. Therefore,
US patents have relatively big impact, but UK patents are comparable.
In order to see how the expected number of citations made by a patent varies with the
country of origin of the citing patent, we compare the cumulative probabilities by row. The
USPTO data show that patents from all countries are more likely to be cited by a random US
patent than by any other foreign patent. In this case results for the USPTO confirm Jaffe and
Trajtenberg (1999) and show that at the USPTO the US inventors tend to make more citations
than other countries. This is not true at the EPO where the French patents are the ones that
have the overall highest probability to cite foreign patents. In sum, even if with USPTO data we
replicate the Jaffe and Trajtenberg (1999) results, using EPO data we show that the American
technological system cannot be considered unequivocally the most open and interconnected and
American patents cannot be considered the leading source of citations per patent. However, a
question remains open as to whether these differences may be due to differences in the citation
practices in the two offices or to a real economic phenomenon. We tackle this issue below,
where we discuss the patent office effect.
[Table 4, about here]
In order to verify the robustness of our results, we performed the following other
regres-sions18. First of all, we re-estimated the model for both datasets including the self-citations.
As expected, the results show an even stronger localization effect. Self-citations also have a
shorter modal lag both at the EPO and at the USPTO and with self-citations the rate of decay
for the USPTO is β1 = 0.19 (instead of 0.173) while the rate for the EPO is β1 = 0.499 (instead
of 0.375). Moreover, only for the EPO data19, do we also inquire whether the citations added
by the patent examiners and, in particular, the citations that invalidate the patents20 display
different properties. This is suggested by Sampat (2005), Alc`acer and Gittelman (2006) and
Criscuolo and Verspagen (2008). Even if the usual assumption is that examiner citations are
less localized than inventor citations, we do not find a reduced localization effect at the national
level. When we consider all citations added by patent examiners we find results that are very
similar to those displayed in Table 4. When we consider only ‘invalidating’ citations we also
find a similar localization effect at the national level. At the same time, these citations have a
shorter modal lag (β1 = 0.499).
Results by Sectors
Two types of variations relative to the technological fields are considered in the model:
variations in the fixed effects αc and in the obsolescence parameter β1c. The base field is
Chemicals for both the USPTO and the EPO databases.
The estimated coefficients αc partially confirm the results displayed for cintc in Table 2,
particularly for the USPTO data. The propensity to be cited is higher in Computers and
Communications, Drugs and Medical and Electrical and Electronics at the USPTO and in
Drugs and Medical and Computers and Communications at the EPO.
At the USPTO Electrical and Electronics, Mechanicals and Computers and Communications
have the highest rate of decay (β1c) and reach their modal lag earlier with respect to the other
technological fields. In fourth place is Chemicals and the lowest β1cis in Drugs and Medical (this
broadly confirms the results of Jaffe and Trajtenberg, 1996, and Hall et al., 2001). At the EPO,
Chemicals, Drugs and Medical, Electrical and Electronics, Computers and Communications
19USPTO data are not available for most of the time period we have used. Alc`acer and Gittelman (2006),
however, do not find strong evidence in USPTO data that the geographical distributions of examiner and
inventor citations are significantly different (Alc`acer and Gittelman, 2006).
20In particular we considered citation category X and citation category Y. X-citations are particularly relevant
documents which when taken alone imply that the claimed invention cannot be considered novel or cannot be considered to involve an inventive step. Y-citations are particularly relevant if combined with another document of the same category.
sectors display almost the same obsolescence while Mechanicals and Others display a slightly
lower decay rate. In Table 5 we report both the β1c coefficients and the estimated modal lag
for all the sectors and for both datasets. The sectoral ranking in the modal lag across sectors
is different in the two offices. For example, Drugs and Medical at the USPTO has the largest
modal citation lag (7 years) while at the EPO the same sector shows the smallest value.
[Table 5, about here]
As for the previous case, in order to observe the joint result of the diffusion and obsolescence
effects, we calculate the overall cumulative probabilities for all the aggregate sectors. All the
results are reported in Table 5, in the fourth column of each block. In line with the general
results commented on above, the cumulative probabilities for the USTPO are larger than those
for the EPO. In particular, the cumulative probability of receiving a citation belonging to the
Drugs and Medical and Computer and Communication sectors are four times higher at the
USTPO compared to the EPO. For these two sectors, however, in the USPTO patent office the
β1c coefficients dominate the αc’s. Although the Computer and Communication sector presents
a higher diffusion coefficient than Drugs and Medical (αc= 2.86 against αc= 1.58), the faster
obsolescence of the former makes the overall probability of receiving a forward citation higher
for the latter (222.5 against 186.9)21. This phenomenon does not appear in the EPO data,
mainly because the rates of decay are very close, and in particular, significantly lower than
that for the Mechanical and Other sectors only (β1c = 0.92 and β1c = 0.86, respectively). The
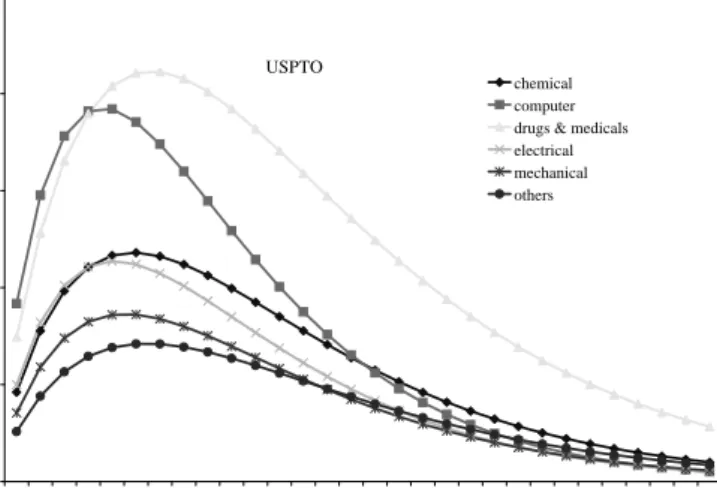
patterns of the diffusion processes for all the technological sectors are shown in Figure 2 for the
USPTO, and in Figure 3 for the EPO.
[Figure 2 and Figure 3, about here]
Patent Office Effect
In the previous sections we found clear support for a national localization of knowledge flows
but we also found some differences between the results based on USPTO and EPO patents.
In particular, looking at the EPO data we do not confirm that the USA tends to make more
21It is worth remembering that, due to the very low numbers, all the probabilities in the paper are multiplied
citations than other countries (as in Jaffe and Trajtenberg, 1999) and we do not find exactly
the same sectoral ranking in the speed of the diffusion process. It is difficult, however, to
identify whether these differences reflect true economic phenomena or depend upon institutional
and procedural differences between the two patent offices. Part of the variation comes from
the heterogeneity of patents filed in the two offices and part of the variation comes from the
procedural differences. In other words, either there is a bias in the citation procedures or there
is heterogeneity in the patent population.
In the first case (where US-invented patents are less prominent at the EPO relative to the
USPTO), the results could depend upon the fact that searches by attorneys and examiners at
the USPTO are based mainly on USPTO patents. The opposite might occur at the EPO, where
patent examiners could have a preference for patents with European priorities. If we consider
exactly the same set of citing patent applications in the two patent offices, the differences
between the results in the two patent offices should disappear unless results depend upon the
specific citation procedures of the two offices. The differences in the distribution of knowledge
sources across patent offices observed in the previous sections would reflect that there are
different citing patents at the EPO and at the USPTO with different types of knowledge
sources.
In the second case, the differences in the estimates relate to the sectoral heterogeneity in
the patterns of diffusion and decay of technological knowledge. Also in this case, if we use
exactly the same set of citing patents we should produce estimates that rank technological
fields the same way in terms of the rates of diffusion and obsolescence between the two offices.
As a result, sectoral differences, displayed in the previous section, would not be determined by
the procedural differences in the patent offices but rather by real differences in the knowledge
diffusion.
The simplest way to eliminate the heterogeneity in the patent population is to exploit
an important characteristic of the international patent system. Actually, the current dataset
includes some patents filed only in the USPTO, some patents filed only in the EPO, and some
patents filed in both offices. Using patents filed in both offices eliminates the heterogeneity
the full sample could be compared22. We have therefore selected from the EPO and USPTO
databases all the patent families with at least two equivalent patents, one at the EPO and one
at the USPTO. We end up with 657,151 families. We therefore have 657,151 patents at the
USPTO and 657,151 patents at the EPO that are equivalent, i.e. with exactly the same set of
Paris Convention priorities23. We therefore re-estimate the model (3) considering this subset
of patents. We now have 473,263 citations at the EPO and 3,457,937 citations at the USPTO.
The new regression statistics are displayed in Table 6.
[Table 6, about here]
A complete set of results is reported in the right panel of Table 9, while in Table 7 and
Table 8 country interactions and sector effects are compared for the two offices. From the
former, we confirm the general pattern of national localization of patent citations. In the upper
panel, the α coefficients on the diagonal are higher than those in the corresponding rows and
columns. In the middle panel, the modal citation lags are shorter for domestic citations, for
both EPO and USPTO offices. As for the general case, however, the diffusion coefficients
dominate the obsolescence rate, and this is clearly shown in the lower panel, when considering
overall cumulative citations (the only exception at the USPTO is represented by Japanese
patents, which receive more citations from US inventors than from Japanese ones). In general,
particularly at the USPTO, once controlled for all other factors, the cumulative number of
citations received is higher for the equivalents than for the whole set of patents. This reveals
that an inventor who strongly believes in the potentiality of his/her invention generally decides
to file the patent in both offices and that in the equivalent set, there is a selection bias towards
patents with a higher value.
[Table 7 and Table 8, about here]
22As suggested by one of the referees, another way to potentially deal with this problem is to include firm-fixed
effects in the analysis. The Jaffe and Trajtenberg model could be modified along the lines of Branstetter (2006).
23We have used a database of equivalent patents provided by Dietmar Harhoff and colleagues
at http://www.inno-tec.bwl.uni-muenchen.de/forschung/forschungsprojekte/patent cit project/index.html (see also Harhoff et al., 2007; downloaded June 2008). There are many possible definitions of patent equivalents. It is worthy to underline that they have used the most restrictive definition, that is, those patents that have exactly the same set of Paris Convention priorities. This minimizes the possibility of including two patents incorrectly in the same family. When there is more than one USPTO or EPO patent in the same family we have chosen the oldest one.
We confirm also that, according to EPO data, the USA cannot be considered as a leading
source of international knowledge flow (in terms of citations per patent). Looking at the
cumu-lative probabilities, if we compare Table 7 and Table 4 we also observe very similar results. The
important implication is that using a homogeneous set of equivalent patents, some differences
do persist between the two patent offices. We interpret this evidence as a bias introduced into
the citation procedures of the two offices. However, it should be pointed out that this bias
does not affect the other main results of the paper outlined above, in particular, the results
concerning the localization of knowledge flows and the higher speed of domestic flow of citations
in the two offices.
We also show that the patent office bias does not affect sectoral ranking in terms of diffusion
and decay. Comparing Table 8 and Table 5, the ranking of the α coefficients is exactly the same
in both USPTO and EPO data. Moreover, in this last case, the diffusion coefficient α dominates
the β1’s and the ranking concerning the overall cumulative citations strictly reflects the order of
the former while in the USPTO the rate of obsolescence of the Computer and Communication
sector is much higher than for the other sectors (in particular Drugs and Medical). All these
features are graphically represented in Figures 4 and 5. Our estimates, moreover, confirm that
the elimination of the heterogeneity in the citing population generates similar sectoral ranking
in terms of the rates of diffusion and obsolescence between the two offices. This confirms that
the differences we found in the previous section are the results of heterogeneous patenting
activity in the EPO and USPTO.
[Figure 4 and Figure 5, about here]
VI.
Conclusion
Since the early 1990s, a large body of theoretical research has focused upon the relationship
be-tween knowledge spillovers and aggregate growth. The nature and scope of knowledge spillovers
play a prominent role in determining the equilibrium path of economic growth and patent
cita-tions are increasingly used to explore knowledge flows across regions, countries and technologies.
and technological field using data from two patent offices: EPO and USPTO.
First, we show that a patent office bias exists that depends upon the different legal rules
and procedures of patent examination and approval that generate patent citations.
We control for this bias using equivalent patents and, as second result, we also confirm, with
new and more recent data, some of the results obtained by Jaffe and Trajtenberg (1996, 1999)
and Hall et al. (2001). In particular, we show that also at the EPO there is a remarkable national
localization of patent citations. This eliminates the doubts that the Jaffe and Trajtenberg
results - obtained solely on USPTO data - may depend on biases in the American examination
and patent search procedures.
Third, controlling for the patent office bias, at the EPO (relative to the USPTO) the US
technological system is less prominentin terms of citations per patent. While Jaffe and
Tra-jtenberg (1999) found, using USPTO data, that the USA make and receive more citations per
patent than other countries, this result does not show up using EPO data.
Fourth, our estimates of the citation-lag distribution confirm that there are some differences
across technologies in the diffusion path and show that technological fields have different
prop-erties of diffusion and decay of technical knowledge in the two patent offices. Computers and
Communications and Electrical and Electronics at the USPTO and Drugs and Medical at the
EPO display very high early citations and the most rapid obsolescence. Our paper shows that
these differences cannot be attributed to the different citation procedures of the two patent
offices considered and therefore reflect real differences in the process of knowledge diffusion at
the sectoral level.
This paper also provides some evidence that helps to understand the statistical properties of
patent citations in the two offices with consequences for their use as knowledge flow indicators.
In particular, we measure the distribution of citation-lags in the two offices with the same
methodology and we show that at the USPTO the approximate median lag is twice as large
relative to citations at the EPO. Second, we do not find that examiner citations have a different
pattern of national localization at the EPO and find that those examiner citations (called X and
Y citations) that are more at risk of invalidating a patent have a shorter median lag. Finally,
References
Akers, N. (2000), The Referencing of Prior Art Documents in European Patents and
Applica-tions, World Patent Information 22, 309-315.
Alc`acer, J. and Gittelman, M. (2006), Patent Citations as a Measure of Knowledge Flows: the
Influence of Examiner Citations, Review of Economics and Statistics 88, 774-779.
Bacchiocchi, E. and Montobbio, F. (2009), Knowledge Diffusion from University and Public
Research. A Comparison of US, Japan and Europe using Patent Citations, Journal of
Technology Transfer 34, 169-181.
Bottazzi, L. and Peri, G. (2003), Innovation and Spillovers in Regions: Evidence from
Euro-pean Patent Data, EuroEuro-pean Economic Review 47, 687-710.
Branstetter, L. (2006), Is Foreign Direct Investment a Channel of Knowledge Spillovers?
Ev-idence from Japan’s FDI in the United States, Journal of International Economics 68,
325-344.
Breschi, S. and Lissoni, F. (2004), Knowledge Networks from Patent Data: Methodological
Issues and Research Targets, in H.F. Moed, W. Gl¨anzel, U. Schmoch (eds.), Handbook
of Quantitative Science and Technology Research. The Use of Publication and Patent
Statistics in Studies of S&T Systems, Springer, Berlin.
Breschi, S. and Lissoni F. (2009), Mobility of Skilled Workers and Co-invention Networks: An
Anatomy of Localized Knowledge Flows, Journal of Economic Geography 9 (4), 439-468.
Breschi, S., Lissoni, F. and Montobbio, F. (2005), The Geography of Knowledge Spillovers:
Conceptual Issues and Measurement Problems, in S. Breschi and F. Malerba (eds.),
Clus-ters, Networks and Innovation, Oxford University Press, Oxford.
Breschi, S., Malerba, F. and Orsenigo, L. (2000), Technological Regimes and Schumpeterian
Caballero, J.R. and Jaffe, A.B. (1993), How High Are the Giants’ Shoulders: An Empirical
Assessment of Knowledge and Creative Destruction in a Model of Economic Growth, in O.
Blanchard and S. Fisher (eds.) National Bureau of Economic Research Macroeconomics
Annual 8, MIT Press.
Criscuolo, P. and Verspagen, B. (2008); Does it Matter where Patent Citations come from?
Inventor vs. Examiner Citations in European Patents. Research Policy 37, 1892-1908.
Duguet, E. and MacGarvie, M. (2005), How well do Patent Citations Measure Flows of
Tech-nology? Evidence from French Innovation Surveys. Economics of Innovation and New
Technology 14, 375-393.
EPO (2005), Guidelines For Examination In The European Patent Office.
http://www.european-patent-office.org/legal/gui lines/
Griliches, Z. (1990), Patent Statistics as Economic Indicators: A Survey, Journal of Economic
Literature 28, 1661-1707.
Griffith, R., Redding, S. and Van Reenen, J. (2003), R&D and Absorptive Capacity: Theory
and Empirical Evidence, Scandinavian Journal of Economics 105, 99-118.
Griffith, R., Redding, S. and Van Reenen, J. (2004), Mapping the Two Faces of R&D:
Pro-ductivity Growth in a Panel of OECD Industries, Review of Economics and Statistics 86,
883-895.
Grossman, G. and Helpman, E. (1991), Innovation and Growth in the Global Economy, MIT
Press, Cambridge, MA.
Hall, B.H., Jaffe, A.B. and Trajtenberg, M. (2005), Market Value and Patent Citations, Rand
Journal of Economics 36 (1), 16-38.
Hall, B.H., Jaffe, A.B. and Trajtenberg, M. (2001), The NBER Patent Citation Data File:
Lessons, Insights and Methodological Tools. NBER Working Paper 8498.
Harhoff, D., Hoisl, K. and Webb, C (2007), European Patent Citations -How to Count and
Harhoff, D., Narin, F., Scherer, F.M. and Vopel, K. (1999), Citation Frequency and the Value
of Patented Inventions, The Review of Economics and Statistics 81, 511 - 515.
Henderson, R., Jaffe, A. and Trajtenberg, M. (2005), Patent Citations and the Geography
of Knowledge Spillovers: A Reassessment: Comment. American Economic Review 95,
461-64.
Jaffe, A.B., Trajtenberg, M. and Henderson, R. (1993), Geographic Localization of Knowledge
Spillovers as Evidenced by Patent Citations, Quarterly Journal of Economics 108,
577-598.
Jaffe, A.B. and Trajtenberg, M. (1996), Flow of Knowledge from Universities and Federal
Laboratories: Modelling the Flow of Patent Citations over Time and across Institutional
and Geographic Boundaries. Proceedings of the National Academy of Sciences 93,
12671-12677.
Jaffe, A.B. and Trajtenberg, M. (1999), International Knowledge Flows: Evidence from Patent
Citations, Economics of Innovation and New Technology 8, 105-136.
Jaffe, A.B. and Trajtenberg, M. (2002), Patents, Citations and Innovations: A Window on
the Knowledge Economy, MIT Press.
Jaffe, A.B., Trajtenberg, M. and Fogarty, M.S. (2000), Knowledge Spillovers and Patent
Cita-tions: Evidence from a Survey of Inventors, The American Economic Review 90, 215-218.
Lanjouw, J.O. and Schankerman, M. (2004), Patent Quality and Research Productivity:
Mea-suring Innovation with Multiple Indicators, The Economic Journal 114, 441-465.
Malerba, F., Mancusi, M. and Montobbio, F. (2007), Innovation, International R&D Spillovers
and the Sectoral Heterogeneity of Knowledge Flows, Working Paper CESPRI, no. 206.
Malerba, F. and Montobbio, F. (2003), Exploring Factors Affecting International Technological
Specialization: the Role of Knowledge Flows and the Structure of Innovative Activity,
Maurseth, P.B. and Verspagen, B. (2002), Knowledge Spillovers in Europe: A Patent Citations
Analysis, Scandinavian Journal of Economics 104, 531-45.
Michel, J. and Bettels, B. (2001), Patent Citation Analysis: A Closer Look at the Basic Input
Data from Patent Search Reports, Scientometrics 51, 185-201.
OECD (1994), Using Patent Data as Science and Technology Indicators - Patent Manual,
OECD, Paris.
Peri, G. (2005). Determinants of Knowledge Flows and Their Effect on Innovation, The Review
of Economics and Statistics 87, 308-322.
Piga, C. and Vivarelli, M. (2004), Internal and External R&D: A Sample Selection Approach,
Oxford Bulletin of Economics and Statistics 66, 457-482.
Rivera-Batiz, L. A. and Romer, P.M. (1991), Economic Integration and Endogenous Growth,
Quarterly Journal of Economics 106, 531-555.
Sampat, B. (2005), Determinants of Patent Quality: An Empirical Analysis, Mimeo.
Thompson, P. and Fox Kean, M. (2005), Patent Citations and the Geography of Knowledge
Spillovers: A Reassessment, American Economic Review 95, 450-460.
Trajtenberg, M. (1990), A Penny for Your Quotes: Patent Citations and the Value of
Innova-tions. The RAND Journal of Economics 21, 172-187.
Verspagen, B. (1997), Estimating International Technology Spillovers Using Technology Flow
Matrices, Weltwirtschaftliches Archiv 133, 226-248.
Appendix A: The data
In both datasets Countries are defined on the basis of the address of the first inventor in
the patent application. We have used five countries: Germany, France, the UK, Japan and the
USA.
The Technological Fields used are the US NBER categories as in Hall et al. (2001) that
classes based on Annex III-A of OECD (1994). This classification aggregates all (primary) IPC
codes (version 7 used at the EPO) into 30 technological classes. A concordance table has been
created by the authors that re-aggregates the 30 classes into the USPTO fields.
The USPTO fields used are: 1. Chemical; 2. Computers & Communications; 3. Drugs &
Medical; 4. Electrical & Electronic; 5. Mechanical; 6. Others. Below we report the 30 classes
and, in parentheses, the USPTO field that has been assigned to each class by the authors:
1. Electrical engineering (4); 2. Audiovisual technology (4); 3. Telecommunications (2); 4.
Information Technology (2); 5. Semiconductors (4); 6. Optics (5); 7. Control Technology (5);
8. Medical Technology (5); 9. Organic Chemistry (1); 10. Polymers (1); 11. Pharmaceuticals
(3); 12. Biotechnology (3); 13. Materials (1); 14. Food Chemistry (1); 15. Basic Materials
Chemistry (1); 16. Chemical Engineering (1); 17. Surface Technology (5); 18. Materials
Processing (5); 19. Thermal Processes (6); 20. Environmental Technology (6); 21. Machine
Tools (5); 22. Engines (5); 23. Mechanical Elements (5); 24. Handling (5); 25. Food Processing
(6); 26. Transport (5); 27. Nuclear Engineering (4); 28. Space Technology (5); 29. Consumer
Goods (6); 30. Civil Engineering (6).
Finally we have chosen the closest dates available to the actual timing of invention for both
datasets. These are the priority dates for the EP-CESPRI and the application dates for the
USPTO.
Tables and Figures
Table 1: Distribution by country (in %) of Cited and Citing patents at EPO and USPTO for a set of equivalent patents
Citinga Citeda USPTO EPO Germany 19.0 7.7 16.7 France 8.0 3.0 7.3 UK 6.2 3.1 8.5 Japan 25.2 20.5 27.9 USA 41.6 65.6 39.6
Notes: aIn all tables, for “Cited” and “Citing” we intend “cited patent” and “citing patent”, respectively. We
Table 2: Statistics for technological and geographical composition of EPO and USPTO patent samples
EPO USPTO
Range of cited patents 1978-2002 1978-2002 Range of citing patents 1979-2002 1979-2002 Potential cited patents 1,210,085 2,381,001 Total citations 1,094,301 15,416,292 Citations per potentially citing patent 0.90 6.47
Patents by fields sc - (pc) - cintc sc - (pc) - cintc
Chemicals 25.8 - (19.5) - 1.32 15.2 - (17.2) - 0.88 Computers and Communications 11.3 - (12.3) - 0.92 22.1 - (16.3) - 1.36 Drugs and Medical 14.6 - (11.1) - 1.32 12.6 - (9.8) - 1.29 Electrical and Electronics 12.5 - (12.9) - 0.97 18 - (18.3) - 0.98 Mechanical 29.8 - (34.5) - 0.86 16.7 - (20.2) - 0.83 Others 6.0 - (9.5) - 0.63 15.3 -(18.0) - 0.85
Patents by country sp - (pp) - cintp sp - (pp) - cintp
Germany 18.8 - (25.4) - 0.74 5.4 -(8.5) - 0.64 France 7.5 - (9.6) - 0.78 2.3 - (3.2)- 0.70 United Kingdom 8.6 - (7.5) - 1.14 2.5 - (3.1) - 0.82 Japan 26.6 - (21.9) - 1.21 19.6 -(22.9) - 0.85 United States 38.5 - (35.1) - 1.10 70.2 - (62.1) - 1.13
Notes: sc= cc/c and pc= nc/n, where cc : number of citations by technological field, nc : number of
(potential cited) patents by technological field, c : total number of citations, n : total number of patents,
cintc= sc/pc: index of citation intensity. Similar definitions apply for sp, pp and cintp.
Table 3: Statistics for the regression model
EPO
Mean St. Dev Min Max Number of citations 16.98 35.91 0 947 Potential cited patents 1217.10 1273.74 28 9298 Potential citing patents 12058.75 7843.83 620 30548 Citation Frequency (10ˆ6) 1.44 1.90 0 53.80 Regression weights 3296.80 2207.44 131.76 16853.35
USPTO
Mean St.Dev Min Max Number of citations 281.94 1189.31 0 39873 Potential cited patents 2555.01 3404.04 134 23092 Potential citing patents 22758.55 27364.86 2084 96228 Citation Frequency (10ˆ6) 3.90 3.56 0 81.50 Regression weights 5411.62 5610.57 528.45 47139.12
Table 4: Estimated results: country interaction effects at EPO and USPTO USPTO EPO Citing α coefficients Cited us uk fr ge jp us uk fr ge jp us 1 0.55 0.38 0.26 0.33 1 0.65 0.41 0.31 0.49 uk 0.55 1.59 0.45 0.33 0.29 0.59 1.48 0.47 0.38 0.38 fr 0.44 0.45 1.46 0.35 0.25 0.37 0.43 0.93 0.33 0.29 ge 0.40 0.46 0.48 1.08 0.35 0.26 0.33 0.29 0.54 0.28 jp 0.40 0.31 0.29 0.30 1.09 0.53 0.44 0.37 0.36 1.52 Modal Lag us 5.78 5.72 5.53 6.00 5.16 2.66 3.05 3.60 3.62 3.05 uk 6.27 4.49 5.19 5.50 4.96 2.98 3.12 3.75 3.66 3.16 fr 6.21 5.99 4.43 5.50 5.15 2.87 3.27 3.48 3.58 3.04 ge 6.16 5.44 4.93 4.54 4.64 3.22 3.43 3.96 3.54 3.11 jp 6.16 5.66 4.98 5.41 4.16 3.02 3.23 3.70 3.57 2.62 Cumulative Probability us 94 50.8 32.6 26.4 24.8 44 37.5 33.1 24.9 28.1 uk 60.8 90.3 34.4 28.1 19.8 32.4 89.8 40.8 31.5 23.8 fr 47.7 45.8 80.6 30.1 18.8 18.9 28.2 69.9 26.3 16.8 ge 42.5 38.5 32.8 62.6 21.1 16.5 23.9 28.7 42.2 16.8 jp 42.6 28.2 20.2 24.5 52.8 30.2 28.3 31.4 28.2 64.7
Notes: The “Modal Lag” is the lag (expressed in years) at which the citation frequency reaches its maximum
value and is approximated by (1/β1). The “Cumulative Probability” is the expected number of citations that
a random patent in the row country will receive from a random patent in the column country. It is the integral
of the citation function from t = 0 to infinity and can be approximated by αβ2/ (β1)2. The cumulative
probabilities are multiplied by 105.
Table 5: Estimated results: sector effects at EPO and USPTO
USPTO EPO
αc β1c M. Lag Cum. Prob. αc β1c M. Lag Cum. Prob.
Drugs and med. 1.58 0.82 7.06 222.5 1.54 1.03 2.60 64.6 Comp. and comm. 2.86 1.20 4.81 186.9 1.23 1.00 2.67 54.2 Electronics 1.55 1.14 5.05 111.1 1.05 1.01 2.63 45.2 Chemicals (base) 1 1 5.78 94.2 1 1 2.66 44.0 Mechanical 1.15 1.10 5.24 89.0 0.75 0.92 2.90 39.1 Others 0.99 0.97 5.97 99.8 0.53 0.86 3.08 31.3
Notes: “M. Lag” and “Cum. Prob.” indicate “Modal Lag” and “Cumulative Probabilities” respectively, and are calculated as indicated in the previous table.