CALCAREOUS NANNOFOSSIL BIOSTRATIGRAPHY AND PALEOCEANOGRAPHY
OF THE TOARCIAN OCEANIC ANOXIC EVENT AT COLLE DI SOGNO
(SOUTHERN ALPS, NORTHERN ITALY)
CRISTINA EMANUELA CASELLATO & ELISABETTA ERBA
Received: February 03, 2015; accepted: June 16, 2015
Key words: Calcareous nannofossils, biostratigraphy, paleoecol-ogy, paleoceanography, Pliensbachian/Toarcian boundary interval, Toarcian Oceanic Anoxic Event.
Abstract. We present calcareous nannofossil biostratigraphy and abundances for the Upper Pliensbachian-Lower Toarcian interval, including the Toarcian Oceanic Anoxic Event (T-OAE), represented bythe Fish Level at Colle di Sogno (N Italy). In addition to biohor-izons identifying NJT 5 and NJT 6 nannofossil zones, the first oc-currences of C. superbus and D. striatus constrain the onset and the end of the T-OAE, respectively. We propose the last occurrence of M. jansae as additional event to approximate the end of the T-OAE at lower latitudes. Quantitative data highlight the ``Schizosphaerella de-cline'' marking the Pliensbachian/Toarcian boundaryand the ``Schizo-sphaerella crisis'' at the onset of the T-OAE as supplementarybiohor-izons. S. punctulata and M. jansae constitute most of the micrite in the interval below the Fish Level, which is marked byan increase in abundance of small coccoliths remaining abundant in the overlying interval, with limited contributions of S. punctulata, while M. jansae disappears.
Principal Component Analysis implemented nannofossil pa-leoecological and paleoenvironmental reconstructions. The latest Pliensbachian was characterized bystable oligotrophic conditions fa-vourable to calcification at low pCO2levels promoting the
prolifera-tion of deep-dwelling and highly-calcified S. punctulata. During the earliest Toarcian an initial pulse of continental run-off introduced ter-rigenous material favouring the intermediate-dweller M. jansae and the low-salinityadapted Calyculus. Higher nutrient concentrations and ocean acidification magnified during the T-OAE, stimulatying meso-trophic low-calcified coccolith-producers and suppressing k-strategist deep- to intermediate-dwellers. After the T-OAE, partial recoveryof calcareous nannoplankton indicates still perturbed conditions. Ecosys-tem modifications anticipated the T-OAE of ~1 million years with species origination and major changes in assemblages.
Introduction
In the last thirtyyears, much attention has been devoted to Jurassic calcareous nannofossils to explore their potential as stratigraphic tool for correlations at regional to global scale. During the EarlyJurassic, the Late Pliensbachian-EarlyToarcian interval was a crucial time for calcareous nannoplankton evolution as a major speciation episode took place and some of the most common Jurassic and Cretaceous genera (Biscutum, Lotharingius, Discorhabdus and Watznaueria) appeared and rapidlyevolved (Bown 1987; Mattioli & Erba 1999; Bown et al. 2004; Erba 2004, 2006) providing a number of biostratigraphic events. The EarlyJurassic world was characterized bynannoplankton paleoprovincialism (Bown 1987, 1992; Baldanza et al. 1995) and, therefore, two different biostratigraphic schemes were proposed: a Boreal biozonation based on Northern Europe sections (UK, Germany, The Netherlands) (Bown 1987; Bown et al. 1988; Bown & Cooper 1998) and a Tethyan biozona-tion based on lower latitude secbiozona-tions (Italy, W Portugal, Central Hungary, SW Germany, S France, Greece) (Mattioli & Erba 1999).
The latest Plienbachian to EarlyToarcian time interval was marked bypaleoclimatic and paleoceano-graphic perturbations, associated to transient and long-lasting C isotope anomalies, including the Toarcian Oceanic Anoxic Event (T-OAE) (Jenkyns 1988, 2003, 2010; Hesselbo et al. 2000).
Dipartimento di Scienze della Terra ``A.Desio'', UniversitaÁ degli Studi di Milano, via Mangiagalli 34, 20133 Milano, Italy. E-mail: [email protected]; [email protected]
The high number of calcareous nannofossil bio-horizons characterizing the Late Pliensbachian-Early Toarcian time interval offers the opportunityto biostra-tigraphicallyconstraint the T-OAE. We investigated calcareous nannofossil assemblages of the Colle di So-gno section (Upper Pliensbachian±Lower Toarcian inter-val), located in the LombardyBasin within the Southern Alps. This section was previouslystudied for lithostra-tigraphy(Gaetani & Poliani 1978) and nannofossil con-tent (Erba 2004). Jenkyns & Clayton (1986) documen-ted low-resolution carbon and oxygen isotopic profiles for the uppermost Pliensbachian-lowermost Toarcian interval, including the T-OAE organic-rich sediments.
The objectives of this studyare: A) nannofossil biostratigraphyfor dating the Colle di Sogno section and making comparisons with available data to assess biohorizon reproducibilityat regional to global scales; B) nannofossil quantitative abundances and statistical analyses for reconstruction of paleoecological affinities and paleoceanographic conditions preceding, during and following the T-OAE perturbation.
Geological Setting and Lithostratigraphy
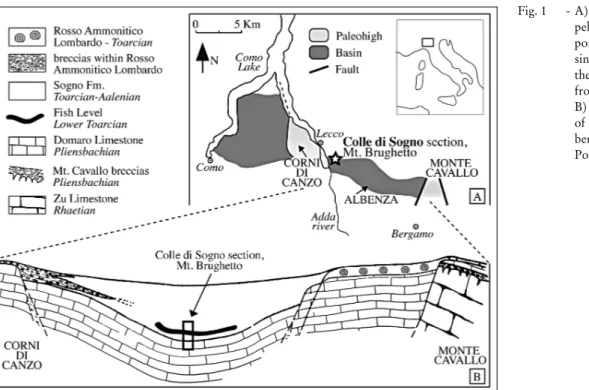
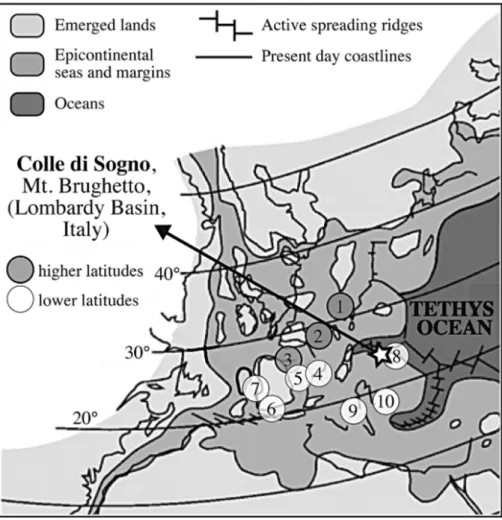
The studied area is situated in the Southern Alps (N Italy) (Fig. 1A) that in the Mesozoic were part of the southern Tethyan passive margin, belonging to an Afri-can promontory, the Adria microplate (Fig. 2). During the latest Triassic-earliest Jurassic time interval this mar-gin experienced an intense rifting that generated a series of structural highs and lows, namelythe LombardyBa-sin, the Trento Plateau, the Belluno Basin and the Friuli Platform. Within the LombardyBasin, this tectonic
phase further differentiated deep basins and pelagic structural highs, bounded bysynsedimentaryfaults that ruled facies distribution (Winterer & Bosellini 1981; Baumgartner et al. 2001). In the deeper parts sedimen-tarysuccessions are thick, continuous and temporarily characterized bya pelagic turbiditic regime, whereas condensed and partiallydiscontinuous sedimentation characterizes the pelagic highs.
This studywas conducted on the Colle di Sogno section located in the depocentre of the Albenza Plateau (Fig. 1B), where a continuous Jurassic sequence is ex-posed (Muttoni et al. 2005). In particular, we focus on the Upper Pliensbachian-Lower Toarcian interval (Fig. 3), previouslycharacterized for lithostratigraphy, bios-tratigraphyand chemostratigraphy(Gaetani & Poliani 1978; Jenkyns & Clayton 1986; Lozar 1995; Mattioli & Erba 1999; Erba 2004), therefore providing an inte-grated stratigraphic framework for calibration of nan-nofossil biohorizons and zones. The ammonites (Dac-tyloceras simplex Fucini and Partschyceras anonymum Haas) from the top of Domaro Limestone (Lmst.) cor-respond to the tenuicostatum ammonite Zone (AZ) (Gaetani & Poliani 1978). A few ammonite specimens (Dactylioceras polymorphum Fucini and Hildaites sp. ind.) found approximatelyone meter above the top of the Fish Level (Gaetani & Poliani 1978) suggest the falciferum AZ as discussed byJenkyns et al. (1985), who interpreted Dactilioceras specimens as reworked.
Low-resolution ä13C data of Jenkyns & Clayton
(1986) document a negative shift at the Domaro Lmst./ Sogno Formation (Fm.) boundary. Such an anomaly was recognized in different stratigraphic settings and dated as Pliensbachian/Toarcian boundaryin recent
pa-Fig. 1 - A) Distribution of basins and pelagic highs in the central portion of the LombardyBa-sin, Southern Alps, during the EarlyJurassic (modified from Mattioli & Erba 1999); B) Depositional environment of the Sogno Fm. in the Al-benza area (from Gaetani & Poliani 1978).
pers (Hesselbo et al. 2007; Suan et al. 2008, 2010), and thus reinforces the age assignment based on ammonites of the topmost layer of the Domaro Lmst. Another negative excursion grosslycorrelates with the Fish Le-vel: this is the widelyrecognized carbon isotope excur-sion associated with the T-OAE, and suggests that the Fish Level is the local sedimentaryexpression of this event.
The studied ~30 m-thick interval, spanning the uppermost part of the Domaro Lmst. and the lower-most part of the Sogno Fm. (Fig. 3) is located along the road SP 179 leading northward from the village of Sogno to Colle di Sogno, on the northern slope of Mt. Brughetto (45ë47'29'' N, 9ë28'44'' E). The Domaro Lmst. consists of light greymarlylimestone and lime-stone in 25-15 cm-thick beds, with greenish marly claystone interbeds, which sometimes reach a thickness up to 5 cm. Rare greycherts nodules and lists, 1-2 cm-thick, are present. The lithostratigraphic boundarywith the Sogno Fm. is sharp and marked bythe occurrence of a 27 cm-thick interval of greenish marlyclaystone. The lower 8.27 m of the Sogno Fm. consists of greenish and reddish marlstone and limymarlstone in 25 to 5 cm-thick beds. A slumped interval is present between 2.90 m and 4.75 m. A carbonate-poor interval named Fish Level, corresponding to the sedimentaryexpression of
the T-OAE, consists of dark greenish-greymarlyclays-tone in the lower portion (8.27-10.73 m) and dark brown marlyclaystone to fissile black shale in the upper part (10.73-12.98 m). The interval above the Fish Level comprises light brownish greymarlstone and limy marlstone organized in 20 to 40 cm-thick strata.
As far as microfacies are concerned, the Domaro Lmst. consist of light brown mudstone-wackestone with pelagic bivalves, radiolarians and echinoderm frag-ments. The lithostratigraphic boundarybetween the Domaro Lmst. and Sogno Fm. is marked byan increase of extraclasts (especiallyquartz and mica). Light brown mudstone passing upward to reddish brown mudstone characterizes the lower portion of the Sogno Fm. Pela-gic bivalves, radiolarians and echinoderm fragments are the dominant bioclasts. Just below the Fish Level base, the microfacies consists of light brown wackestone with abundant isoriented pelagic bivalves. Mudstone with high organic matter, clayand dark mineral contents are observed through the Fish Level. Two portions are distinguished on the basis of micrite color and allochem content: the lower part corresponds to dark reddish brown micrite, while the upper part consists of very dark brown micrite with relativelyfrequent radiolar-ians, echinoderm fragments and dark minerals. Above
Fig. 2 - Paleogeographyof the Early Toarcian (modified from Bassoullet et al. 1993). Num-bers represent the paleoposi-tions of the stratigraphic sec-tions cited in Figs 6, 7 and Tab. 1.
1) Dotternhausen - Ger-many; 2) Sancerre-Couy drill-core - N France; 3) West Rodiles, Camino, San AndreÂs, Castillo De Pedroso -N Spain; 4) Quercy- SW France; 5) Rambla del Salto; La Almunia - E Spain; 6) La Cerradura - S Spain; 7) Raba-cal, Peniche - Portugal; 8) Colle di Sogno, Caricatore, Val Varea - N Italy; 9) Poz-zale, Colle D'Orlando, Fonte Cerro, Valdorbia, Mt. Serrone, Mt. Civitella, Somma -Central Italy; 10) Anabrisa-da, Kaballos, Kalamisti, Toka - NW Greece. Sections at higher paleolatitudes (1-3) are distinguished from sec-tions at lower paleolatitudes (4-10).
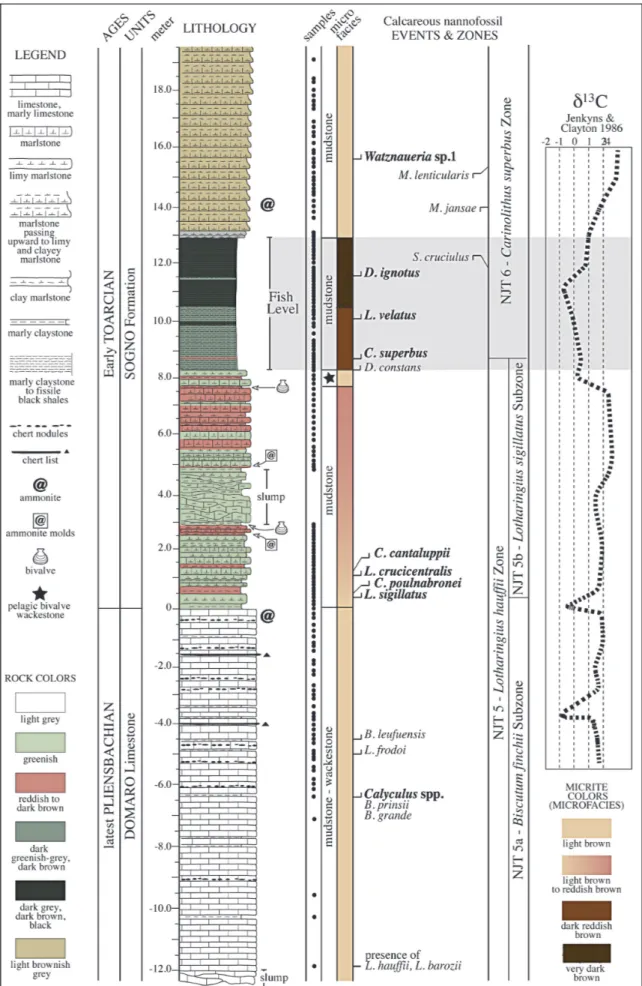
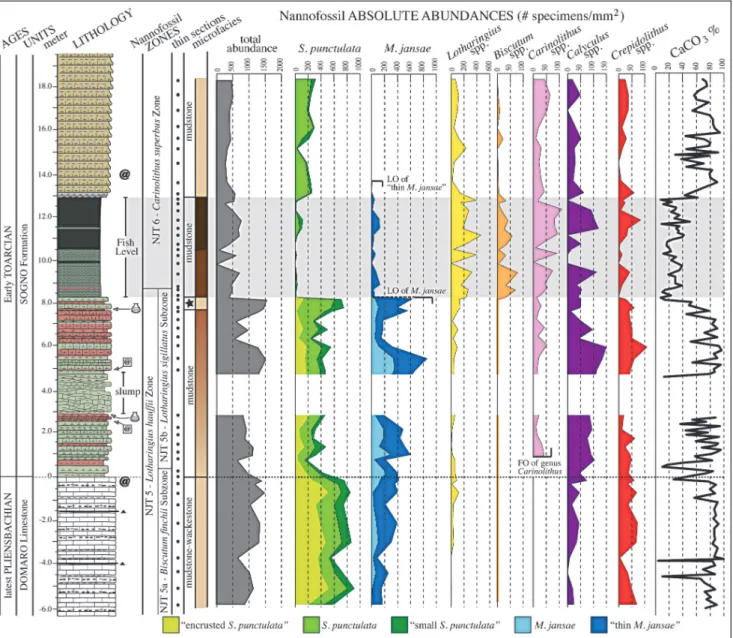
Fig. 3 - Lithostratigraphyand calcareous nannofossil biostratigraphyof the Colle di Sogno section. The main events of Mattioli & Erba (1999) are in bold. @ = ammonite findings after Gaetani & Poliani (1978) are discussed in the text. The C isotope curve is after Jenkyns & Clayton (1986). Microfacies were defined according to Dunham (1962) classification, employing the tables of Baccelle & Bosellini (1965) for percentage estimation of allochems.
the Fish Level mudstone consists of light brown micrite with an allochemical content decreasing upwards.
Materials & Methods
Calcareous nannofossil biostratigraphywas performed on a to-tal of 163 samples (Fig. 3). Average sampling rate is ~20 cm through the section, with exceptions of the lowermost 6 m, having much wider sample spacing, and the interval across the Domaro Lmst./Sogno Fm. boundaryand the Fish Level both sampled every10 cm. Samples were prepared from marlylimestones and limestones of the Domaro Lmst. and marlstones, limymarlstones, marlyclaystones and black shales of the Sogno Fm.
Biostratigraphic analyses were performed on smear slides pre-pared as follows: a small amount of rock material was powdered adding few drops of bi-distillate water, without centrifuging, ultrasonic clean-ing or settlclean-ing the sediment in order to retain the original composition. The obtained suspension was mounted onto a slide, covered with a cover slide and fixed with Norland Optical Adhesive. Smear slides were investigated using a light polarizing microscope, at 1250X magnifica-tion. Calcareous nannofossil preservation and semi-quantitative abun-dances were evaluated byexamining at least 400 fields of view in each smear slide. The biostratigraphic scheme adopted is that of Mattioli & Erba (1999). Calcareous nannofossil taxa recognized are listed in Ap-pendix 1. The range chart is reported in ApAp-pendix 2.
Calcareous nannofossil quantitative analyses were performed on 49 samples, selected every60-80 cm, with exception of the Fish Level analyzed every 40 cm. Absolute abundances were obtained counting all specimens in 1 mm2 of ultrathin sections (7 mm thick),
following the methodologyof Erba & Tremolada (2004). For quanti-tative analyses calcareous nannofossil taxa were counted at the generic level, because the use of ultrathin section partlyconstrain the identifi-cation at specific level. While this type of investigation is ideal for large-sized and highlycalcified taxa (e.g. Mitrolithus, Schizosphaerella), that result to be unequivocallydetectable and quantifiable, small and med-ium size coccoliths (e.g. Biscutum, Lotharingius) are often covered. Moreover, the delicate structure of smaller coccoliths is frequentlyin-complete due to slicing and thinning of ultrathin sections.
Within genus Biscutum, B. finchii is the dominant species while B. novum, B. dubium and B. grande are rare to absent in a few samples. Lotharingius hauffii is dominating the Lotharingius spp. group, while other species (L. barozii, L. crucicentralis, L. frodoi, L. sigillatus, L. umbriensis, L. velatus) are rare. Concerning Carinolithus spp., C. poul-nabronei and C. superbus are equallyabundant, while C. cantaluppii gives a verylittle or no contribution. Crepidolithus crassus largelydom-inates the genus Crepidolithus since C. cavus and C. granulatus are sparse. Counting and statistical treatment at generic level were pre-viouslyadopted byBour et al. (2007). Also, some datasets of individual species abundances were grouped at generic level for statistical analyses to overcome verylow percentages (Tremolada et al. 2006; Aguado et al. 2008; Mattioli et al. 2008; Fraguas et al. 2012; CleÂmence et al. 2015).
Principal component analysis (PCA) was performed on calcar-eous nannofossil abundances with the free statistical software Past v1.94b (Hammer et al. 2001). The method to extract factors was eigen-values. The PCA method facilitates interpretations of complex data sets, reducing large data matrix composed of several variables to a small number of factors representing the main modes of variations (Fukunaga 1990; Beaufort & Heussner 2001). As Schizosphaerella punctulata is considered a dinoflagellate cyst (KaÈlin & Bernoulli 1984), two datasets were used including and excluding this taxon. For both datasets, absolute abundances and percentages (the latter calculated from the total absolute abundances) of all taxa were introduced in the analysis. Furthermore, PCA was performed on both the entire studied interval, and on the interval bounded bythe first occurrence (FO) of genus Carinolithus
and the last occurrence (LO) of Mitrolithus jansae in order to consider the real absence or presence within the stratigraphic range of taxa.
Carbonate content analyses were performed on a total of 156 samples. Bulk rock samples were reduced to fine powder in agate mor-tar. Carbonate content was obtained using a Dietrich±FruÈhling calci-meter, measuring the CO2volume produced bythe complete
dissolu-tion of pre-weighted samples in 37% vol. HCl. Standards of pure calcium carbonate were measured everyfive samples to ensure proper calibration.
Microfacies were analyzed on the same 49 thin sections used to achieve calcareous nannofossil absolute abundaces (Fig. 3).
Taxonomic notes
In this paragraph, remarks concerning morpholo-gical and/or dimensional features of a few taxa (B. fin-chii, C. crassus, M. jansae, and S. punctulata) observed under the light polarizing microscope are reported, al-phabeticallyordered per genus. Furthermore the de-scriptions of Rucinolithus sp. and Watznaueria sp. 1 are reported.
Genus Biscutum Black in Black & Barnes, 1959
Biscutum finchii(Crux, 1984) Bown, 1987
Remarks. In the studied section rare to frequent specimens of B. finchii with dimensions smaller than the holotype (5.6 mm length - 4.7 mm width) were observed. The specimens with length < 5.5 mm are here reported as ``small B. finchii '' (Pl. 1, figs. 6-7), while specimens with length = 5.5 mm are reported as B. finchii (Pl. 1, figs 8-9) (Appendix 2). The ``small B. finchii'' specimens are char-acterized bya subcircular outline and prominent distal shield. Theypartiallycorrespond to the morphotypes named as B. aff. B. finchii byCobianchi (1990, 1992) and as ``small B. finchii'' byPicotti & Cobianchi (1996), who separated specimens with length < 6 mm.
Stratigraphic observations. ``Small B. finchii'' is present from the lowermost studied sample, below the FO of B. finchii. Similarly, Cobianchi (1992) and Picotti & Cobianchi (1996) documented ``small B. finchii'' in the interval preceding the FO of B. finchii, before the FO of L. hauffii. In the studied section, B. finchii is observed from the uppermost part of the NTJ 5a Sub-zone, between the FOs of genus Calyculus and L. sigil-latus, at a similar stratigraphic level to that reported by Cobianchi (1992).
Genus Crepidolithus NoeÈl, 1965
Crepidolithus crassus(Deflandre in Deflandre
& Fert, 1954) NoeÈl, 1965
Remarks. The holotype of Discolithus crassus has dimensions of 8.2 mm length and 5.5 mm width. Later,
NoeÈl (1965) moved this species in the Crepidolithus genus, and pointed out the co-occurrence of specimens with smaller dimensions (3.7-4.4 mm length and 2.3-3.2 mm width). Bown (1987) reported specimens with size ranges of 5.0-9.0 mm for length and 3.5-5.5 mm for width. In this study, specimens displaying length = 5 mm and width = 3.5 mm are attributed to C. crassus (Pl. 1, figs 18-19), while specimens with length < 5 mm and width < 3.5 mm are reported as ``small C. crassus'' (Pl. 1, fig. 20) (Appendix 2).
Stratigraphic observations. ``Small C. crassus'' and C. crassus co-occur through the studied interval, although the small one presents a discontinuous occur-rence and is rarer than the latter.
Genus Mitrolithus Deflandre, 1954 in Deflandre & Fert, 1954
Mitrolithus jansae(Wiegand, 1984) Bown in Young
et al., 1986
Remarks. This species was described as Calci-vascularis jansae byWiengand (1984), a nannolith of 2.4-5.6 mm length (height) and 3.2-5.6 mm maximum width (holotype: 2.3 mm length ± 3.5 mm maximum width). Later, Bown (in Young et al. 1986) moved this species in the Mitrolithus genus, pointing out a consid-erable variation in dimensions and reporting a compre-hensive size of 4-8 mm, without specifylength or width. Bown (1987) also remarked a great size varia-tion, describing ranges of 3.0-4.6 mm for maximum width, and 2.3-5.3 mm for rim height. Later Bown & Cooper (1989) specified a height variabilityof 2.3-5.6 mm. A notable variation of murolith height was re-ported byprevious Authors (plate 1, Mailliot et al. 2006; plate 1, fig. 5, Fraguas et al. 2008; fig. 5a-c, Bodin et al. 2010; plate 1, figs 9-12, Reggiani et al. 2010b; figs 56-60, Sandoval et al. 2012). Specimens observed in the studied samples show height variabilityfrom 3 to 8 mm. Moreover, we noticed that the thickness of outer elements of the murolith varies from 0.5 to 2 mm. Spe-cimens characterized byverythin outer elements (<1 mm) and displaying grey to whitish colours under crossed nicols are distinguished here as ``thin M. jansae'' (Pl. 1, figs 26-27), while specimens with thicker outer elements, displaying bright white to yellow colours, are attributed to M. jansae (Pl. 1, fig. 28) (Appendix 2). The structure of the central spine is identical in both mor-photypes.
Stratigraphic observations. Specimens of M. jansae and ``thin M. jansae'' co-occur in the Domaro Lmst. and in the lower portion of the Sogno Fm. below the Fish Level. ``Thin M. jansae'' is the onlymor-phogroup present through the Fish Level where no reg-ular M. jansae specimens were observed. ``Thin M.
jan-sae'' disappears one meter above the top of the black shale interval.
In the studied section, the rim height variability has no stratigraphic significance: tall and short speci-mens co-occur with comparable abundances through the Domaro Lmst. and the Sogno Fm., displaying simi-lar trends.
Genus Rucinolithus Stover, 1966
Rucinolithussp. ind.
Description. Polycyclolith specimens consisting of 7-9 imbricated elements, with radial symmetry, and showing high birefringence colours. The elements are arranged slightlyirregularlyand have a petaloid shape with rounded ends. The outline is sub-circular,
display-PLATE 1 Scale bars represent 2 mm.
Figs. 1-2 - B. dubium, 1) cross-polarized light, 2) quartz lamina, sample 72B (0.8 m).
Figs. 3-4 - B. grande, 3) cross-polarized light, 4) quartz lamina, sample 71A (0.2 m).
Fig. 5 - B. prinsii, cross-polarized, sample 71B (0.3 m). Figs. 6-7 - ``small B. finchii'', 6) cross-polarized light, 7) quartz
lamina, sample 84BB (14.5 m).
Figs. 8-9 - B. finchii, 8) cross-polarized light, 9) quartz lamina, sample CS-L1-78 (4.80 m).
Fig. 10 - B. leufuensis, cross-polarized, sample 73A (1.05 m). 0 Fig. 11-13 - Calyculus sp., side view, cross-polarized light, 11)
sam-ple 84Z (11.45 m),12) samsam-ple 84D (9.45 m), 13) samsam-ple 3A (-0.15 m).
Fig. 14-15 - C. poulnabronei, side view, cross-polarized light, 14) sample 84P (10.75 m), 15 sample 84U (11.25 m). Figs. 16-17 - C. superbus, 16) cross-polarized light, 17) quartz lamina,
sample 84C (9.35 m).
Figs. 18-19 - C. crassus, cross-polarized light, 18) sample 3Q (-3.6 m), 19) sample CS-L1-75 (2.6 m).
Fig. 20 - ``small C. crassus'', cross-polarized light, sample TS 38.00 (-9.6 m).
Fig. 21 - C. cavus, cross-polarized light, sample 71A (0.2 m). Fig. 22 - C. granulatus, cross-polarized light, sample 71A (0.2
m).
Figs. 23-24 - D. constans, 23) cross-polarized, 24) quartz lamina, sam-ple 85B (15.15 m).
Fig. 25 - M. lenticularis, cross-polarized, sample 71A (0.2 m). Figs. 26-27 - ``thin M. jansae'', cross-polarized, 26) sample 73B (1.1
m), 27) sample 3K (-2.3 m).
Fig. 28 - M. jansae, cross-polarized, sample 72D (1.0 m). Figs. 29-30 - D. ignotus, 29) cross-polarized, 30) quartz lamina,
ing a diameter comprised between 6 and 8 mm (Pl. 2, figs 16-17).
Remarks. The observed specimens are verysimi-lar to R. terebrodentarius (Covington & Wise 1987; Tremolada & Erba 2002). Rucinolithus specimens are common in Cretaceous sequences (Stover 1966; Cov-ington & Wise 1987; Erba 1994, 2004; Burnett 1998; Tremolada & Erba 2002) and were recentlydescribed from the Middle Jurassic (Tiraboschi & Erba 2010). This is the first time that Rucinolithus is reported from the Lower Jurassic. Specimens observed in this study generallybelong to the ``small Rucinolithus'' category of Tiraboschi & Erba (2010, fig. 6 pictures 1-8).
Stratigraphic observations. These nannoliths were observed in the lower part of the studied section up to the base of the Fish Level. Theyare rare within the NJT 5a Subzone and become extremelyrare in the NJT 5b Subzone.
Genus Schizosphaerella Deflandre & Dangeard, 1938
Schizosphaerella punctulata
Deflandre & Dangeard, 1938
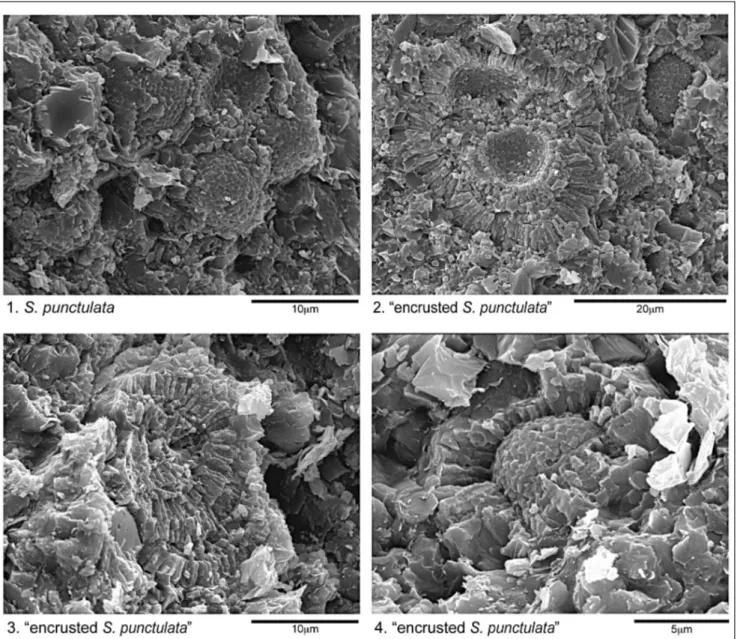
Remarks. This species was described as a nanno-lith composed bytwo interlocked valves with a dia-meter of 12-30 mm (Deflandre & Dangeard 1938). Later, other Authors pointed out specimens with smaller di-mensions: Bown (1987) and Cobianchi (1992) reported a diameter of 8-12 mm, while Mattioli & Pittet (2002) gave a range of 7-13.5 mm. In the studied section speci-mens displaying dispeci-mensions of 4-7 mm are separated as ``small S. punctulata'' (Pl. 2, figs 15, 20) while specimens with diameter = 7 mm are reported as S. punctulata (Pl. 2, figs 21-22; Fig. 4A) (Appendix 2). Additionally, speci-mens surrounded byfringing crust of radiating pris-matic crystals were also observed, and grouped as ``en-crusted S. punctulata'' (Pl. 2, figs 23-25; Fig. 4B-C-D) (Appendix 2). The thickness of fringes varies from 2 to 5 mm. It is to be pointed out that crusts affect onlyspeci-mens with a diameter > 7 mm.
Stratigraphic observations. ``Small S. punctula-ta'' and S. punctulata occur together through the studied interval, both showing a drastic decrease in abundance within the Fish Level. ``Small S. punctulata'' is less abun-dant above the black shale interval. ``Encrusted S. punc-tulata'' is present in the Domaro Lmst. and in the lower part of the Sogno Fm., prior to the base of the Fish Level.
Discussion. KaÈlin (1980) described specimens of S. punctulata with fringes of radial crystals in samples from the Southern Alps, Tuscanyand Umbrian se-quences (KaÈlin 1980, fig. 14), and demonstrated their earlydiagenetic origin, with formation of neomorphic calcite, possiblycontrolled bya low Mg/Ca ratio of
oceanic waters (KaÈlin & Bernoulli 1984). Although a diagenetic origin of such crusts is not questioned, we point out that diagenetic processes should affect all S. punctulata specimens with a diameter > 7 mm, therefore it is difficult to explain whyencrusted morphotype oc-cur together with non-encrusted ones of similar dimen-sions.
Genus Watznaueria Reinhardt, 1964
Watznaueriasp. 1 Cobianchi et al., 1992
Remarks. Watznaueria coccoliths 3-5 mm length and 2-4 mm width with a small open central area. At crossed nicols theyshow white birefringence colours (Pl. 2, figs 18-19).
Discussion. Comparable specimens were re-ported as W. aperta byErba & Cobianchi (1989). Co-bianchi et al. (1992) and Gardin & Manivit (1994) de-scribed analogous coccoliths as Watznaueria sp. 1, whereas Reale et al. (1992) and Baldanza & Mattioli (1992) reported similar specimens as W. barnesiae. Mat-tioli (1996) revised the latter attribution, ascribing the specimens to Watznaueria sp. 1. Mattioli & Erba (1999)
PLATE 2 Scale bars represent 2
Figs. 1-2 - L. hauffii, 1) cross-polarized, 2) quartz lamina, sample 5C (-5.0 m).
Figs. 3-4 - L. frodoi, 3) cross-polarized, 4) quartz lamina, sample 83A (8.3 m).
Fig. 5, 10 - L. umbriensis, cross-polarized, 5) sample 3B (-0.5 m), 10) sample 3B (-0.5 m).
Figs. 6-7 - L. barozii, 6) cross-polarized, 7) quartz lamina, sample 71D (0.5 m).
Figs. 8-9 - L. sigillatus, 8) cross-polarized, 9) quartz lamina, sample 84R (10.95 m).
Figs. 11-12- L. crucicentralis, 11) cross-polarized, 12) quartz lamina, sample 73A (1.05 m).
Figs. 13-14- L. velatus, 13) cross-polarized, 14) quartz lamina, sample 84BB (14.5 m).
Fig. 15, 20 - ``small S. punctulata'', cross-polarized, 15) sample 74F (2.4 m), 20) sample 74F (2.4 m).
Figs. 16-17- Rucinolithus sp. ind., 16) cross-polarized, 17) quartz la-mina, sample 5E (-5.45 m).
Figs. 18-19- Watznaueria sp.1, 18) cross-polarized, 19) quartz lamina, sample CS-L1-87 (15.75 m).
Figs. 21-22- S. punctulata, 21) cross-polarized, 22) quartz lamina, sample 3C (-0.7 m).
Fig. 23-25 - ``encrusted S. punctulata'', cross-polarized, 23) sample TS 33.80 (-5.12 m), 24) sample 5G (-5.85 m), 25) quartz lamina, sample 5G (-5.85 m).
used the name W. fossacincta for Watznueria coccoliths with a small open central area (fig. 10, Mattioli & Erba 1999).
The specimens observed in this studyhave shield dimensions (both length and width) smaller than W. fossacincta, and displaya proportionallysmaller central opening than W. fossacincta. Therefore, we maintain the name Watznaueria sp. 1 in analogywith Cobianchi et al. (1992) and Mattioli (1996).
Stratigraphic observations. The FO of Watz-naueria sp. 1 is the youngest biohorizon detected in the studied section (above the Fish Level) and, as re-ported byprevious Authors (Cobianchi et al. 1992; Mattioli 1996), marks the appearance of genus Watz-naueria in the EarlyToarcian.
Results
Calcareous nannofossil preservation and abun-dance varythrough the studied section, generallyin-creasing from the Domaro Lmst. to the Sogno Fm. Nannofossil preservation seems to be lithology-depen-dent, improving from limestone to marlstone. Nanno-fossils from the Domaro Lmst. displaya preservation ranging from poor to moderate and a total abundance varying from rare to frequent/common. The marly lithologies of the Sogno Fm. show a slightlybetter nan-nofossil preservation (from poor/moderate to moder-ate) and abundance (frequent/common). In the Fish Le-vel and in the overlying interval abundances fluctuate from rare to common, while preservation is still poor/ moderate to moderate. Although the preservation of
Fig. 4 - 1) S. punctulata, sample 79A, 5.65 m; 2) ``Encrusted S. punctulata'', sample 3L, -2.55 m; 3) ``Encrusted S. punctulata'', sample 3D, -0.9 m; 4) ``Encrusted S. punctulata'', sample 79A, 5.65 m. Pictures were taken with the Stereoscan Cambridge 360 scanning electron microscope. Scale bars are quoted on each picture.
calcareous nannofossils ranges from poor to moderate, primarysignals are present. In fact, the continuous oc-currence of small and delicate taxa, prone to dissolution such as Biscutum and delicate species of genus Lotha-ringius (L. barozii, L. velatus) ensures that diagenesis has not been pervasive. Moreover, these dissolution-prone taxa increase in abundance when robust and dis-solution-resistant genera (e.g. Schizosphaerella and Mi-trolithus) show a major decrease that, thus, cannot be ascribed to diagenesis.
Biostratigraphy
The biostratigraphic scheme adopted in this study is that of Mattioli & Erba (1999). Seventeen calcareous nannofossil biohorizons were recognized (Fig. 3), in-cluding 9 main and 3 rare biohorizons. Based on the main ones we identified the Lotharingius hauffii Zone (NJT 5), divided into Biscutum finchii (NJT 5a) and Lotharingius sigillatus (NJT 5b) Subzones, and the Ca-rinolithus superbus (NJT 6) Zone (Mattioli & Erba 1999). The oldest investigated sample is assigned to the latest Pliensbachian NJT 5a nannofossil Subzone, based on the presence of L. hauffii and L. barozii in the low-ermost sample (-11.97 m). Within the NJT 5a Subzone few biohorizons were identified: the FOs of Calyculus, B. grande and Bussonius prinsii (-6.4 m), followed by the FOs of L. frodoi (-5.0 m) and Bussonius leufuensis (-4.55 m). The FO of L. sigillatus (0.4 m) defines the NJT 5a/NJT 5b subzonal boundary: this biohorizon approximates in the Tethyan area the Pliensbachian/ Toarcian boundary(Mattioli & Erba 1999), that at Colle di Sogno corresponds to the Domaro Lmst./Sogno Fm. lithostratigraphic boundary(Gaetani & Poliani 1978). In the EarlyToarcian NJT 5b Subzone, the following biohorizons were detected: FOs of C. poulnabronei (0.5 m), L. crucicentralis (1.05 m) and C. cantaluppii (1.2 m). Near the NJT 5b top, the FO of Diductius constans was observed (8.3 m). The FO of C. superbus (8.75 m) de-fines NJT 5/NJT 6 zonal boundary. The top of NJT 6 Zone was not detected due to the absence of Discorhab-dus striatus in the studied interval. In the NJT 6 Zone, the FOs of L. velatus (10.1 m) and Discorhabdus ignotus (11.55 m), followed bythe LOs of Similiscutum cruciu-lus (11.65 m), M. jansae (14.05 m) and Mitrolithus len-ticularis (15.3 m) were recognized. The youngest bio-horizon detected is the appearance of genus Watznauer-ia, with the FO of Watznaueria sp.1 (15.6 m).
The calcareous nannofossil assemblage character-izing the NJT 5a Subzone is dominated by S. punctulata and M. jansae (both frequent to common) and L. hauffii (rare/frequent to frequent/common), while genera Cre-pidolithus, Biscutum and Calyculus are rare. Within Schizosphaerella, S. punctulata is dominant (rare/fre-quent to fre(rare/fre-quent/common), while ``small S. punctulata'' and ``encrusted S. punctulata'' are subordinated (rare to
rare/frequent). Within the M. jansae group, ``thin M. jansae'' is dominating (rare/frequent to common), while M. jansae is subordinated (rare to rare/frequent).
Assemblage of the NJT 5b Subzone is dominated by L. hauffii (frequent to common), S. punctulata and M. jansae (rare/frequent to frequent/common). Among schizosphaerellids, S. punctulata is the dominant form, showing an increase in abundance upwards: in the Sog-no Fm. portion below the slumped interval, it is rare to frequent, and becomes frequent to frequent/common between the slumped interval and the Fish Level. ``Small S. punctulata`` is rare to frequent, decreasing upwards. ``Encrusted S. punctulata'' is rare and observed only below the Fish Level. Within the NJT 5b Subzone ``thin M. jansae'' is more abundant (rare/frequent to common) than M. jansae (rare to frequent/common); the latter is observed onlybelow the Fish Level. Genera Carino-lithus and Biscutum are rare/frequent to frequent, while genera Calyculus and Crepidolithus are rare. Through the NJT 5 Zone, extremelyrare specimens of Rucino-lithus sp. were observed.
The taxa dominating the assemblage of NJT 6 Zone belong to the genus Lotharingius (L. hauffii fre-quent/common to common/abundant; L. frodoi and L. sigillatus frequent; L. velatus, L. crucicentralis and L. umbriensis rare to frequent). The assemblage of the low-er part of NJT 6 Zone (corresponding to the Fish Level) is also characterized bygenera Biscutum, Calyculus and Carinolithus, which are frequent, while genera Schizo-sphaerella, Mithrolithus and Crepidolithus are veryrare. The assemblage of the uppermost part of NJT 6 Zone (above the Fish Level) is characterized byrare to fre-quent S. punctulata (both S. punctulata and ``small S. punctulata''), Biscutum and Carinolithus.
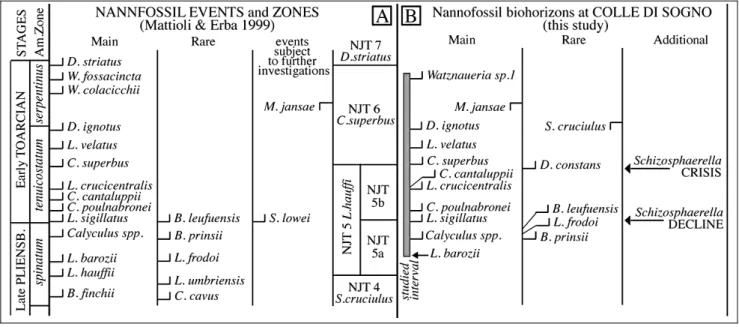
Comparison with previous works
The biohorizons recognized at Colle di Sogno (Fig. 5B) are compared to the events of Mattioli & Erba (1999) to discuss analogies and/or differences. In the latest Pliensbachian-EarlyToarcian interval (spinatum-serpentinus Ammonite Zones - AZs) Mattioli & Erba (1999) identified twenty-one calcareous nannofossil events (i.e. fourteen main events, five rare and two sub-jected to further investigations) and defined four zones (Fig. 5A). In the studied section all biohorizons of Mat-tioli & Erba (1999) were recognized with the exception of FOs of Similiscutum lowei and Watznaueria colacic-chii. The succession of main and rare biohorizons of latest Pliensbachian age at Colle di Sogno shows minor differences with Mattioli & Erba (1999). In fact, the FO of C. cantaluppii is detected slightlyafter the FO of L. crucicentralis, most probablydue to the rarityof C. cantaluppii in the studied material. At Colle di Sogno, the FO of L. frodoi is observed after the FO of genus Calyculus, possiblybecause this species is rare in its
lower range. Our results confirm the LO of M. jansae (thin specimens) between the FOs of D. ignotus and Watznaueria sp. 1 (W. fossacincta of Mattioli & Erba 1999), thus this biohorizon appears to be reliable and that it can be considered a main one, at least for low-latitude Tethyan sites. The FO of D. constans, an event not reported byMattioli & Erba (1999), was detected below the FO of C. superbus, within the NJT 5b Sub-zone at Colle di Sogno. Gardin & Manivit (1994) re-ported this biohorizon from the EarlyToarcian, below the FO of Watznaueria sp. 1; De Kaenel et al. (1996) reported it above the FO of C. superbus, while Bown & Cooper (1998) onlyreported a questionable appearance datum from the earliest Toarcian tenuicostatum AZ. Re-cently, the lowest occurrence of D. constans was re-ported from Southern Spain and Germany, below the FO of C. superbus (Mattioli et al. 2004; Sandoval et al. 2012). Our result supports the consistencyof the FO of D. constans and we put this biohorizon in the group of the rare ones (Fig. 5B). The LO of S. cruciulus is ob-served in the NJT 6 Zone, within the Fish Level. It is bracketed between the FO of D. ignotus and the LO of M. jansae. Mattioli & Erba (1999) considered this event among the ones subject to further investigations and suggested a LO in latest Aalenian. However, in their literature overview, the LO of S. cruciulus is reported in the EarlyToarcian (De Kaenel & Bergen 1993; Bown & Cooper 1998). Later this biohorizon was attributed to the EarlyToarcian in Greece (Kafousia et al. 2014) and Germany(Mattioli et al. 2004). While Perilli et al. (2004) and Perilli & Duarte (2006) reported this species as discontinuouslypresent until the end of the Toarcian in N Spain and Portugal.
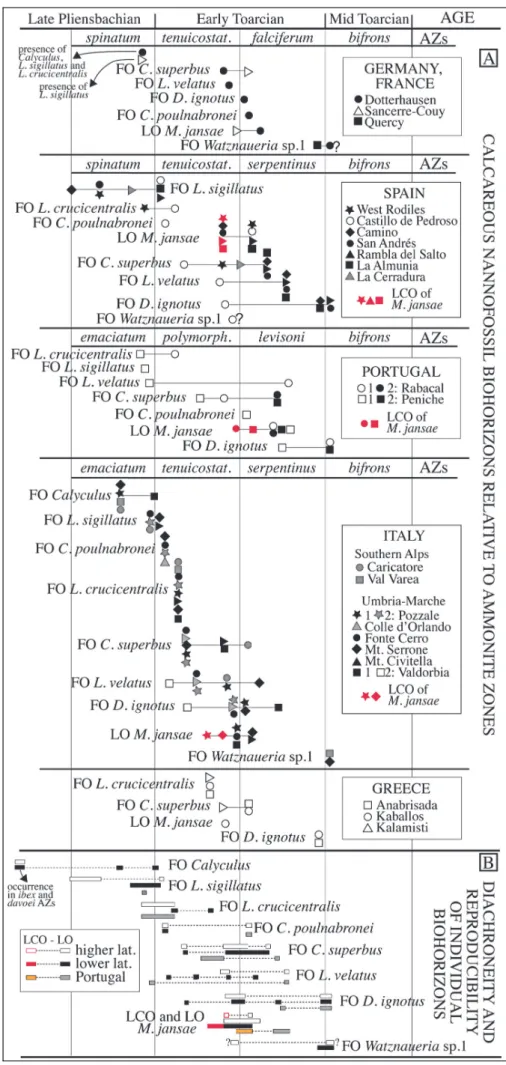
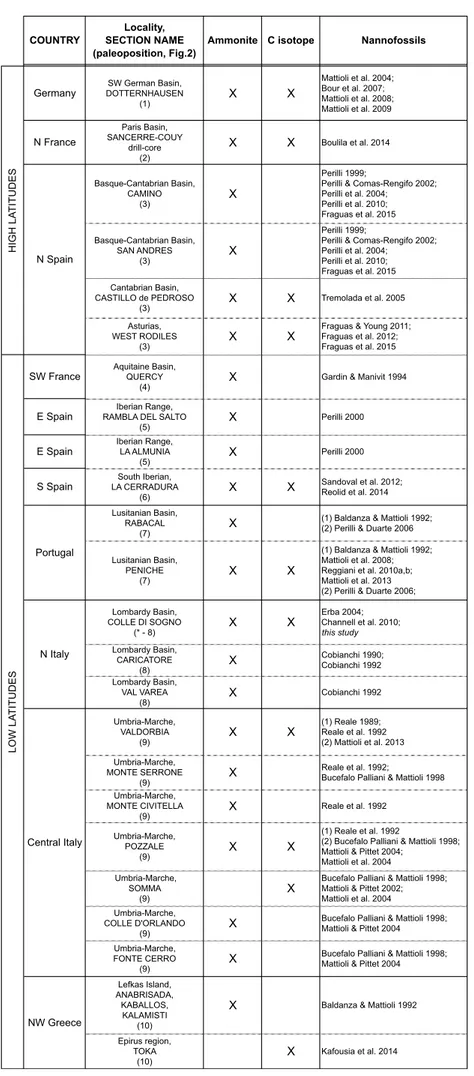
Using the zonation of Mattioli & Erba (1999), in Figure 6 we compare nannofossil biohorizons
com-prised between the FOs of genera Calyculus and Watz-naueria against ammonite biozones (latest Pliensba-chian to EarlyToarcian) as documented for sections in Germany, France, Spain, Portugal, Italy and Greece (see Tab. 1 for references). The chronostratigraphyof each calcareous nannofossil event is discussed below in stra-tigraphic order.
* The FO of Calyculus is reported from the mid-dle-upper emaciatum AZ in Italyand from the upper spinatum AZ in Argentina (Al-Suwaidi et al. 2010). This species is present since the base of the Dotternhausen (Germany) and Sancerre-Couy (France) sections, which are assigned to the upper spinatum AZ. In two sections from N Spain (Camino and San AndreÂs) this genus is reported as rare and discontinuous since the ibex and davoei AZs, while in one section form Portugal (Pe-niche) it is present since the jamesoni AZ.
* The FO of L. sigillatus correlates with the ema-ciatum/polymorphum AZs boundaryinterval in Portu-gal, the emaciatum/tenuicostatum AZs boundaryinter-val in Italyand lowermost tenuicostatum AZ in some Spanish sections. Older first occurrences are reported from N Spanish sections, where this biohorizon falls within the spinatum AZ. The FO of L. sigillatus corre-lates with younger levels in Argentina, within the uppermost tenuicostatum AZ (Al-Suwaidi et al. 2010). This species is present since the base of the sections in Germanyand France, in samples assigned to the upper spinatum AZ. The rareness of L. sigillatus potentially weakens the reproducibilityof its FO, however, Figure 6 evidences, as pointed out byprevious Authors (Mat-tioli & Erba 1999; Mat(Mat-tioli et al. 2013), that this event can be useful to approximate the Plienbachian/Toarcian boundaryonlyat lower latitudes (Italy, Portugal and S Spain), while at higher latitudes this event is older and
Fig. 5 - Comparison between calcareous nannofossil events detected byMattioli & Erba (1999) (A) and the biohorizons recognized at Colle di Sogno (B).
Fig. 6 - A) Main calcareous nannofos-sil biohorizons plotted against Ammonite Zones from higher and lower lati-tude sections as synthetized in Tab. 1. Solid symbols iden-tifydata derived from pub-lished range charts; empty ones refer to works without range charts; B) Diachroneity and reproducibilityof indivi-dual biohorizons based on ammonite dating.
dated as latest Pliensbachian (Bown et al. 1988; Fraguas et al. 2015).
* The FO of L. crucicentralis is reported from the tenuicostatum AZ, although at different levels, in Italy and Greece. An older occurrence is re-ported from Germany, Spain and Por-tugal where it correlates with the uppermost spinatum-lowermost tenui-costatum AZs, or with the uppermost emaciatum-lowermost polymorphum AZs.
* The FO of C. poulnabronei is reported from the lower tenuicostatum AZ in Spain and Italy, whereas in Ger-manyand Portugal this taxon has a younger FO in the lowermost falci-ferum and levisoni AZs, respectively.
* The FO of C. superbus is re-ported from the lower-middle tenui-costatum and middle polymorphum AZs to the lower-middle falciferum, serpentinus and levisoni AZs. While in most Italian sections the FO of C. superbus is dated as lower-middle te-nuicostatum AZ, in most Spanish and Portugal sections it correlates with the middle serpentinus and middle levisoni AZs, respectively.
* The FO of L. velatus is re-ported from the lower tenuicostatum AZ to the middle serpentinus AZ in Germany, Spain and Italy. This biohor-izon correlates with two different le-vels in Portugal: uppermost emacia-tum AZ and middle levisoni AZ.
* The FO of D. ignotus is re-ported from Italyand one Spanish sec-tion (Castillo de Pedroso) in the inter-val across the tenuicostatum/serpenti-nus AZs boundary, while in Germany is from the base of the falciferum AZ. In the other Spanish sections and in Greece, this biohorizon correlates COUNTRY
Locality, SECTION NAME (paleoposition, Fig.2)
Ammonite C isotope Nannofossils
Germany SW German Basin, DOTTERNHAUSEN (1) X X Mattioli et al. 2004; Bour et al. 2007; Mattioli et al. 2008; Mattioli et al. 2009 N France Paris Basin, SANCERRE-COUY drill-core (2) X X Boulila et al. 2014 Basque-Cantabrian Basin, CAMINO (3) X Perilli 1999; Perilli & Comas-Rengifo 2002; Perilli et al. 2004; Perilli et al. 2010; Fraguas et al. 2015 Basque-Cantabrian Basin, SAN ANDRES (3) X Perilli 1999; Perilli & Comas-Rengifo 2002; Perilli et al. 2004; Perilli et al. 2010; Fraguas et al. 2015 Cantabrian Basin, CASTILLO de PEDROSO (3) X X Tremolada et al. 2005 Asturias, WEST RODILES (3) X X
Fraguas & Young 2011; Fraguas et al. 2012; Fraguas et al. 2015 SW France Aquitaine Basin, QUERCY (4) X
Gardin & Manivit 1994
E Spain
Iberian Range, RAMBLA DEL SALTO
(5) X Perilli 2000 E Spain Iberian Range, LA ALMUNIA (5) X Perilli 2000 S Spain South Iberian, LA CERRADURA (6) X X Sandoval et al. 2012; Reolid et al. 2014 Lusitanian Basin, RABACAL (7)
X (1) Baldanza & Mattioli 1992; (2) Perilli & Duarte 2006
Lusitanian Basin, PENICHE
(7) X X
(1) Baldanza & Mattioli 1992; Mattioli et al. 2008; Reggiani et al. 2010a,b;
Mattioli et al. 2013 (2) Perilli & Duarte 2006;
Lombardy Basin, COLLE DI SOGNO (* - 8) X X Erba 2004; Channell et al. 2010; this study Lombardy Basin, CARICATORE (8) X Cobianchi 1990; Cobianchi 1992 Lombardy Basin, VAL VAREA (8) X Cobianchi 1992 Umbria-Marche, VALDORBIA (9) X X (1) Reale 1989; Reale et al. 1992 (2) Mattioli et al. 2013 Umbria-Marche, MONTE SERRONE (9)
X Reale et al. 1992;Bucefalo Palliani & Mattioli 1998
Umbria-Marche, MONTE CIVITELLA (9) X Reale et al. 1992 Umbria-Marche, POZZALE (9) X X (1) Reale et al. 1992 (2) Bucefalo Palliani & Mattioli 1998; Mattioli & Pittet 2004; Mattioli et al. 2004 Umbria-Marche,
SOMMA (9)
X
Bucefalo Palliani & Mattioli 1998; Mattioli & Pittet 2002; Mattioli et al. 2004 Umbria-Marche,
COLLE D'ORLANDO (9)
X Bucefalo Palliani & Mattioli 1998; Mattioli & Pittet 2004
Umbria-Marche, FONTE CERRO
(9) X
Bucefalo Palliani & Mattioli 1998; Mattioli & Pittet 2004
Lefkas Island, ANABRISADA,
KABALLOS, KALAMISTI
(10)
X Baldanza & Mattioli 1992
Epirus region, TOKA (10) X Kafousia et al. 2014 HIGH LA TITUDES LOW LA TITUDES Portugal NW Greece N Italy Central Italy N Spain
Tab. 1 - Sections considered in Figs 6 and 7. For each section the papers describ-ing calcareous nannofossil distribu-tion are reported. The presence of ammonite zones and/or chemostra-tigraphyis also included. Number after each section name corresponds to the paleogeographic position re-ported in Fig. 2.
with the interval across the serpentinus/bifrons AZs boundary. In Portugal it is reported from the middle levisoni to the base of bifrons AZs.
* The LO of M. jansae ranges from the upper-most tenuicostatum to the lower falciferum and lower serpentinus AZs in Germany, France, Spain, Italy and Greece. In Portugal this biohorizon is younger, as it is reported from the middle levisoni AZ. In most sections from Spain (La Almunia, Rambla del Salto), Portugal (Rabacal, Peniche) and Italy(Pozzale, M.te Serrone) and in one section from higher latitudes (West Rodiles, N Spain) it is possible to separate the ``last common occurrence'' (LCO) from the LO of M. jansae based on its abundance and range continuity(Fig. 6). At lower latitudes, the LCO of M. jansae correlates with the middle-upper tenuicostatum AZ (Italyand Spain), while in Portugal this biohorizon correlates with the polymor-phum/levisoni AZ boundaryinterval. At higher lati-tudes, in the West Rodiles section, the LCO corre-sponds to the upper tenuicostatum AZ.
* The FO of Watznaueria sp. 1 was documented with certaintyonlyfrom France and Italy, where it cor-relates with the top of falciferum and the base of the bifrons AZs, respectively. It might be that the FO of W. fossacincta reported from Germanyand Spain corre-sponds to the FO of Watznaueria sp. 1 (see taxonomic notes); if so, then the event is dated as latest tenuicosta-tum and earliest bifrons AZs in Spain and Germany, respectively.
The critical evaluation of nannofossil biohorizons calibrated to ammonite zones (Fig. 6B) evidences that the succession of nannofossil events is consistent with the scheme of Mattioli & Erba (1999) and reproducible, with the onlyexception of older FOs of L. velatus when the revisions of the Valdorbia and Peniche sections (Mat-tioli et al. 2013) are taken into account. Nevertheless, time discrepancyof various extents is derived for all nannofossil biohorizons. In some cases diachroneity seems justifiable bythe rareness of taxa, especiallyin their initial ranges, and in part with verypoor preserva-tion of nannofossil assemblages (e.g. Greek secpreserva-tions, Baldanza & Mattioli 1992); the delicate structures of some species (e.g. L. velatus) and taxonomic uncertain-ties (e.g. W. fossacincta versus Watznaueria sp. 1) may also contribute to the documented diachroneity. Even if the available dataset is limited, latitudinal time-differ-ences of some biohorizons are recognized. This is the case for the FOs of L. sigillatus and L. crucicentralis, which are older at higher latitudes, while the FO of L. velatus is older at lower latitudes (Fig. 6B). Data from Portugal are different relative to both higher and lower latitudes and no systematic patterns are recognizable. For M. jansae, both the LCO and the LO appear to be coeval at lower and higher latitudes. However, in Portu-gal both biohorizons are younger. Figure 6 suggests that
the generalized diachroneityof nannofossil events could also result from the calibration to ammonite biozones, known to be controlled regionally(Jenkyns et al. 2002). Mattioli & Erba (1999) demonstrated that their Tethyan nannofossil scheme is largelycorrelatable with the Bor-eal one (Bown et al. 1988; Bown & Cooper 1998) (Mat-tioli & Erba 1999, fig. 12), overcoming the paleoprovin-cialism shown byammonites (Elmi et al. 1993).
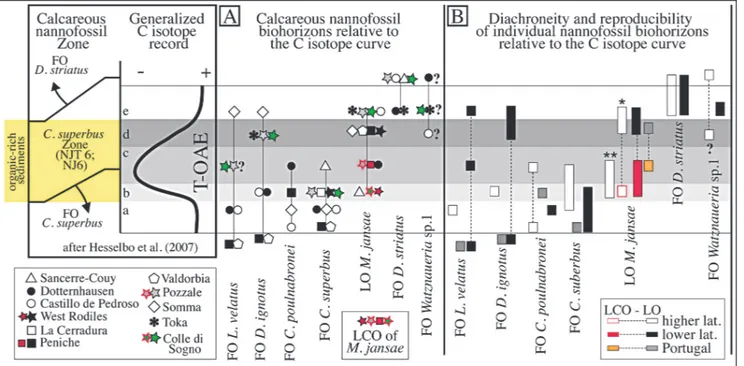
As suggested byHesselbo et al. (2007), chemos-tratigraphyis probablya best framework to test the synchroneity of biohorizons and, consequently, in Fig. 7 we consider nannofossil events against the C isotopic anomalyassociated to the T-OAE for sections where these datasets are available (Tab. 1), expanding the pre-vious calibration of the FOs of C. superbus and D. stria-tus done byMattioli et al. (2004). Since the C isotope curves available for most of the considered sections have low resolution, we used a generalized curve following Hesselbo et al. (2007, fig. 1) and subdivided the analysed interval in five sub-intervals: pre-anomaly(sub-interval a), rapid decrease (sub-interval b), minimum (sub-inter-val c), recovery(sub-inter(sub-inter-val d) and post-anomaly(sub-interval e) phases. Individual calcareous nannofossil events are discussed below in stratigraphic order.
* The FO of L. velatus show diachroneityamong different sections: in Italythis biohorizons correlates with C isotopic sub-intervals a to e, while it was found in sub-interval a in sections from Portugal, N Spain and Germany.
* The FO of D. ignotus is correlatable to C iso-toptic sub-intervals a to e in Italian sections, while this biohorizon correlates with sub-intervals a and d in Por-tugal and Greece, respectively. In sections from N Spain and Germanythe FO of D. ignotus falls within C iso-topic sub-interval b.
* The FO of C. poulnabronei correlates with iso-topic sub-interval a in Italyand N Spain, with sub-inter-val b in Portugal, and with sub-intersub-inter-val c in Germany.
* The FO of C. superbus correlates with C iso-topic interval a in Portugal and Germany, with sub-intervals a to b in N Spain and Italy, while this biohor-izon falls within sub-interval b in S Spain and within sub-interval c in France.
* The LO of M. jansae correlates with sub-inter-vals b, c and d in France, Germanyand Portugal, re-spectively. In sections fron Italy and N Spain this bio-horizion spans sub-intervals d and e. When the LCO of M. jansae is considered, it correlates with sub-intervals a and c in Italy, a in N Spain and c in Portugal. This datum is not distinguishable in sections from France, Germany, S Spain and Greece.
* The FO of D. striatus is correlatable to C iso-topic sub-interval e in all analysed sections.
* The FO of Watznaueria sp. 1 is correlatable with C isotopic sub-interval e at Colle di Sogno, while
this biohorizon was not unequivocallydocumented in sections with C isotopic chemostratigraphy. However, if the FO of W. fossacincta reported from Germany, N Spain and Greece corresponds to the FO of Watznaue-ria sp. 1 (see taxonomic notes) then this event spans the C isotopic sub-intervals d to e.
The evaluation of nannofossil biohorizons cali-brated against the C isotope generalized curve (Fig. 7B) evidences some differences in the sequence of events re-lative to the one reported in Figure 6B and the scheme of Mattioli & Erba (1999). We notice that the onlydiscre-pancies derive from recent re-examitation of the Valdor-bia and Peniche sections (Mattioli et al. 2013) that re-sulted in older FOs of L. velatus and D. ignotus (Fig. 6B). When the C isotopic anomalyis taken as refer-ence, the nannofossil biohorizons show some diachro-neity, although much reduced relative to the calibration against ammonite zones. This reinforces the proble-matic use of ammonite zonation as stratigraphic frame-work (Jenkyns et al. 2002; Mattioli et al. 2004; Hesselbo et al. 2007). Possible reasons for some of the diachro-nous events might reside in rareness of a few species, especiallyin their earlyrange (e.g. L. velatus and D. ignotus) and taxonomic uncertainties (e.g. W. fossacincta versus Watznaueria sp. 1). In Figure 7B, latitudinal time-differences of some biohorizons are recognized: in fact, C. poulnabronei first appears at higher latitudes, while the FO of C. superbus is older at lower latitudes. When
the C isotopic curve is taken as reference, the dataset from Portugal is consistent with lower latitude records. In sections from France and Germany, it is not possible to separate the LCO from the LO of M. jansae: here the LO of this taxon is older than in the other areas. In most sections from N Spain, Portugal and Italy, instead, the LCO of M. jansae is distinguished from its LO (Fig. 7). We underline that the LCO of M. jansae at lower latitudes correlates with the LO at higher latitudes (Fig. 7B). Indeed, the record from N Spain (West Rodiles section) shows that M. jansae ex-perienced first a LCO at stratigraphic levels comparable to the LCO at lower latitude and LO at higher latitudes, and later a LO coeval with the LO at lower latitudes. The LCO of M. jansae is evidenced bythe drop in abundance of M. jansae and the disappearance level of the normal morphotypes, as documented in this study (Fig. 8).
Our results, complementing previous data, show that few nannofossil events constrain the T-OAE C isotopic anomalyand are traceable among different regions. Specifically, although C. superbus is discontin-uous at higher latitudes, its FO correlates with the onset of T-OAE at supraregional scale, as also pointed out byMattioli et al. (2004) and illustrated byHessel-bo et al. (2007). Our analyses confirm that the FO of D. striatus is useful to approximate the end of the T-OAE C isotopic anomaly(Mattioli et al. 2004; Hes-selbo et al. 2007). The critical evaluation of M. jansae
Fig. 7 - A) Selected calcareous nannfossil biohorizons plotted against the C isotope generalized curve, divided into five intervals as follows: a) pre-excursion, white band; b) rapid decrease, light greyband; c) interval with minimum values, medium grayband; d) recovery, dark greyband; e) values comparable to the pre-excursion ones, white band. Following Hesselbo et al. (2007), the yellow box indicates organic-rich sediments deposited during the T-OAE. B) Diachroneityand reproducibilityof individual biohorizons relative to the C isotopic anomaly. The FO of D. striatus at Colle di Sogno is reported after Erba (2004). See Tab.1 for bibliographic details regarding data reported.
disappearance level allowed the separation of its LCO preceding the LO. These biohorizons are more evident at lower latitudes, where M. jansae is a common com-ponent of Pliensbachian-lowermost Toarcian assem-blages and shows a marked decrease in abundance in the earlyphase of the C isotopic anomaly(sub-inter-vals b and c). At similar stratigraphic levels, the LO of M. jansae is reported at higher latitudes. Taking into account latitudinal differences, the LO of M. jansae is here proposed as additional event to approximate the end of the T-OAE at lower latitudes, where the LCO is veryclose to the FO of C. superbus. The record from N Spain (West Rodiles section documented by Fraguas et al. 2015) suggests that the LCO and LO can be separated also at relativelyhigher latitudes where both events are coeval with those documented at lower latitudes.
Absolute abundances
The quantitative investigation of ultrathin sections revealed that the nannofossils total abundance is highest in the Domaro Lmst. and the lower part of the Sogno Fm. (~1000 specimens/mm2), without significant changes at
the sharp lithostratigraphic boundarybetween the two formations (Fig. 8). At the base of the Fish Level total abundance is halved remaining at similar values across the black shales and overlying interval (Fig. 8).
The carbonate content mostlytrace the fluctua-tions in nannofossil absolute abundances, with the ex-ception of the interval above the Fish Level where CaCO3 values of ~60-80 % correlate with low
abun-dances around 500 specimens/mm2. The S. punctulata
and M. jansae morphogroups constitute most of the micrite through the Domaro Lmst. and Sogno Fm. be-low the Fish Level. In the black shale interval both S.
Fig. 8 - Calcareous nannofossil absolute abundances and carbonate content (% CaCO3) of the Colle di Sogno section. For lithologyand
punctulata and M. jansae drop in abundance while an increase in abundance is observed for small coccoliths that, however, do not contribute much to calcite, justi-fying the low carbonate content. In the interval above the Fish Level, nannofossils are mostlyrepresented by small taxa with some contribution by S. punctulata; this is possiblythe reason for a relativelyhigh CaCO3
con-tent. As previouslydiscussed for other intervals (Erba & Tremolada 2004), it is clear that the number of speci-mens per se does not reflect the amount of biogenic calcite since the volume-mass of individual taxa playa crucial role for micrite production.
Total S. punctulata abundance (S. punctulata + ``small S. punctulata'' + ``encrusted S. punctulata'') shows the highest values within the Domaro Lmst. (~750 specimens/mm2). In the Sogno Fm., after an
in-itial decrease to a minimum of ~170 specimens/mm2,
the S. punctulata mean abundance fluctuates around ~400 specimens/mm2 up to 7.5 m. The interval below
the base of the Fish Level displays an increase up to ~750 specimens/mm2. Across the Fish Level the
abun-dance of S. punctulata drop to 0-100 specimens/mm2. In
the interval above the Fish Level a slight recoveryis underlined byan increase of S. punctulata to ~230 speci-mens/mm2. Within the S. punctulata group, ``encrusted
S. punctulata'' is dominating in the Domaro Lmst. (~370 specimens/mm2), drops in abundance across the
Do-maro Lmst./Sogno Fm. boundary(~90 specimens/ mm2), and is not observed in the Fish Level and the
overlying interval. ``Small S. punctulata'' shows a slight decrease in abundance from the Domaro Lmst. (~130 specimens/mm2) to the Sogno Fm. (~75 specimens/
mm2), and further decreases to a mean of ~10
speci-mens/mm2in the Fish Level. In the overlying interval,
abundance partiallyrecovers to ~25 specimens/mm2.
The abundance of S. punctulata remains relativelycon-stant (a mean of ~250 specimens/mm2) from the base of
the section to 7.5 m, where this taxon increases up to ~500 specimens/mm2, with an abundance peak
preced-ing the Fish Level. In the black shale interval S. punc-tulata sharplyfalls to values lower than 50 specimens/ mm2. A recoveryto abundances of ~200 specimens/
mm2is recorded in the interval above the Fish Level.
The changes in abundance of genus Schizosphae-rella are similar to those observed in previous studies performed using different methodologies (simple smear slides, settling slides, thin sections). The ``Schizosphae-rella decline'' was recognized and defined byTremolada et al. (2005, fig. 2) on the basis of a marked reduction of S. punctulata relative abundance (%). Similar trends are recognizable in Portugal as a drop of S. punctulata and total nannofossil abundances (number of nannofossils per grams of rock) (Mattioli et al. 2008, fig. 2c) and S. punctulata size (Mattioli et al. 2004, fig. 2; Suan et al. 2008, fig. 2). The ``Schizosphaerella crisis'' was defined in the earliest Toarcian as the drop in abundance of S.
punctulata just prior the T-OAE black shale determin-ing the end of the dominance of this rock-formdetermin-ing taxon (Erba 2004, figs. 8-9; Tremolada et al. 2005, figs. 2-3). Similarly, a decrease of S. punctulata and nannofossil absolute abundances (number of nannofossils per gram of rock) (Mattioli et al. 2008, fig. 2c) as well as S. punc-tulata size (Suan et al. 2008, fig. 2) is recognizable in Portugal just below the C isotope negative excursion. In Spain the ``Schizosphaerella crisis'' could be identified within a decrease in S. punctulata and nannofossil abso-lute abundances (number of nannofossils per gram of rock) (Fraguas et al. 2012, fig. 2) and the minimum of S. punctulata and M. jansae relative abundances (%), both coinciding with the highest TOC values and the base of the C isotope negative excursion (Fraguas et al. 2012, fig. 3). Hermoso et al. (2012, fig. 3) analysed at ultra high-resolution the behaviour of calcareous nannofos-sils across the base of T-OAE in the Sancerre-Couydrill core (France), and found a marked decline of S. punc-tulata and coccoliths absolute abundances (number of specimens per gram of sediments) just prior the onset of the negative C isotope excursion and the onset of black shale deposition.
Data gained at Colle di Sogno (both absolute and semi-quantitative abundances) permit to identifythe ``Schizosphaerella decline'', correlating with the Domaro Lmst./Sogno Fm. boundary, and corresponding to the Pliensbachian/Toarcian boundary. Furthermore, the ``Schizosphaerella crisis'' is spectacularlywell expressed at Colle di Sogno, where at the base of the Fish Level (corresponding to the onset of the T-OAE) S. punctu-lata abundances dramaticallydrop, accompanied bya contemporaneous major decrease of M. jansae and par-alleled byan increase of placolith genera, as highlighted byTremolada et al. (2005). Considering these data, it is evident that the ``Schizosphaerella decline'' and the ``Schizosphaerella crisis'' are biohorizons traceable at supraregional scale and theyare here used and proposed as additional biohorizons (Fig. 5B) to approximate the Pliensbachian/Toarcian boundaryand the T-OAE on-set, respectively.
Contraryto S. punctulata, the abundance of the M. jansae group shows an increase across the Pliensba-chian/Toarcian boundary: in the Domaro Lmst. the to-tal abundance varies from values of 165 specimens/mm2
(at the base) to 420 specimens/mm2 (at the top), and
``thin M. jansae'' is dominating over M. jansae. A further increase to ~850 specimens/mm2is observed in
the Sogno Fm. up to 5.5 m: in this interval M. jansae displays a marked increase in abundance while the thin morphotypes remain rather constant. A decrease to ~150 specimens/mm2due to a major drop of both thin
and normal M. jansae nannoliths precedes an abundance peak of ``thin M. jansae'' of 580 specimens/mm2 just
below the Fish Level. Notably, only ``thin M. jansae'' specimens are observed in the black shale interval,
where their abundance drops to ~40 specimens/mm2up
to ~14 m, where this taxon disappears.
Genus Lotharingius is the onlycoccolith-genus with abundances comparable to highlycalcified nanno-liths (S. punctulata and M. jansae). It shows verylow abundances in the Domaro Lmst. and lower portion of the Sogno Fm. (a mean of ~35 specimens/mm2),
although a slight increase is observed across the Pliens-bachian/Toarcian boundary. An increase in abundance is observed from 7 m upwards, reaching the highest abundance within the Fish Level (up to 460 speci-mens/mm2). In the interval above the black shales
Lotharingius abundance decreases to values higher than those recorded below the Fish Level (a median of ~100 specimens/mm2).
The biostratigraphic investigation of smear slides shows that genus Biscutum is present from the base of the analysed interval (see Appendix 2). However, the rarityand tinysizes of Biscutum coccoliths prevent their identification in ultrathin sections if abundance is verylow. Therefore, Biscutum is observed onlyabove
8.3 m, where mean abundances of ~30 specimens/mm2
are recorded across the Fish Level. In the interval above, abundances are verylow (a mean of ~3 specimens/ mm2). Genus Carinolithus appears in the earliest
Toar-cian, and therefore is absent throughout the Domaro Lmst. and the lowermost part of the Sogno Fm. In the first part of its record this genus shows verylow abun-dance (a mean of ~20 specimens/mm2) and an increase
across the Fish Level, reaching values up to ~110 speci-mens/mm2. In the portion above the black shale interval
Carinolithus abundance decreases to values slightly higher than those recorded below the Fish Level (a mean of ~30 specimens/mm2).
Genus Calyculus shows the lowest abundance within the Domaro Lmst. (mean of ~20 specimens/ mm2) and a significant increase from the base of the
Sogno Fm. reaching its highest values at 6.0 m (up to 150 specimens/mm2). Calyculus abundance decreases
before the Fish Level (a mean of ~50 specimens/mm2)
and displays ample fluctuations across the black shale
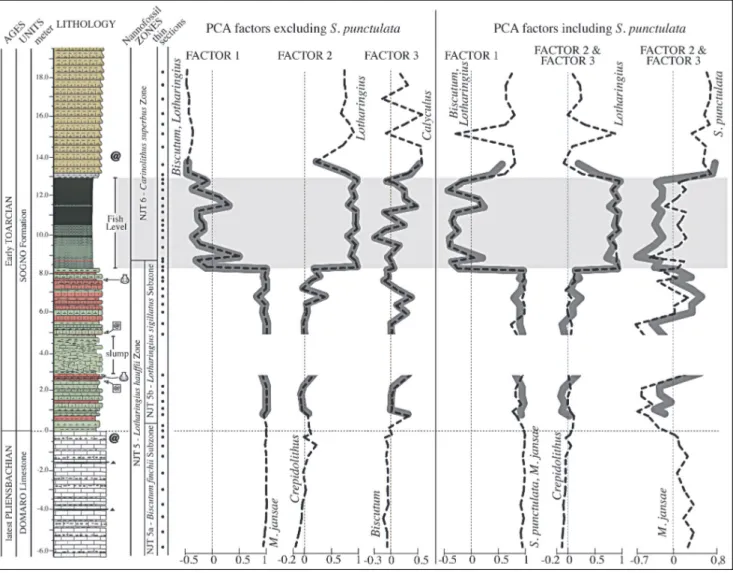
Fig. 9 - Stratigraphic trends of PCA scores plotted against lithostratigraphyand calcareous nannofossil biozones. Solid thick curves represent factors extracted from the restricted interval, dotted thin curves represent factors extracted from the entire interval. For lithology legend see Fig. 3.
interval (0-120 specimens/mm2). Above the Fish Level,
abundance decreases to a mean of ~30 specimens/mm2.
Genus Crepidolithus shows minor fluctuations in abundance with average values of ~45 specimens/mm2
in the Domaro Lmst. and the lower part of the Sogno Fm. In the Fish Level and the overlying interval Crepi-dolithus abundance decreases to a mean value of ~20 specimens/mm2.
Principal Component Analyses
The results of PCA applied to both absolute abundances and percentages of the entire studied inter-val and of the restricted interinter-val (see Materials and Methods for details) are synthetized in Tab. 2 and Fig. 9. The PCA conducted on assemblages without S. punc-tulata extracted three factors, identical for absolute abundances and percentages as well as for the total and restricted stratigraphic intervals. Factor 1 explains the highest variance (60.9-80.7 %) and has the highest positive loading for M. jansae, while the lowest negative loading for Biscutum and Lotharingius (Tab. 2A).
Factor 2 explains 17.4-35.2 % of the variance and displays highest loading for Lotharingius opposite to Crepidolithus. Factors 1 and 2 together explain ~95-98% of the variance, while Factor 3 corresponds only to 1-2% of the total variance. The latter factor marks
the opposition of genus Calyculus (highest) to genus Biscutum (lowest).
PCA performed on the datasets including S. punctulata extracted three factors consistent for abso-lute abundances and percentages as well as for the total and restricted stratigraphic intervals (Tab. 2B). Factor 1 (54.3-80.9 % of the total variance) displays the highest positive loading for S. punctulata and M. jansae in op-position to Biscutum and Lotharingius. We notice that when the total interval is considered, Factor 1 shows highest positive loading for S. punctulata opposed to Biscutum. Factor 2 of the restricted interval (13-32.8% of the total variance) corresponds to Factor 3 of the total interval (6.6-11.1% of the total variance): they have the highest loading for Lotharingius and lowest loading for Crepidolithus. Factor 3 of the restricted in-terval (9.2-10.8% of the total variance) corresponds to Factor 2 of the total interval (11.8-23.3% of the total variance): their loadings are opposite for S. punctulata and M. jansae.
Paleoecology of Early Jurassic calcareous nannoplankton
The paleoecological affinities of EarlyJurassic calcareous nannoplankton are still not well understood
FACTOR 1 FACTOR 2 FACTOR 3
+ M. jansae + Lotharingius + Calyculus
- Biscutum/Lotharingius - Crepidolithus - Biscutum
AA 78.2% of the variance 20.1% of the variance 1.1% of the variance
% 60.9% of the variance 35.2% of the variance 2.3% of the variance
FACTOR 1 FACTOR 2 FACTOR 3
+ M. jansae + Lotharingius + Calyculus
- Biscutum/Lotharingius - Crepidolithus - Biscutum
AA 80.7% of the variance 17.4% of the variance 1% of the variance
% 68.5% of the variance 27.1% of the variance 2.2% of the variance
FACTOR 1 FACTOR 2 FACTOR 3
+ S. punctulata/
M. jansae + Lotharingius + M. jansae
- Biscutum/Lotharingius - Crepidolithus - S. punctulata
AA 76.8% of the variance 13% of the variance 9.2% of the variance
% 54.3% of the variance 32.8% of the variance 10.8% of the variance
FACTOR 1 FACTOR 2 FACTOR 3
+ S. punctulata + S. punctulata + Lotharingius
- Biscutum - M. jansae - Crepidolithus
AA 80.9% of the variance 11.8% of the variance 6.6% of the variance
% 64.2% of the variance 23.3% of the variance 11.1% of the variance
entire studied interval A) PCA factors excluding S. punctulata
interval between the FO of Carinolithus and the LO of M. jansae entire studied interval
B) PCA factors including S. punctulata
interval between the FO of Carinolithus and the LO of M. jansae
Tab. 2 - PCA factors extracted from calcareous nannofossil abso-lute abundances (AA) and percentages (%), on both entire and restricted inter-vals.