Universit`
a degli Studi del Piemonte Orientale
Amedeo Avogadro
Dipartimento di Scienze e Innovazione Tecnologica Dottorato di Ricerca in Chemistry&Biology
XXIX ciclo (A.A. 2013-2016)
Curriculum: Energy, environmental and food sciences SSD: BIO/11
NGS DATA ANALYSIS APPROACHES FOR
CLINICAL APPLICATIONS
Igor Saggese
Supervised by Prof. Flavio Mignone
Contents
1 Introduction 5
1.1 Molecular diagnostics . . . 6
1.2 Denovo assembly of RNA-seq data . . . 9
1.3 Application of denovo assembly to metagenomics . . . 10
2 Outline of the Thesis 17 3 Analysis workflows for NGS 23 3.1 A new pipeline for variant calling and annotation . . . 25
3.1.1 Analysis profiles . . . 25
3.1.2 Alignment to reference . . . 26
3.1.3 Sequencing error detection . . . 28
3.1.4 Variant annotation . . . 29
3.1.5 Integration with external resources . . . 30
3.2 Amplicon Suite . . . 31 3.2.1 Clinical validation . . . 34 3.3 SmartVir . . . 42 3.3.1 Results . . . 44 4 Algorithms for NGS 53 4.1 STAble . . . 55
4.1.1 Head-tail alignments detection . . . 56
4.1.3 Results post-processing . . . 71
4.1.4 Parallel workflow . . . 71
4.2 Benchmarks . . . 72
4.2.1 Benchmarks on simulated datasets . . . 72
4.2.2 Benchmarks on real data . . . 78
5 Discussion 83 5.1 Acknowledgements . . . 86
6 List of Publications 89 6.1 Journals and book chapters . . . 89
Chapter 1
Introduction
Next generation sequencing (NGS) techniques are seeing constant evo-lutions and allow us to sequence nucleic acids with increasingly com-petitive cost per base and unprecedented speed: in just few hours it is possible to produce the same amount of data obtained with traditional techniques in the past 30 years [1].
The advent of these technologies answered the demand for greater and more advanced instruments to answer complex biological questions, al-lowing researchers and clinicians to probe genomes in greater depth. Sanger sequencing [2], despite the impressive improvements since its introduction is not suitable for large-scale modern projects due to its high costs and low throughput.
NGS scenario is under constant evolution and many different platforms are available, such as Illumina, IonTorrent and Roche 454 (that is cur-rently at phase-out stage), however in every case the output is a vast set of reads (up to billions), each one representing a fragment of the input sample (typically in the range of 50-500 nucleotides) that have to be processed in a way that depends on the kind of analysis in order to get some meaning from them.
Analysis task is complicated by the presence of sequencing errors: al-though provided accuracy is usually very high (in the range of 98% to
99,9%) each platform has its specific error model that must be consid-ered when performing analysis.
This problem is compensated by sequencing depth, that represents how many times each nucleotide from input sample has been sequenced: it is very unlikely to get the same errors in all reads, so by applying proper statistics it is possible to detect them. Adequate coverage is critical for accurate reassembly of the genomic sequence and to date it is not a problem to achieve very high depths.
Because of high throughput a NGS run on a single sample is likely to generate more data than is required, so with adequate protocols it is possible to multiplex multiple samples and to process them in a single run.
Regardless of the origin of the biological sample, NGS platforms pro-duce very large files in which the reads from input sequences are coded and it may be not trivial at all to manage them and perform all the analysis steps required to extract useful information: bioinformatics analysis has become an essential part of the process.
The field of application for NGS techniques is wide and there is no “universal” way of analysing data. Depending on requirements of the specific project the need to adapt existing tools and pipelines or to develop new ones might arise.
The main aim of this research project was the development of new bioinformatic algorithms and integrated tools to address several as-pects of NGS data analysis, with particular focus on three main areas: molecular diagnostics [3], denovo assembly of RNA-seq data [4] and application of denovo assembly to metagenomics [5].
1.1
Molecular diagnostics
Molecular diagnostics is a collection of techniques that allow to assess a person’s health at molecular level by detecting specific markers in
his DNA and RNA and their possible effects on expressed proteins. By genome sequencing it is possible to diagnose susceptibility to spe-cific diseases and to get additional useful informations about patients on whom clinical actions must be taken.
This name identifies a wide set of techniques, however this project was mainly focused on the identification of variants in gene panels and virus genotyping.
A typical approach in this area is target based amplification, that con-sists in the design of specific primer pairs to amplify genomic regions where interesting markers are located: these regions are named am-plicons.
Sequencing results are processed by a variant calling procedure, that consists on alignment of reads to a reference sequence to identify poten-tial variants that are finally annotated with functional informations. These applications are opening the doors to personalised medicine, however there is still a number of open challenges that must be ad-dressed before they can be transferred to routine clinical practices, especially on the bioinformatics analysis side. The presence of se-quencing errors and the large size of datasets are probably the most limiting factors that must be dealt with.
BRCA1 and BRCA2 (BRCA) genes are among the most frequently analysed genes in clinical routine, since rapid identification of germline BRCA mutations can be useful for both prophylactic strategies and therapy administration. In fact they are the two main highly penetrant genes predisposing to hereditary breast and ovarian cancer syndrome (HBOCS): about 5–10% of tumour cases are mainly caused by mu-tations in the BRCA tumour-suppressor genes, resulting in nonfunc-tional BRCA proteins. This defect compromises the accurate DNA repair function, cell cycle regulation and transcriptional activity [6, 7]. Sanger sequencing is considered the gold standard for identifying qual-itative changes in BRCA regions: nevertheless, it is time consuming
and expensive, due to the large sizes of the coding regions of both genes (5592 and 10257 bp for BRCA1 and BRCA2 genes, respectively), and the equal distribution of mutations within regions of interest (Breast Cancer Information Core database [8] reports about 1781 and 2000 variants for BRCA1 and BRCA2 genes, respectively).
Introduction of NGS in laboratory practice allowed molecular diag-nostic laboratories to increase the throughput and to analyse multiple genes in the same run, facilitating the study of complex disease where Sanger sequencing is not technically or economically feasible. How-ever given current limitations these techniques are only applied as a support to traditional ones even though, with proper advancements, they are expected to replace them in the future.
Another important - and very current - molecular diagnostics ap-plication plays an important role in the treatment of HCV infected patients. Obtaining the correct genotype and subtype information about the infecting strain is essential to ensure that the most ap-propriate treatment regimen is selected. In addition once the viral population has been profiled it is also important to analyse mutations present on viral genome in order to detect those associated with drug resistances [9].
NGS has given a boost to this research area, since information pro-vided by short reads can be used to unambiguously detect correct genotype [10] and genomic mutations. High sequencing depths also provide enough information to assess the presence of a mixed infec-tion.
Our contribution to this area was the the development of a robust procedure for variant calling and annotation from NGS data specifi-cally designed for clinical purposes that at present is used as core for two integrated tools: Amplicon Suite - for the detection and annota-tion of disease-related variants - and SmartVir - for virus genotyping and drug resistance detection.
The two applications and obtained results will be presented in chap-ter 3.
1.2
Denovo assembly of RNA-seq data
RNA-seq (also called Whole-Transcriptome shotgun sequencing (WTSS) [11]) is a set of powerful techniques that allow to perform identification and quantification of RNA transcripts in a biological sample.
Unfortunately given current limitations, NGS platforms do not output the whole transcripts but a vast set of reads that have to be properly assembled in order to reconstruct transcriptome.
Short-reads assembly represents a crucial point in data analysis, since subsequent steps heavily rely on high quality of reconstructions. At present there are two main approaches to transcriptome assembly:
Alignment to reference genome Denovo assembly
The first approach is the most efficient and accurate: it consists on alignment of reads to a reference genome, however it is viable only if high quality annotated reference sequences are available for the or-ganism that is object of study.
When references are not available denovo assembly has to be per-formed: reads are assembled blindly to reconstruct the longer tran-scripts.
Currently available tools for denovo assembly - such as Bridger [12], Oases [13] and Trinity [14] - emphasise the good sensitivity levels reached, but this result is often obtained by producing an high number of assemblies, consequentially increasing false positives. In addition they have very high hardware requirements, limiting their applicabil-ity especially in case of smaller laboratories that do not have access to dedicated computing infrastructures.
False positive reconstructions when working with real data are a very important matter, since in absence of any reference it is not trivial - and maybe not even possibile - to determine the correctness of a reconstruction.
As my MSc thesis project I contributed to the development of a prototype for a new denovo assembler for RNA-seq data, that was specifically designed to overcome current limitations in terms of both false positive reconstructions and hardware requirements. Preliminary results were encouraging so part of my PhD project was aimed towards its finalisation into STAble [15] that will be introduced in chapter 4.
1.3
Application of denovo assembly to
metagenomics
Metagenomics is the study of uncultured microorganisms sampled directly from their habitat.
NGS based metagenomics approaches allow us to study organisms that live in particular conditions that cannot be reproduced in laboratory environment and to analyse complex interactions that are established among different microbial populations but would otherwise be missed by examining artificial cultures.
This scenario opens further challenges for bioinformaticians, since it is necessary to deal with data coming from heterogenous communities that can be noisy and partial.
A typical metagenomics experiment is composed by two approaches: microbiota identification [16] and metatranscriptome characterisation [17].
The first is the most exploited one and consists on profiling the mi-crobial population in order to determine which species are actually present in a given sample, alongside their relative abundances.
The latter one is complementary to the former and allows to to un-derstand the effective metabolic activity of the profiled population by analysing collective transcriptome.
Microbiota identification is usually performed by amplicon sequencing 16s rRNA (that is conserved between different species) and to align reads to databases of annotated sequences, such as RDP [18]: in some cases it is possible to perform classification even at species level. Metatranscriptome characterisation involves a WTSS and at present transcripts reconstruction is usually performed by direct alignment of reads to a reference database, however - given the short length of reads - this approach is expected to cause many assignment ambiguities dur-ing mappdur-ing process and does not consider the possible present of new unannotated transcripts.
As part of this project we explored the possibility to apply den-ovo assembly approach to the collective metatranscriptome, by tuning STAble to assemble reads from multiple organisms.
Preliminary results for this extension will be presented in chapter 4 while future perspectives are discussed in chapter 5.
Bibliography
[1] Zhang J, Chiodini R, Badr A, Zhang G. The impact of next-generation sequencing on genomics. J Genet Genomics 2011; 38(3): 95–109.
[2] Sanger F, Nicklen S, Coulson AR DNA sequencing with chain-terminating inhibitors. Proc Natl Acad Sci USA 1977; 74(12):5463–5467.
[3] L. Feliubadal´o, A. Lopez-Doriga, E. Castellsagu´e et al., Next-generation sequencing meets genetic diagnostics: Development of a comprehensive workflow for the analysis of BRCA1 and BRCA2 genes. European Journal of Human Genetics 2013; 21(8):864-70. [4] Gordon Robertson et al. De novo assembly and analysis of
RNA-seq data. Nature Methods 7, 2010; 909–912.
[5] Wooley JC, Godzik A, Friedberg I. A Primer on Metagenomics. PLoS Comput Biol 2010; 6(2): e1000667.
[6] Anand P, Kunnumakkara AB, Sundaram C, et al. Cancer is a preventable disease that requires major lifestyle changes. Pharm Res 2008; 25(9):2097-116
[7] Gage M, Wattendorf D, Henry LR. Translational advances re-garding hereditary breast cancer syndromes. J Surg Oncol 2012; 105(5):444-51
[8] Szabo C, Masiello A, Ryan JF, Brody LC. The breast cancer infor-mation core: database design, structure, and scope. Hum Mutat. 2000; 16(2):123-31.
[9] Lontok E, Harrington P, Howe A, Kieffer T, Lennerstrand J, Lenz O, McPhee F, Mo H, Parkin N, Pilot-Matias T, Miller V. Hepatitis C virus drug resistance-associated substitutions: State of the art summary. Hepatology. 2015 Nov; 62(5):1623-32.
[10] Qiu P, Stevens R, Wei B, Lahser F, Howe AYM, et al. HCV Geno-typing from NGS Short Reads and Its Application in Genotype De-tection from HCV Mixed Infected Plasma. PLOS ONE 2015; 10(4): e0122082.
[11] In Seok Yang and Sangwoo Kim Analysis of Whole Transcriptome Sequencing Data: Workflow and Software. Genomics Inform. 2015 Dec; 13(4): 119–125.
[12] Chang Z, Li G, Liu J, Zhang Y, Ashby C, Liu D, Cramer CL, Huang X. Bridger: a new framework for de novo transcriptome assembly using RNA-seq data. Genome Biology 2015; 16:30. [13] Schulz MH, Zerbino DR, Vingron M, Birney E. Oases: robust
de novo RNA-seq assembly across the dynamic range of expression levels. Bioinformatics 2012; 28: 1086–1092.
[14] Grabherr MG, Haas BJ, Yassour M, Levin JZ, Thompson DA, Amit I, et al. Full-length transcriptome assembly from RNA-Seq data without a reference genome. Nat Biotechnol. 2011; 29: 644–652.
[15] Igor Saggese, Giovanni Manzini and Flavio Mignone. STAble: a novel approach to denovo assembly of RNA-seq data. 13th Inter-national Meeting CIBB 2016; 2016 Sept 1-3; Stirling - UK.
[16] Shah N, Tang H, Doak TG, Ye Y. Comparing bacterial communi-ties inferred from 16S rRNA gene sequencing and shotgun metage-nomics.. Methods Mol Biol. 2011; 733:195-205.
[17] Gilbert JA, Hughes M. Gene expression profiling: metatranscrip-tomics. Pac Symp Biocomput 2011; 165-76.
[18] James R. Cole, Qiong Wang, Jordan A. Fish, Benli Chai, Donna M. McGarrell, Yanni Sun, C. Titus Brown, Andrea Porras-Alfaro, Cheryl R. Kuske and James M. Tiedje Ribosomal Database Project: data and tools for high throughput rRNA analysis. Nucleic Acids Res. 2014 Jan 1; 42(Database issue): D633–D642.
Chapter 2
Outline of the Thesis
The main aim of this research project was the development of new bioinformatic algorithms and integrated tools to address several as-pects of NGS data analysis, with particular focus on three main areas: molecular diagnostics [1], denovo assembly of RNA-seq data [2] and application of denovo assembly to metagenomics [3].
The first part of this thesis is focused on two specific areas of molec-ular diagnostics, that are the identification of variants in gene panels and virus genotyping.
In both areas, variant calling - that is the process of aligning reads to a reference sequence in order to detect potential variants - repre-sents possibly the most critical step since quality of results is strongly depending on its ability to discriminate between real variants and se-quencing errors.
Many variant callers are available for research use, however they are not applicable to clinical routine environments since for diagnostic pur-poses the entire development process must be carried in compliance with strict requirements for achievement of proper certifications. Once variants are identified it is also important to annotate them with functional informations and to perform comparison with external re-sources to get most up-to-date clinical informations about their effects,
however to date this task is not trivial all because of the presence of multiple competing formats for variant nomenclature [4].
Moreover all these steps in clinical environment should be performed within a completely automatised procedure that does not require any manual intervention.
My contribution to this area was the the development of a robust pro-cedure for variant calling and annotation starting from NGS data and a module for automatic integration with external resources that trans-parently resolves issues caused by different nomenclature conventions. The procedure was extensively validated on both simulated and real clinical data and now constitutes the core of two integrated tools: Amplicon Suite and SmartVir.
Amplicon Suite is a user-friendly platform for variant calling and anno-tation on amplicon sequencing NGS data. Thanks to a collaboration with research group of Dr. Ettore Capoluongo of Policlinico Gemelli in Rome we were able to obtain CE-IVD certification for analysis of BRCA1 and BRCA2 genes, that are known to be involved in breast and ovarian cancer.
SmartVir was developed in collaboration with Roche Italian sequenc-ing team and easily allows to perform HCV genotypsequenc-ing and drug re-sistance detection in order to administer most appropriate treatment to infected patients.
These tools and obtained results will be presented in chapter 3. Currently available tools for denovo assembly of RNAseq data -such as Bridger [5], Oases [6] and Trinity [7] - share similar approaches (as they rely on the identification of k-mer sequences) and they achieve high levels of sensitivity at the expense of a consistent number of false positive reconstructions and very high hardware requirements.
As my MSc thesis project I contributed to the development of a new strategy for denovo transcriptome assembly that is based on an original approach where the whole reads are used to drive the assembly process
instead of considering only smaller k-mers with the aim of reducing the number of false positive reconstructions.
Preliminary results were encouraging, so part of my PhD projects was aimed towards its finalisation into STAble [8], that will be introduced in chapter 4.
Finally the last part of this thesis presents a contribution to metage-nomics, more specifically to the metatranscriptome assembly problem which is very actual while analysis procedures are still at an early stage.
Reconstruction of microbial transcripts from NGS datasets is actu-ally being performed by direct alignment of short reads to reference databases, however this is expected to cause many assignment ambi-guities during mapping process and it is possible to miss new unanno-tated transcripts.
My specific contribution was the tuning of STAble for assembly of transcripts from mixed populations (such as microbial communities), thus bringing the benefits of single organism denovo RNA-seq assem-bly to metatranscriptome studies. This extension will be presented in chapter 4 while future perspectives are discussed in chapter 5.
Bibliography
[1] L. Feliubadal´o, A. Lopez-Doriga, E. Castellsagu´e et al., Next-generation sequencing meets genetic diagnostics: Development of a comprehensive workflow for the analysis of BRCA1 and BRCA2 genes. European Journal of Human Genetics 2013; 21(8):864-70. [2] Gordon Robertson et al. De novo assembly and analysis of
RNA-seq data. Nature Methods 7, 2010; 909–912.
[3] Wooley JC, Godzik A, Friedberg I. A Primer on Metagenomics. PLoS Comput Biol 2010; 6(2): e1000667.
[4] Shuji Ogino, Margaret L. Gulley, Johan T. den Dunnen, Robert B. Wilson and the Association for Molecular Pathology Training and Education Committee. Standard Mutation Nomenclature in Molecular Diagnostics. J Mol Diagn. 2007 Feb; 9(1): 1–6.
[5] Chang Z, Li G, Liu J, Zhang Y, Ashby C, Liu D, Cramer CL, Huang X. Bridger: a new framework for de novo transcriptome assembly using RNA-seq data. Genome Biology 2015; 16:30. [6] Schulz MH, Zerbino DR, Vingron M, Birney E. Oases: robust de
novo RNA-seq assembly across the dynamic range of expression levels. Bioinformatics 2012; 28: 1086–1092.
[7] Grabherr MG, Haas BJ, Yassour M, Levin JZ, Thompson DA, Amit I, et al. Full-length transcriptome assembly from
RNA-Seq data without a reference genome. Nat Biotechnol. 2011; 29: 644–652.
[8] Igor Saggese, Giovanni Manzini and Flavio Mignone. STAble: a novel approach to denovo assembly of RNA-seq data. 13th Inter-national Meeting CIBB 2016; 2016 Sept 1-3; Stirling - UK.
Chapter 3
Analysis workflows for NGS
The advent of NGS techniques paved the road for new research areas and revolutionised many existing ones. Recent advancements allow us to sequence nucleic acids at increasingly high speeds and accuracy while lowering the cost per base.
Molecular diagnostics is a very actual area to which NGS has opened new frontiers: this name identifies a collection of techniques aimed at identifying specific markers in a patient’s genome and tran-scriptome and to analyse their effects on expressed proteins.
Current applications of NGS to this area are offering the perspec-tive of personalised medicine, with the possibility of modelling specific therapies for each person. However there are still open challenges -especially in the bioinformatics analysis side - that are delaying the integration of these techniques into routine clinical procedures and they are being applied only as a support to traditional ones.
Our contribution to molecular diagnostics is focused on two specific areas: identification of variants in gene panels and virus genotyping.
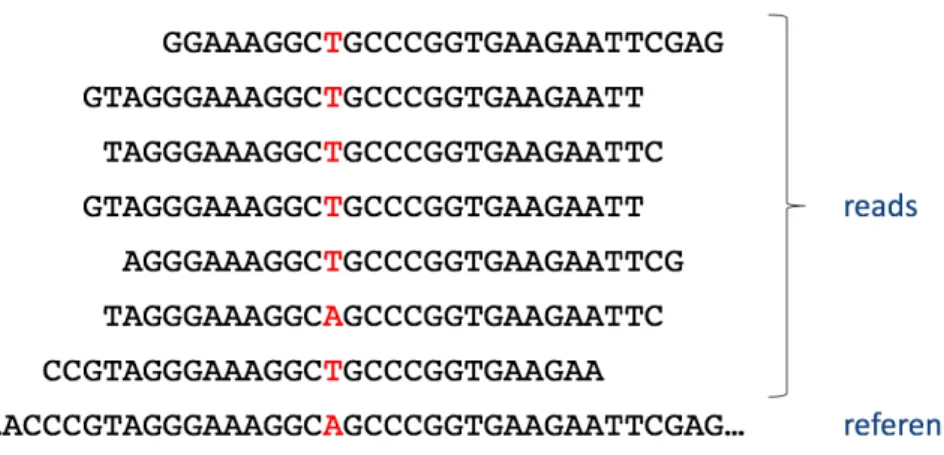
A strong variant calling mechanism is the core of most bioinfor-matics analysis procedures for molecular diagnostics: it allows the identification of nucleotide variants by aligning NGS reads to a refer-ence sequrefer-ence as shown in Figure 3.1.
Figure 3.1: Representation of variant calling process where short NGS reads are aligned to a reference sequence. In this example 6 out of 7 reads have a T instead of an A at the highlighted position, so there is a potential variant.
The main problem that must be taken into account in this process it the presence of sequencing errors: the accuracy of a variant calling mechanisms resides in its ability to discriminate between them and real variants by applying proper statistics.
The typical subsequent step is variant annotation that consists on as-signment of functional informations to detected variants: depending on their location they are likely to have a different impact on cell’s health. Variants in intronic regions might cause no visible effects, but when they alter splicing sites or coding sequences it is desirable to study them more in depth.
Finally, detected and annotated variants should be compared to ex-ternal resources, like databases and functional predictors, to get ad-ditional informations about their effects (such as if they are known to be linked to a particular pathology). Even though this task may look straight-forward at first glance, at present it is not trivial at all, mainly because of the lack of commonly agreed standards for variants nomenclature [1]. Human Genome Variation Society (HGVS) back in the year 2000 proposed its own recommendations [2]: despite they
have been widely adopted and are likely to become the international standard, to date there are still many resources that implement alter-native formats.
Given these premises, a new workflow that implements all these steps was developed and used as core for two integrated tools: Amplicon Suite and SmartVir.
Amplicon Suite is a platform for analysis of molecular diagnostics datasets that can be easily extended to work with all annotated genes. SmartVir was developed in collaboration with Roche Italian sequenc-ing team and performs fast and accurate HCV genotypsequenc-ing and drug resistance detection.
Both tools can be used through an intuitive graphical user interface (GUI) carefully designed to allow users with no specific bioinformatics skills to perform analyses autonomously.
The new pipeline will be introduced and then its specific implementa-tion into the two integrated tools will be discussed.
3.1
A new pipeline for variant calling and
annotation
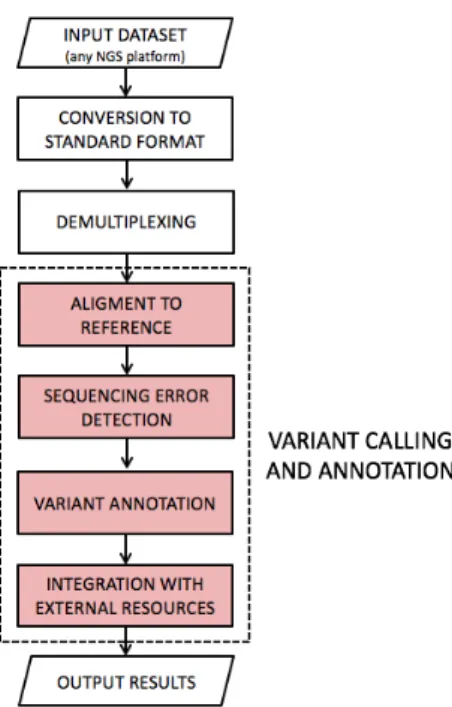
The new pipeline for variant calling and annotation is depicted in Figure 3.2: it expects raw NGS amplicon sequencing data as input and returns a set of detected and annotated variants.
3.1.1
Analysis profiles
The new pipeline is designed to be flexible and to work with NGS amplicon sequencing data from any annotated gene.
We defined an automated procedure for the creation of a proper pro-file that can be used to introduce support for new genes. A propro-file is composed by reference sequences to be used for alignment (NCBI
Ref-Figure 3.2: The new variant calling and annotation pipeline. Seq data [3]) and other informations required to complete all analysis steps. Most relevant informations involved are:
List of genes on which amplicons where designed. Primer sequences used for amplification.
List of transcripts related to target genes and their annotation. Informations about amplification and sequencing kit.
3.1.2
Alignment to reference
This module accepts a NGS amplicon sequencing dataset as input that is analysed in order to detect potential variants.
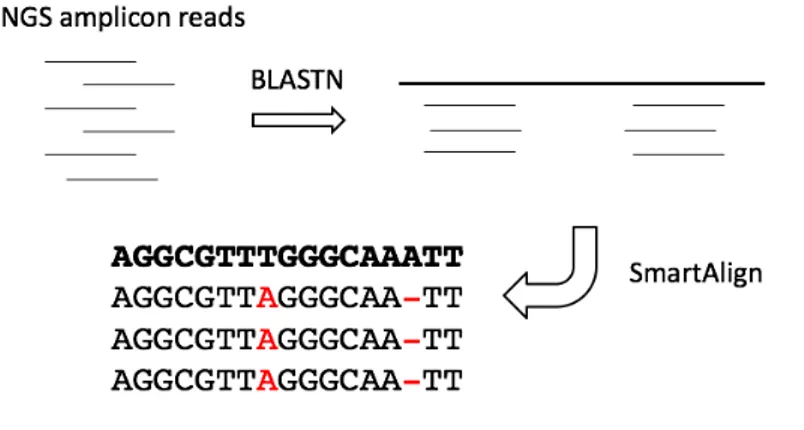
The procedure is depicted in Figure 3.3 and consists of two steps: 1. Detection of appropriate reference sequence and its sub-region. 2. Accurate alignment to sub-region for variant detection.
Figure 3.3: The two-step alignment procedure. Short reads are mapped to correct reference sequence using BLASTN and then are more accurately aligned to a specific region using SmartAlign.
In the first step reads are mapped to genes listed in analysis profile using BLASTN [4], similarity cutoff to adopt is parametric and should be carefully chosen depending on the specific application.
Afterwards each read is more accurately aligned to its mapping region using SmartAlign, a custom aligner developed by my research group that implements the Needleman-Wunsch dynamic programming algo-rithm [5], with penalty scores carefully tuned for NGS data.
We chose to develop our custom aligner to get full control of the situa-tion since, as shown in Figure 3.4, this step is critical: there might be multiple algorithmically correct alignments, however their biological meaning can be significantly different.
The final output of this step is the set of potential variants de-tected for each read, expressed in genomic absolute coordinates with the following notation:
<chr name>:<chr pos>:<nt ref>:<nt var>
chr name: name of the chromosome where the gene is located. chr pos: genomic start position.
Figure 3.4: Both alignments shown in the example are algorithmically correct but their biological meaning is very different. Alignment on the left implies an insertion and a deletion in the same read, which is an unlikely event. The one on the right involves a single substitution, which seems more reasonable from a biological perspective. However if we suppose that read is generated by Roche 454 platform, which has known issues with homopolymers, we can state with a good degree of confidence that alignment on the left is the correct one, but both variants are not real and have to be marked as sequencing errors.
nt ref: original allele from reference nt var: allele found in read.
This notation contains all required informations to unambiguously identify each variant, however it is just for internal use: there are mul-tiple plugins that before generating final output convert it to user’s preferred format, with particular emphasis on HGVS standards. Here are some examples of real variant names:
chr13:32930761:A:G (substitution of A with G) chr13:32900613:-:T (insertion of T)
chr17:41251858:T:- (deletion of T)
chr13:32906457:ACCACAT:--- (deletion of ACCACAT)
3.1.3
Sequencing error detection
This module filters variants reported by previous one by applying proper statistics with the aim of removing potential sequencing er-rors.
Figure 3.5: Hierarchy used by variant annotation module for classifi-cation.
Main parameters involved in filtering are the number of supporting reads and mean quality score of involved bases. Also a minimum cov-erage for target region is required.
Actual values for these thresholds must be chosen according to re-quirements of specific application.
3.1.4
Variant annotation
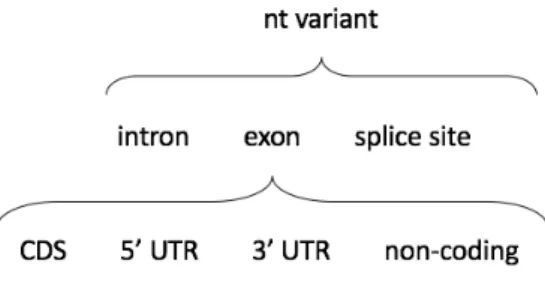
Variant annotation module classifies nucleotide variants according to their effect on expressed transcripts: classification hierarchy is de-picted in Figure 3.5.
There is a first grouping based on the involved region, that can be an intron, an exon or a splice site in the boundary between two of them. In case of intronic regions, the variant is just labeled that way and no further actions are taken, since it is not likely to produce any effect. When the variant modifies a splice site between an intron and an exon, a warning is raised and both the original and modified versions of the site will be reported as the situation needs to be carefully evaluated. Finally, in case of exonic regions there is an additional layer of classi-fication:
CDS: variant modifies an annotated coding region. 5’ UTR: variant modifies 5’ UTR region.
3’ UTR: variant modifies 3’ UTR region. non-coding: affected transcript is non-coding.
Nucleotide variants that affect a CDS are also annotated with their representation at amino-acid level:
p.<aa ref><aa pos><aa var>
aa ref: the original amino acid from the reference sequence. aa pos: amino acid position in the protein sequence.
aa var: the variated amino acid. Some examples of real variants:
p.K21S (substitution of K with S in position 21) p.L35del (deletion of L in position 35) p.15-16insV (insertion of V after position 15)
3.1.5
Integration with external resources
Interoperability with external dedicated resources is nowadays a very important feature, since it allows to get access to the latest discoveries from the scientific community.
Many widely used authoritative resources are available for molecu-lar diagnostics, from functional predictors for mutations to dedicated databases where knowledge about the effect of known variants resides. Unfortunately accessing them can be as important as tricky, mainly because universal standards for variant nomenclature are still far from being fully deployed. In addition, some databases do not explicitly state accession number and revision of the reference sequence used for annotation, so there is a considerable risk of performing the wrong comparisons.
To address this issue, the new pipeline is not designed around a par-ticular nomenclature but internally uses its own format for variant representation and implements multiple plugins that are able to per-form conversions to different per-formats when outputting data to the user, with particular attention to HGVS recommendations that are used as default.
The same plugins are also used to perform automatic integration with external resources, that can be queried by performing a name conver-sion from our internal format to the accepted one.
3.2
Amplicon Suite
Amplicon Suite is a user-friendly tool for variant calling and anno-tation from NGS amplicon sequencing data. It is designed to allow clinicians and researches to perform analyses autonomously without requiring specific bioinformatics skills.
It is based on the thin-client approach where the user can interact with the system through an intuitive graphical user interface, while the analysis core resides on a remote server. This architecture was chosen to deal with typical restrictions on hospital networks where personal computers may not be not powerful enough to run analysis process and strict policies about installed software are enforced. In addition, to address legal privacy issues it is also possible to install analysis core on a dedicated server connected to the local network, thus not requiring upload of data to remote hosts.
By setting up a proper profile it is possible to work with any anno-tated gene, however thanks to a collaboration with Policlinico Gemelli in Rome we had the opportunity to focus on the setup and tuning of a profile specific for analysis of variants on BRCA1 and BRCA2 genes, that are known to be involved in breast and ovarian cancer.
Figure 3.6: Amplicon Suite’s analysis workflow. Modules that imple-ment the new variant calling pipeline are highlighted in red.
variant calling pipeline.
Data input The user uploads a raw NGS dataset through an intu-itive graphical user interface and is asked to answer few simple ques-tions about the procedure used for sample preparation. Currently ac-cepted input formats are SFF files returned by Roche 454 and FASTQ files from Illumina and IonTorrent platforms.
Conversion to standard format Amplicon Suite is able to analyse datasets returned from the major sequencing platforms available and adding support for new ones is as simple as extending this module. Input is converted to a standardised format, that consists of a FASTA file with raw sequences and a QUAL file where quality scores annotated with Phred values [6].
by subsequent steps, such as used sequencing platform and its error model.
Demultiplexing Current NGS platform have a very high through-put that in most cases exceeds actual needs. Because of this, a common approach is to perform multiplexing and sequence multiple samples in a single run.
Specific multiplexing protocol employed varies depending on the se-quencing platform that will be used, however it is usually achieved by incorporating specific barcodes (that in Roche 454 environment are usually called MIDs) at the ends of amplified sequences. Every sam-ple is associated to a specific barcode so during analysis process it is possible to perform demultiplexing by detecting them.
In case of Illumina or IonTorrent datasets, sequencing output is al-ready demultiplexed and a separate FASTQ file for each sample is provided.
Conversely, for Roche 454 datasets MIDs at the ends of each read are detected and separate pairs of FASTA and QUAL files are generated for each sample.
Variant calling and annotation This macro-step consists of the implementation of the new pipeline. Demultiplexed reads are at first mapped to BRCA1 and BRCA2 references (NG 005905.2 and NG 012772.1) using BLASTN in order to perform assignment of each input sequence to the correct one.
SmartAlign is then applied to perform a more accurate alignment of each read to the mapping region to detect potential variants that are subsequently filtered for sequencing error removal and annotated over expressed transcripts.
Finally, integration module is currently implemented for 4 resources: Breast Cancer Information Core (BIC): an open access
online breast cancer mutation database [7].
dbSNP: the NCBI database of genetic variation [8].
SIFT: predictor for the effects of amino acid substitution on protein function [9].
Polyphen: predictor of functional effects of human nsSNPs [10]. Output results Results are reported to the user through the graph-ical user interface, in form of tables with detected variants and charts related to their frequencies and amplicon coverage.
Clinicians can review results and select which mutations are to appear in the final report, that can be saved in PDF format and printed.
3.2.1
Clinical validation
Amplicon Suite was clinically validated and CE-IVD certified for the analysis of BRCA1 and BRCA2 genes in collaboration with research group of Dr. Ettore Capoluongo of Policlinico Gemelli in Rome. Validation was performed by integration into the analysis workflow proposed in Figure 3.7, that describes a complete protocol (from sam-ple preparation to NGS data analysis) for routine analysis of BRCA full exome and exon-intron flanking regions.
The whole procedure is based on the use of a multiplex PCR strategy [11] (BRCA MASTR kit by Multiplicom [12]) that is able to generate DNA library, followed by 454 GS Junior pyrosequencing [13].
Due to technical limitations of pyrosequencing in deciphering homopoly-mer stretches [14], a specific validated pre-NGS quality control step based on fragment analysis [15] that is able to evaluate quality of PCR multiplex and identify small indels in coding regions has been setup. The whole procedure is documented in [16], however here we’ll focus on bioinformatics analysis step.
Figure 3.7: Integrated NGS workflow used for validation of Amplicon Suite (image from [16]).
Validation method
Validation was performed on 220 samples from women that were di-agnosed as sporadic and/or familial ovarian cancer patient.
Genomic DNA was isolated from peripheral blood by a method based on a commercial kit distributed by Roche Diagnostics.
Samples were then PCR-enriched using Multiplicom BRCA MASTR Dx assay v2.0, that covers all the coding regions and splice sites of BRCA genes with 93 amplicons per patient.
Sequencing was performed on GS Junior platform (23 runs in total) with GS Junior Titanium Sequencing Kit in combination with the matching GS Junior Titanium PicoTiterPlate (PTP).
The first 10 runs (80 samples in total) were analysed with both Am-plicon Variant Analyzer (AVA) and AmAm-plicon Suite, in order to allow validation of the new software, while the remaining 13 were analysed primarily with Amplicon Suite and only subsequently with AVA. AVA is part of the software suite distributed by Roche Diagnostics with every GS sequencing platform and is specifically designed for analysis of amplicon sequencing experiments, however it has some important limitations. Noteworthy, advanced coverage analysis is of primary im-portance in diagnostic setting, but it cannot be achieved by using AVA and data is not stored in a structured way (e.g. flat files instead of a database) not allowing to easily compare results of different runs and to create for instance an historic database of all variants of interest that were detected. Moreover the process of creation of a new analysis project can be tricky for a user with no specific bioinformatic skills and automatic integration of external resources is not provided: Amplicon Suite was specifically designed around user requests to overcome all these issues.
Reference sequences NG 005905.2 (BRCA1) and NG 012772.1 (BRCA2) were used for alignment and results were confirmed by sequencing all samples also with Sanger, that is actually considered as the golden
standard for these applications.
Analysis results have been compared against most relevant databases for clinical use: dbSNP [8], BIC [7], LOVD 1, UMD 2, AURP 3 and HGMD [17].
Evaluation of amplicon coverage
The first task was the evaluation of amplicon coverage for each pa-tient. Two threshold values were established: 30x and 38x that were arbitrarily defined as alert and enhanced level.
In literature 30x is actually considered as the minimum acceptable coverage for genomic clinical studies [18], while in the setup pipeline 38x indicates an optimised performance level.
Table 3.1 reports obtained results by Amplicon Suite for whole ampli-con coverage that indicates the number of patients for which at least the threshold values of 30x or 38x are overcome in all 93 amplicons. This information was extremely useful to tune analysis protocol: data shows that the performance of amplicons not reaching fixed coverages did not depend on the number of samples loaded in each run, since with 13 samples per run the number of amplicons that failed the target values decreased.
Indel identification by fragment analysis
Given the known limitations of pyrosequencing in deciphering ho-mopolymer stretches, indel identification was performed separately by fragment analysis based on Multiplex ligation-dependent probe ampli-fication (MLPA) [19], which is a variation of the multiplex polymerase chain reaction that permits amplification of multiple targets with only a single primer pair and it is widely used to determine relative ploidy.
1http://www.lovd.nl/3.0/home/ 2http://www.umd.be/
Table 3.1: Whole amplicon coverage values reported by Amplicon Suite (data from [16]).
Subjects
per run # of runs Subjects (%)
Alert level > 30x Enhanced level > 38x 8 15 120 (54) 87 (73) 74 (62) 11 1 11 (5) 5 (46) 6 (55) 12 2 24 (11) 13 (54) 12 (50) 13 5 65 (30) 53 (82) 28 (43) Total 23 220 (100) 158 (72) 120 (55)
Probes are designed to target genes of interest and their signal strengths are compared with those obtained from a reference DNA known to have two copies of the chromosome. If an extra copy is present in the test sample, the signals are expected to be 1.5 times the intensities of the respective probes from the reference. If only one copy is present the proportion is expected to be 0.5. If the sample has two copies, the relative probe strengths are expected to be equal.
Results from Table 3.2 show that 31 out of 212 samples resulted pos-itive in this test and also gives an insight about the complexity of implementing automatic integration with external resources: in this list, nomenclature for the same variant is very different between HGVS recommendations and BIC annotation.
Since the presence of two deleterious mutations is a very rare event in BRCA genes, these samples were not sequenced by NGS, but imme-diately sequenced by targeted Sanger: perfect concordance between fragment analysis and Sanger for all the prescreened indels was ob-tained.
In addition the accuracy of Amplicon Suite has been confirmed since it reported no further indels for those samples that resulted negative to this test and were processed with NGS.
T able 3.2: List of 21 indels found in 31 patien ts b y fragmen t analysis b efore NGS run (data from [16]). # of carriers Gene Exon HGVS n ucleotide BIC n ucleotide HGVS protein dbSNP Clinical imp ortance BIC LO VD UMD A U R P HGMD Extra 1 BR CA1 2 c.66 67delA G 185delA G p.L22 E23L Vfs 80357713 Y es -Y es Breast cancer -1 BR CA1 11 c.843 846delCTCA 962delCTCA p.S281 S282?fs 80357919 Y es -Y es Y es Breast cancer -1 BR CA1 11 c.850 851insTCA TT A C 969insTCA TT A C p.Q284?fs 80357989 Y es -Breast cancer -1 BR CA1 11 c.1898 1899insTT AA GCC CA CAAA T 2017insTT AA G CCCA CAAA T p.P634Qfs -No v el 1 BR CA1 11 c.1961 1961delA 2080delA p.K654Sfs 80357522 Y es -Y es Y es Breast cancer -1 BR CA1 11 c.2269 2269delG 2388delG p.V757F?fs 80327583 Y es -Y es Y es Breast cancer -1 BR CA1 11 c.3173 3176delT AA T 3192delT AA T p.I1058Mfs -No v el 3 BR CA1 11 c.3756 3759delGTCT 3875delGTCT p.S1253Rfs 80357868 Y es -Y es Y es Breast cancer -1 BR CA1 12 c.4165 4166delA G 4284delA G p.S1389X 80357572 Y es -Y es Y es Breast cancer -1 BR CA1 17 c.5062 5064delGTT 5181delGTT p.V1688del 80358344 Y es Y es Y es Y es Breast and/or o v arian cancer -7 BR CA1 20 c.5263 5264insC 5382insC p.S1755?fs 80357906 Y es Y es Y es -2 BR CA2 10 c.1238 1238delT 1466delT p.L413Hfs 80359271 Y es -Y es Breast and/or o v arian cancer -1 BR CA2 10 c.1796 1800delTTT A T 2024delTTT A T p.S599 Y600?fs -Y es -1 BR CA2 11 c.3192 3195delAA TT 3420delAA TT p.Ser1064 Ile1065?fs 80359375 -1 BR CA2 11 c.3683 3684insG 3911insG p.Asn1228K?fs -No v el 2 BR CA2 11 c.3744 3747delTGA G 3972delTGA G p.S1248Rfs 80359403 Y es -Y es Y es Breast and/or o v arian cancer -1 BR CA2 11 c.4282 4283insT 4510insT p.F1428?fs 80359439 Y es -Y es -1 BR CA2 11 c.6313 6313delA 6541delA p.I2105?fs 80359439 -No v el 1 BR CA2 15 c.7498 7498delA 7726delA p.R2500?fs -No v el 1 BR CA2 19 c.8463 8464insT 8691insT p.I2822Tfs -Y es -1 BR CA2 25 c.9413 9414insT 9641insT p.L3138Ffs -Y es
-T able 3.3: BR CA deleterious m utations iden tified b y NGS and confir med b y targeted Sanger sequencing (data from [16]). # of carriers Gene Exon HGVS n ucleotide BIC n ucleotide HGVS prot ei n dbSNP Clinical imp ortance BIC LO VD UMD A URP HGMD 2 BR CA1 5 c. 181 T > G 300 T > G p.C61G 28897672 Y es -Y es Y es Breast cancer 1 BR CA1 11 c. 3257 T > G 3376 T > G p.L1086X 80357006 Y es -Y es Y es Breast cancer 1 BR CA1 11 c. 3514 G > T 3633 G > T p.E1172X -Y es Breast and/or o v arian cancer 1 BR CA1 12 c. 4117 G > T 4236 G > T p.E1373X 80357259 Y es Y es Y es Y es Ov arian cancer 1 BR CA1 13 c. 4258 C > T 4377 C > T p.Q1420X 80357305 Y es -Y es Y es Breast cancer 1 BR CA1 18 c. 5123 C > A 5242 C > A p.A1708E 28897696 Y es Y es Y es Y es Breast cancer 1 BR CA1 19 c. 5161 C > T 5280 C > T p.Q1721X -Y es Y es -3 BR CA2 IVS10 c. 1909 + 1 G > A 2137 + 1 G > A -Y es -1 BR CA2 16 c. 7681 C > T 7909 G > T p.Q2561X 80358994 Y es -1 BR CA2 17 c. 7857 G > A 8085 G > A p.W2619X 80359011 Y es -Y es Breast and/or o v arian cancer
Table 3.4: VUS identified by NGS and confirmed by targeted Sanger sequencing (data from [16]).
# of carriers Gene Exon HGVS nucleotide BIC nucleotide HGVS protein
1 BRCA1 11 c.804C > G 923C > G p.N268K
1 BRCA1 11 c.2501G > A 2620G > A p.G834E
1 BRCA1 11 c.3868A > G 3987A > G p.K1290E
1 BRCA1 14 c.4361T > C 4480T > C p.V1454A
1 BRCA1 17 c.5058T > A 5177T > A p.H1686Q
1 BRCA2 10 c.1444C > T 1672C > T p.L482F
1 BRCA2 25 c.9383C > T 9601C > T p.L3125F
Detection of mutations with NGS
All samples that resulted negative to the fragment test where se-quenced with GS Junior platform and results compared against refer-ence clinical databases (integration with BIC and dbSNP was auto-matically performed by Amplicon Suite, while for the other resources results were manually compared).
Detected variants and mutations are are subdivided into 3 main groups according to their clinical relevance:
Deleterious mutations: mutations that are known to pro-duce harmful effects.
Variants of uncertain significance (VUS): novel mutations or variants for which informations included in different databases were discordant regarding the pathogenic effect at both biologi-cal and clinibiologi-cal level.
Variants of no significance: synonymous SNPs or missenses that all interrogated databases concordantly classified as not pro-ducing noteworthy effects.
Among 181 samples analysed by NGS, 10 different deleterious mu-tations (see Table 3.3) were found in 13, including 7 BRCA1 mumu-tations
(5 nonsense and 2 missense) and 3 BRCA2 mutations (2 nonsense and 1 missense).
VUS were detected in 7 patients and are reported In Table 3.4. One patient carried the p.K1290E along with the deleterious BRCA2 exon 20 deletion, while the remaining ones were identified in women not carrying other deleterious mutations.
Finally, 55 synonymous and missense SNPs were found: 25 and 32 in BRCA1 and BRCA2 genes, respectively. The exhaustive list will not be reported here but is available in [16].
Most importantly, all mutations reported by Amplicon Suite were con-firmed by targeted Sanger sequencing, demonstrating that it is possible to apply it for routine clinical analysis of BRCA mutations.
3.3
SmartVir
NGS techniques allow mass sequencing of viral genome, providing the opportunity to probe viral population from a single host.
There is a growing interest in these applications for both research and clinical purposes, however dedicated resources - such as databases with reference genotypes and drug resistance related mutations - are still fragmented, making the creation of an integrated solution for routine analysis not trivial at all.
As our contribution to this field we developed SmartVir, a user-friendly integrated tool for virus genotyping and drug resistance de-tection. Like Amplicon Suite it is designed to be generic and to work with many viral species, however within a collaboration with Roche Italian Sequencing team we focused on the creation of a profile for the treatment of HCV infections.
Analysis workflow is depicted in Figure 3.8: it shares some modules with Amplicon Suite (input dataset, conversion to standard format and demultiplexing) and it is also based on the new variant calling
Figure 3.8: SmartVir’s analysis workflow.
pipeline.
Genotyping This module performs genotyping of each sample in order to detect which strain (or strains in case of mixed infections) is affecting the patient.
Applied technique is the one introduced in [20] that allows discrim-ination between the first six genotypes (1, 1a, 1b, 2, 3, 4, 5 and 6) without ambiguities.
Reads from each sample are aligned using BLASTN to references of all genotypes but only alignments that span over a specific 250-bp area in NS3 (position 701-950), NS5A (position 1-250) and NS5B (position 101-350) regions are retained. Assigned genotype is the one that shows the best matches against all these three sub-regions.
Variant calling and annotation Reads for each sample are sub-jected to the two-step alignment process: they are first mapped to the
correct region of the assigned reference using BLASTN and then are accurately aligned with SmartAlign for variant detection.
Detection of mutations in viral genome represents an important step towards the choice of the most appropriate treatment.
Drug resistance detection This module implements automatic in-tegration with external resources in order to verify if mutations de-tected in viral genome are known to cause resistance to certain drugs. Databases that are currently used as reference are Geno2Pheno [21] (a web-based decision support system for HCV treatment) and the list of clinically relevant mutations reviewed in [22] that we informally named Lontok.
Output results Detected mutations and drug resistances are avail-able in form of tavail-ables through the user interface alongside other in-formations about the quality of the sequencing run (e.g. amplicon coverage and number of reads for sample). It is also possible to export and print a report with a summary of relevant mutations found for each patient.
3.3.1
Results
SmartVir was validated in collaboration with Roche Italian sequenc-ing team startsequenc-ing from a set of 40 HCV samples subdivided in 4 GS Junior runs (10 samples per run).
Sequencing kit is developed by Roche and targets NS3, NS5A and NS5B regions for genotypes 1a, 1b and 3a (which are the most preva-lent strains worldwide [23]) over 27 total amplicons.
NS3 is a multifunctional protein with both serine protease and RNA helicase/NTPase activities, NS5A is a phosphoprotein which takes part in virus particle formation and is involved in virus resistance against interferons [24] and NS5B protein encodes for an RNA-dependent
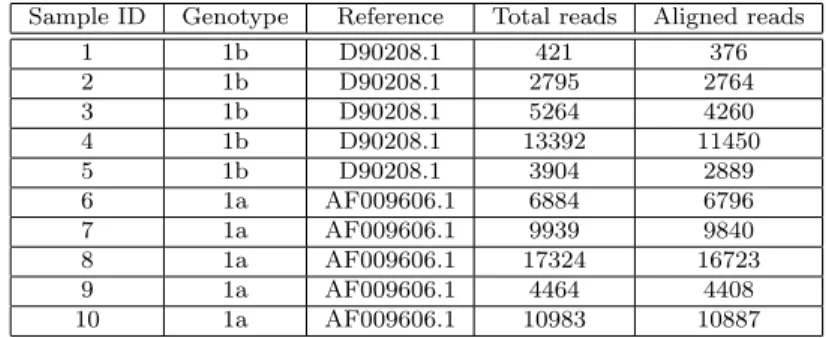
Table 3.5: Demultiplexing and genotyping report for HCV test run.
Sample ID Genotype Reference Total reads Aligned reads
1 1b D90208.1 421 376 2 1b D90208.1 2795 2764 3 1b D90208.1 5264 4260 4 1b D90208.1 13392 11450 5 1b D90208.1 3904 2889 6 1a AF009606.1 6884 6796 7 1a AF009606.1 9939 9840 8 1a AF009606.1 17324 16723 9 1a AF009606.1 4464 4408 10 1a AF009606.1 10983 10887
RNA polymerase (RdRp), which is the central catalytic enzyme of the HCV replicase [25, 26].
Results for one of validation runs will be presented.
Table 3.5 reports genotype and reference sequence automatically as-signed by SmartVir for each sample alongside alignment statistics (in terms of total reads and reads successfully aligned to reference). Sam-ple 1 has a very low read count and SmartVir immediately raised a warning about this, informing the user that not enough data is avail-able to produce reliavail-able results (it was later confirmed that sample was sent to sequencing despite some amplification problems have oc-curred).
After quality control check and genotype assignment, SmartVir proceeds to detect mutations on viral genome and automatically com-pare them to external resources (as already mentioned Geno2Pheno [21] and Lontok [22] are currently integrated) in order to determine possible drug resistances. Samples 1, 9 and 10 resulted in a negative outcome, while drug resistance associated mutations where detected for all the others over NS3 regions (see Table 3.6).
Table 3.6: Drug resistance associated mutations detected by SmartVir.
Sample
ID Region Mutation Read count
Total
coverage Frequency Geno2Pheno Lontok
2 NS3 S122N 22 1187 1.9% - Asunaprevir 3 NS3 S122T 53 3360 1.6% - Asunaprevir Simeprevir 4 NS3 D168E 376 6850 5.5% Asunaprevir Grazoprevir Paritaprevir Simeprevir Asunaprevir Simeprevir Vaniprevir 5 NS3 S122N 6 2959 0.2% - Asunaprevir 5 NS3 R117H 6 2959 0.2% Telaprevir -6 NS3 F43L 24 3971 0.6% Paritaprevir -6 NS3 S122R 23 2912 0.8% Simeprevir Simeprevir 6 NS3 R117H 6 2912 0.2% Telaprevir -7 NS3 F43L 4173 4296 97.1% Paritaprevir -7 NS3 S122R 75 5640 1.3% Simeprevir Simeprevir 8 NS3 Q80H 4352 4441 98.0% Simeprevir
-Bibliography
[1] Shuji Ogino, Margaret L. Gulley, Johan T. den Dunnen, Robert B. Wilson and the Association for Molecular Pathology Training and Education Committee. Standard Mutation Nomenclature in Molecular Diagnostics. J Mol Diagn. 2007 Feb; 9(1): 1–6.
[2] den Dunnen JT, Dalgleish R, Maglott DR, Hart RK, Greenblatt MS, McGowan-Jordan J, Roux AF, Smith T, Antonarakis SE, Taschner PE. HGVS Recommendations for the Description of Se-quence Variants: 2016 Update. Hum Mutat. 2016 Jun; 37(6): 564-9.
[3] O’Leary NA, Wright MW, Brister JR, Ciufo S, Haddad D, McVeigh R, Rajput B, Robbertse B, Smith-White B, Ako-Adjei D, Astashyn A, Badretdin A, Bao Y, Blinkova O, Brover V, Chetvernin V, Choi J, Cox E, Ermolaeva O, Farrell CM, Goldfarb T, Gupta T, Haft D, Hatcher E, Hlavina W, Joardar VS, Kodali VK, Li W, Maglott D, Masterson P, McGarvey KM, Murphy MR, O’Neill K, Pujar S, Rangwala SH, Rausch D, Riddick LD, Schoch C, Shkeda A, Storz SS, Sun H, Thibaud-Nissen F, Tolstoy I, Tully RE, Vatsan AR, Wallin C, Webb D, Wu W, Landrum MJ, Kim-chi A, Tatusova T, DiCuccio M, Kitts P, Murphy TD, Pruitt KD. Reference sequence (RefSeq) database at NCBI: current status, tax-onomic expansion, and functional annotation. Nucleic Acids Res. 2016 Jan 4; 44(D1):D733-45.
[4] Altschul SF, Gish W, Miller W, Myers EW, Lipman DJ. Basic local alignment search tool. J Mol Biol. 1990 Oct 5; 215(3):403-10. [5] Saul B. Needleman, Christian D. Wunsch. A general method ap-plicable to the search for similarities in the amino acid sequence of two proteins. Journal of Molecular Biology 1970; 48 (3): 443–53. [6] Ewing B, Hillier L, Wendl MC, Green P. Base-calling of automated
sequencer traces using phred. I. Accuracy assessment. Genome re-search 1998; 8 (3): 175–185.
[7] Szabo C, Masiello A, Ryan JF, Brody LC. The breast cancer in-formation core: database design, structure, and scope. Hum Mutat 2000; 16(2):123-31.
[8] S. T. Sherry, M.-H. Ward, M. Kholodov, J. Baker, L. Phan, E. M. Smigielski and K. Sirotkin. dbSNP: the NCBI database of genetic variation. Nucleic Acids Res. 2001 Jan 1; 29(1): 308–311.
[9] Ng PC, Henikoff S. Predicting deleterious amino acid substitutions. Genome Res. 2001 May; 11(5):863-74.
[10] Ivan Adzhubei, Daniel M. Jordan, and Shamil R. Sunyaev. Pre-dicting Functional Effect of Human Missense Mutations Using PolyPhen-2. Curr Protoc Hum Genet. 2013 Jan; 0 7: Unit7.20. [11] Markoulatos P, Siafakas N, Moncany M. Multiplex
poly-merase chain reaction: a practical approach. J Clin Lab Anal. 2002;16(1):47-51.
[12] Badoer C, Garrec C, Goossens D, Ellison G, Mills J, Dzial M, El Housni H, Berwouts S, Concolino P, Guibert-Le Guevellou V, Delnatte C, Del Favero J, Capoluongo E, B´ezieau S. Performance of multiplicom’s BRCA MASTR Dx kit on the detection of BRCA1
and BRCA2 mutations in fresh frozen ovarian and breast tumor samples. Oncotarget. 2016 Oct 25.
[13] Harrington CT, Lin EI, Olson MT, Eshleman JR. Fundamentals of pyrosequencing. Arch Pathol Lab Med. 2013 Sep;137(9):1296-303.
[14] Susan M Huse, Julie A Huber, Hilary G Morrison, Mitchell L Sogin and David Mark Welch. Accuracy and quality of massively parallel DNA pyrosequencing. Genome Biol. 2007; 8(7): R143. [15] Concolino P, Costella A, Minucci A, et al. A preliminary Quality
Control (QC) for next generation sequencing (NGS) library eval-uation turns out to be a very useful tool for a rapid detection of BRCA1/2 deleterious mutations. Clin Chim Acta 2014; 437:72-7 [16] Minucci A, Scambia G, Santonocito C, Concolino P, Canu G,
Mignone F, Saggese I, Guarino D, Costella A, Molinario R, De Bonis M, Ferrandina G, Petrillo M, Scaglione GL, Capoluongo E. Clinical impact on ovarian cancer patients of massive paral-lel sequencing for BRCA mutation detection: the experience at Gemelli hospital and a literature review. Expert Rev Mol Diagn. 2015; 15(10):1383-403.
[17] Stenson PD, Mort M, Ball EV, Shaw K, Phillips A, Cooper DN. The Human Gene Mutation Database: building a comprehensive mutation repository for clinical and molecular genetics, diagnos-tic testing and personalized genomic medicine. Hum Genet. 2014 Jan;133(1):1-9.
[18] Rehm HL, Bale SJ, Bayrak-Toydemir P. et al. ACMG clinical laboratory standards for next-generation sequencing. Genet Med 2015;15(9):733-47.
[19] Schouten JP, McElgunn CJ, Waaijer R, Zwijnenburg D, Diepvens F, Pals G. Relative quantification of 40 nucleic acid sequences by multiplex ligation-dependent probe amplification. Nucleic Acids Res. 2002; 30(12):e57.
[20] Qiu P, Stevens R, Wei B, Lahser F, Howe AYM, et al. HCV Geno-typing from NGS Short Reads and Its Application in Genotype De-tection from HCV Mixed Infected Plasma. PLOS ONE 2015; 10(4): e0122082.
[21] Prabhav Kalaghatgi, Anna Maria Sikorski, Elena Knops, Daniel Rupp, Saleta Sierra, Eva Heger, Maria Neumann-Fraune, Bastian Beggel, Andreas Walker, J¨org Timm, Hauke Walter, Martin Ober-meier, Rolf Kaiser, Ralf Bartenschlager and Thomas Lengauer. Geno2pheno[HCV] – A Web-based Interpretation System to Sup-port Hepatitis C Treatment Decisions in the Era of Direct-Acting Antiviral Agents. PLoS One 2016; 11(5): e0155869.
[22] Lontok E, Harrington P, Howe A, Kieffer T, Lennerstrand J, Lenz O, McPhee F, Mo H, Parkin N, Pilot-Matias T, Miller V. Hepatitis C virus drug resistance-associated substitutions: State of the art summary. Hepatology. 2015 Nov; 62(5):1623-32.
[23] Jane P Messina, Isla Humphreys, Abraham Flaxman, Anthony Brown, Graham S Cooke, Oliver G Pybus, and Eleanor Barnes. Global Distribution and Prevalence of Hepatitis C Virus Genotypes. Hepatology. 2015 Jan; 61(1): 77–87.
[24] Tellinghuisen TL, Foss KL, Treadaway J. Regulation of hepatitis C virion production via phosphorylation of the NS5A protein. PLoS Pathog 2008; 4: e1000032.
[25] Bartenschlager R, Lohmann V, Replication of hepatitis C virus. J Gen Virol 2000; 81:1631-1648.
[26] Lohmann V, Roos A, Korner F, Koch JO, Bartenschlager R. Bio-chemical and structural analysis of the NS5B RNA-dependent RNA polymerase of the hepatitis C virus. J Viral Hepat 2000; 7:167-174.
Chapter 4
Algorithms for NGS
RNA-seq is a set of powerful techniques that allow to characterise metabolic activity of a biological sample by sequencing all of its mRNA [1].
Unfortunately, as seen in chapter 1 the output of a NGS sequencing platform is a vast set of short reads that have to be properly assembled in order to reconstruct original transcripts.
When high quality reference sequences are available for the organism that is object of study, reconstruction can be performed by alignment to reference genome for which many efficient and accurate solutions are available.
In case references are unavailable denovo assembly [2] has to be ap-plied: reads are assembled blindly in order to reconstruct transcripts. Currently available tools for denovo assembly of RNAseq data -such as Bridger [3], Oases [4] and Trinity [5] - achieve high levels of sensitivity and share a similar approach as they rely on the identifica-tion of k-mer sequences. Bridger then uses this informaidentifica-tion to build and traverse splicing graphs [6], while Oases and Trinity rely on De-Bruijn graphs [7].
Despite the good sensitivity, they all show two main limitations that will be further discussed with results:
High number of false positive reconstructions
Very high demands in term of hardware requirements
When working with real data, in absence of any reference it is not trivial - and maybe not even possibile - to determine the correctness of a reconstruction, so applying methods that are likely to produce many false positives can lead to production of unreliable results. Furthermore current approaches are very demanding in terms of hard-ware requirements: this can be a serious limitation, especially in the case of smaller laboratories where dedicated computing infrastructures are not available.
To overcome these limitations we developed STAble [8], a new denovo assembler for RNA-seq data that is built around an original approach: the whole reads are used to drive the alignment process instead of considering only smaller k-mers with the aim of reducing the number of false positive reconstructions.
False positive matter was our primary concern, however it is desirable to achieve a sensitivity at least comparable to existing tools.
Moreover we designed it to be parallelizable, allowing to to split the as-sembly process into smaller subtasks that can be processed in parallel even in absence of dedicated computing infrastructures.
STAble’s performances were initially compared with other tools on many simulated and real RNA-seq datasets, but given the growing interest on metagenomics analysis we also explored the possibility of applying it for the assembly of metatranscriptome.
Metatranscriptome studies are still at an early stage and identification of expressed transcripts is usually accomplished by alignment of short reads (obtained by Whole-Transcriptome shotgun sequencing (WTSS) [9] as for RNA-seq) to databases of annotated bacterial transcripts, that are later mapped to known metabolic pathways in order to char-acterise metabolic activity.
Figure 4.1: STAble’s assembly workflow.
This approach is however expected, given to short length of reads, to produce many assignment ambiguities and novel unannotated tran-scripts can be missed.
For these reasons we decided to tune STAble for this application: pre-liminary results are presented in section 4.2.
4.1
STAble
STAble’s assembly workflow consists of three modules as depicted in Figure 4.1.
The first step is the efficient detection of potential head-tail align-ments between reads, possibly with mismatches: ideally if two reads show an head-tail overlap with a good score they can be assembled into a longer contig.
Second module uses reported alignments to build an unweighted di-rected graph which is traversed by a custom algorithm that takes into account biological properties of input data.
Finally the third one applies some post-processing operations to re-sults.
Core analysis modules are implemented in C while the rest of the pipeline is written in Perl.
4.1.1
Head-tail alignments detection
The first module starts from a FASTQ file with raw sequencer output on alphabet ACGTN and returns a list of triples [i, j, k] where:
i and j represent two reads. k is an integer number.
The tail of i (that is i[k...len(i)]) has a good overlap with the head of j (that is j[1...(len(i) − k + 1)]).
Given this definition, it is vital to explain what is considered to be a good overlap, a concept that must take into account biological properties of input data.
From a pure computer science perspective there are two main ap-proaches to string alignment:
Exact alignment: a potential alignment is valid only if edit distance is 0.
Alignment with errors: alignment is valid if edit distance is included between 0 and a threshold t.
For this specific application the presence of errors must be tolerated to deal with possible sequencing errors. More formally, an head-tail alignment is reported as valid only if it satisfies the following condi-tions:
Figure 4.2: The graph on the left represents a situation where se-quence A can be extended with B, C and D. Due to high sequencing depths the existence of A1 and A2 that are very similar to A is highly probable. If a maximum overlap length is not set, the situation on the right is likely to occur: the graph will contain many paths that will complicate its structure but do not contribute with meaningful informations.
2. Overlap length is included in interval [min len, max len].
The first condition trivially ensures the goodness of the alignment score: for increased efficiency only mismatches are considered.
A minimum length for the overlap is required to avoid alignments po-tentially caused by casual similarities. This is particularly important for dealing with low complexity and repeated regions that are likely to produce many chimeric contigs if too short overlaps are accepted. Similarly a maximum length must be set to deal with redundancy of information caused by high sequencing depths: an alignment caused by an excessive overlap will generate a contig just a little longer than a single read, while there are good chances that the same reads can gen-erate more informative alignments elsewhere. In addition this thresh-old helps to reduce the number of arcs in the graph built by the second module, preventing the formation of alternative paths that represent unessential variants of the same transcripts as shown in Figure 4.2. Always referring to the same figure it is important to point out that even if alignments between A, A1 and A2 are prevented, their tails still align with the same sequences: to address this, when a too simi-lar sequence is detected it is discarded.
In addition there is also a limit to the number of alignments a single read can contribute to on both head and tail. The heuristic is that if alignment [i, j, k] is discarded because read i was used too many times, it is highly probable that a very similar read i0 exists and makes the alignment [i0, j, k0] valid too. Without this limitation, for each alignment [i, j, k] and a generic pair of sequences i0 and j0 (very similar to i and j) any possible combination such as [i0, j, k0], [i, j0, k00] and [i0, j0, k000] is likely to be considered, but once again this would just result in a more complex graph without additional benefits.
The proposed algorithm for head-tail alignment detection will now be examined, starting with the definition of keywords, parameters and data structures involved.
Keywords
Anchor A k-mer used to start an alignment, whose length is defined by an input parameter. An anchor is valid only if it contains all four nucleotides, in order to filter low complexity regions.
Parameters
anchor size Length of the anchors expressed in nucleotides (default: 11).
anchor scope Maximum number of anchors for each sequence to consider for starting alignment. Its meaning will become more clear during algorithm presentation (default: 5).
max mismatches Maximum number of mismatches allowed (de-fault: 10% of overlap length).
min overlap len Minimum length allowed for overlaps (default: 20% of longer sequence1).
max overlap len Maximum length allowed for overlaps (default: 90% of shorter sequence).
max align before Maximum number of alignments the head of a sequence can contribute to (default: 5).
max align after Maximum number of alignments the tail of a se-quence can contribute to (default: 5).
Data structures
Anchor index This is the main data structure for this module, depicted in Figure 4.3. It is implemented as an array whose indexes range across binary representations of all possible anchors and is used to keep record of all occurrences of each anchor in input reads. Lists of occurrences are implemented as dynamically allocated linked lists, since a sequential visit is required by the algorithm. Each list entry contains an integer identifier for the sequence and the offset of the occurrence relative to its start.
Algorithm description
The pseudocode of the main procedure - informally named SeqAlign - is represented in Algorithm 1. Computation starts by recoding in-put FASTQ from 8-bit ASCII characters to a 2-bit alphabet as shown in Figure 4.4: this will allow to reduce memory consumption and to speed up subsequent operations.
No special symbol is assigned to ambiguous bases - such as N - but the
1RNA-seq reads are expected to have all the same length, however the algorithm
Figure 4.3: Representation of the anchor index data structure for an-chor size=6, supposing that each base is encoded with a 2-bit simbol: A=00, C=01, G=10, T=11.
Figure 4.4: Encoding of input FASTQ on a 2-bit symbols alphabet. Ambiguous bases are encoded with the same symbol reserved for C.
![Figure 3.2: The new variant calling and annotation pipeline. Seq data [3]) and other informations required to complete all analysis steps](https://thumb-eu.123doks.com/thumbv2/123dokorg/4801906.49362/26.748.305.440.105.431/figure-variant-annotation-pipeline-informations-required-complete-analysis.webp)
![Figure 3.7: Integrated NGS workflow used for validation of Amplicon Suite (image from [16]).](https://thumb-eu.123doks.com/thumbv2/123dokorg/4801906.49362/35.748.109.640.301.698/figure-integrated-ngs-workflow-validation-amplicon-suite-image.webp)
![Table 3.1: Whole amplicon coverage values reported by Amplicon Suite (data from [16]).](https://thumb-eu.123doks.com/thumbv2/123dokorg/4801906.49362/38.748.170.579.194.308/table-amplicon-coverage-values-reported-amplicon-suite-data.webp)
![Table 3.4: VUS identified by NGS and confirmed by targeted Sanger sequencing (data from [16]).](https://thumb-eu.123doks.com/thumbv2/123dokorg/4801906.49362/41.748.118.631.194.319/table-vus-identified-ngs-confirmed-targeted-sanger-sequencing.webp)