Contents lists available atScienceDirect
Engineering Geology
journal homepage:www.elsevier.com/locate/enggeo
Site e
ffects and widespread susceptibility to permanent coseismic
deformation in the Avezzano town (Fucino basin, Central Italy): Constraints
from detailed geological study
Deborah Di Naccio
a,⁎, Daniela Famiani
b, Francesca Liberi
c, Paolo Boncio
c,d, Fabrizio Cara
b,
Antonio De Santis
c, Giuseppe Di Giulio
a, Fabrizio Galadini
b, Giuliano Milana
b,
Gianluigi Rosatelli
c, Maurizio Vassallo
aaIstituto Nazionale di Geofisica e Vulcanologia, Sezione di Sismologia e Tettonofisica, L'Aquila, Italy bIstituto Nazionale di Geofisica e Vulcanologia, Sezione di Sismologia e Tettonofisica, Roma, Italy cUniversità“G. D'Annunzio” Chieti - Pescara, Department DiSPUTer Chieti, Italy
dCRUST - Centro inteRUniversitario per l'analisi SismoTettonica tridimensionale con applicazioni territoriali, Chieti, Italy
A R T I C L E I N F O Keywords:
Seismic microzonation Site effects Local seismic hazard Subsurface geological model Central Italy
Fucino basin
A B S T R A C T
The Quaternary Fucino basin in the central Apennines of Italy was struck by one of the strongest Italian earthquakes of the last millennium (1915, Mw 7.0). The Avezzano town, ~ 9.0 km away from the epicentre, was completely destroyed. In the surrounding area sizable coseismic surface deformation were catalogued, attesting the severity of earthquake, the proximity to the causative fault and the geological and geomorphological
complexity of a basinfilled by thick lacustrine sediments.
The Avezzano area provides a case study to understand how shallow subsurface geology influences site effects
in a deep Quaternary continental basin environment, thus being of potential interest for similar geologic contexts
worldwide. Within the investigated area, different possible earthquake-induced effects can occur, such as a)
stratigraphic amplifications in a wide range of resonance frequencies (from 0.4 to 15–20 Hz); b) liquefaction; c)
coseismic surface faulting; d) basin-edge effects; and e) slope instability.
We present and discuss results of basic seismic microzonation study (SM) of the Avezzano area, focusing on geologic constraints aimed at the reconstruction of the shallow subsurface geology, and associated potential for local seismic hazard.
We adopted an interdisciplinary approach based on detailed geological-structural, geophysical and seismic analyses to investigate the seismic response of high-seismic risk area, such as the Avezzano town, given the urban and industrial expansion since the last century. We discuss methodological approaches and their un-certainties.
1. Introduction
Surface and shallow-subsurface geological investigations are fun-damental for seismic site characterization. Physical-mechanical prop-erties of the sedimentary infill, sharp seismic velocity contrasts, geo-metric complexity in the buried bedrock topography are highly impacting the wave reverberation and local ground-motion ampli fica-tion in terms of durafica-tion, frequency, amplitude and spatial-variability (Aki, 1988;Bard and Bouchon, 1985;Hartzell et al., 2016). For these reasons, geophysical investigations and their interpretation need to be anchored in a solid geological model, which allows a complete
understanding of the subsurface structural complexities, the 3D geo-metry of sedimentary layers, their mutual relationships and the rela-tions with the bedrock interface.
Detailedfield mapping, subsurface data (i.e. laboratory and in situ analysis of soil deposits and geophysical data) and seismic data col-lected from recordings of ambient seismic noise and weak motion are necessary to properly achieve a geological model of the shallow sub-surface horizons, essential to perform the entire seismic microzonation (SM) process.
According to the Italian guidelines for SM by the Italian Department of Civil Protection (Gruppo di Lavoro, 2008;SM Working Group, 2015
https://doi.org/10.1016/j.enggeo.2020.105583
Received 23 May 2019; Received in revised form 17 February 2020; Accepted 5 March 2020
⁎Corresponding author.
E-mail address:[email protected](D. Di Naccio).
Available online 06 March 2020
0013-7952/ © 2020 Elsevier B.V. All rights reserved.
for the English edition), SM studies are organized in three different levels of knowledge. Level 1 SM is an indispensable step, preparatory for Levels 2 and 3, during which all the available geological data and constraints are collected, together with HVSR analysis from micro-tremor recordings. The main outputs from Level 1 SM are two thematic maps (the Geological-Technical Map for SM; (Martini et al., 2011) and the Map of Seismically Homogeneous Microzones) and geologic sec-tions. Thefirst map contains basic geologic information necessary for the successive (2nd and 3rd level) analyses of the seismic site response and it is preparatory for the Map of Seismically Homogeneous Micro-zones (SM Working Group, 2015). The second is a summary map, easily accessible to non-geologist earthquake scientists/technicians, which illustrates the microzones where a uniform site response is expected on the basis of the peculiar shallow subsurface lithostratigraphy and si-milarity in the local resonance frequencies. The two maps are tools for land and urban planning and highlight the areas prone to ground-mo-tion amplificaground-mo-tions due to stratigraphic and/or topographic condiground-mo-tions, to liquefaction processes, to slope instabilities and to coseismic de-formation due to active and capable faults.
During the following Levels 2 and 3 of SM, key areas are in-vestigated in detail with the acquisition of new data through ad-hoc field and laboratory analyses and by quantitative site-response studies carried out by simplified approaches (Level 2) or numerical meth-odologies (Level 3).
The synthesis of geologic data into graphic works (maps, sections, synthetic stratigraphies, etc), easily understandable for non-geologist earthquake scientists/technicians is a major challenge for seismic risk-oriented geologic works, such as SM. It involves an effort in synthe-sizing as many data as possible in as few elaborates, reducing un-necessary details.
In this study, we present the data and results of a basic SM (i.e., “Level 1” SM) of the Avezzano town (Fig. 1). The SM was carried out according to the guidelines for SM by the Italian Department of Civil Protection (Gruppo di Lavoro, 2008;SM Working Group, 2015), im-plemented with additional methodological procedures shared with the Abruzzo Regional Authority (http://protezionecivile.regione.abruzzo. it/index.php/microzonazione, last accessed in February 2019).
The choice of this municipality is not casual because Avezzano re-presents a perfect case history in the scientific literature. The Avezzano town was completely destroyed by different effects related to the 1915 earthquake (Mw = 7.0, Intensity XI on the MCS scale;Rovida et al., 2016). Being located in the north-western corner of the Quaternary continental Fucino basin (Fig. 1), the severity of the damage was cer-tainly due to the proximity to the seismogenic source because the town is located in the hanging wall of the SW-dipping Fucino normal fault system, activated during the 1915 earthquake. Nevertheless, the local geological conditions could have remarkably influenced the ground motion amplification (Cara et al., 2011) also causing several coseismic effects such as surface faulting, landslides, liquefaction, ground failure, and a series of hydrogeological anomalies extensively reported in Oddone (1915)andGaladini et al. (1999).
Thus, quantifying the surface earthquake-induced hazard and characterizing the seismic site effects prior to building structures for human occupancy are crucial aspects for the Avezzano town and for municipalities exhibiting similar geologic settings.
In this contribution, we focus on the geological constrains to raise awareness on the role that geological and geomorphological properties may play in a deep Quaternary basin under seismic loading.
With this aim, we propose a structure for the Geological-Technical Map and geological sections that differ significantly from the existing Italian guidelines for Seismic Microzonation studies (Gruppo di Lavoro, 2008; SM Working Group, 2015), with the aim of preserving basic geologic information together with lithological-technical data im-portant for local seismic hazard (seeSection 3).
We discuss some methodological approaches and their uncertainties of Level 1 SM, keeping in mind that the Geological-Technical Map for
SM (G-T Map) and the Map of Seismically Homogeneous Microzones became effective tools for land and urban planning (Section 6).
Ourfindings are summarized in an illustrative geological-resonant model for fault-controlled extensional basins useful for orienting site response studies in similar contexts (Section 7).
2. Geological setting
The Fucino basin is a Quaternary intermontane extensional basins in the Italian Apennines. It hosted a large lake, which was drained at the end of the XIX century. The basin is superposed on Mesozoic to Tertiary passive margin carbonates and syn-orogenicflysch rocks folded-and-thrusted during the Neogene compression and dissected by normal faulting during the Neogene-Quaternary extension (Carafa and Bird, 2016;D'Agostino et al., 2001;Lavecchia et al., 1994).
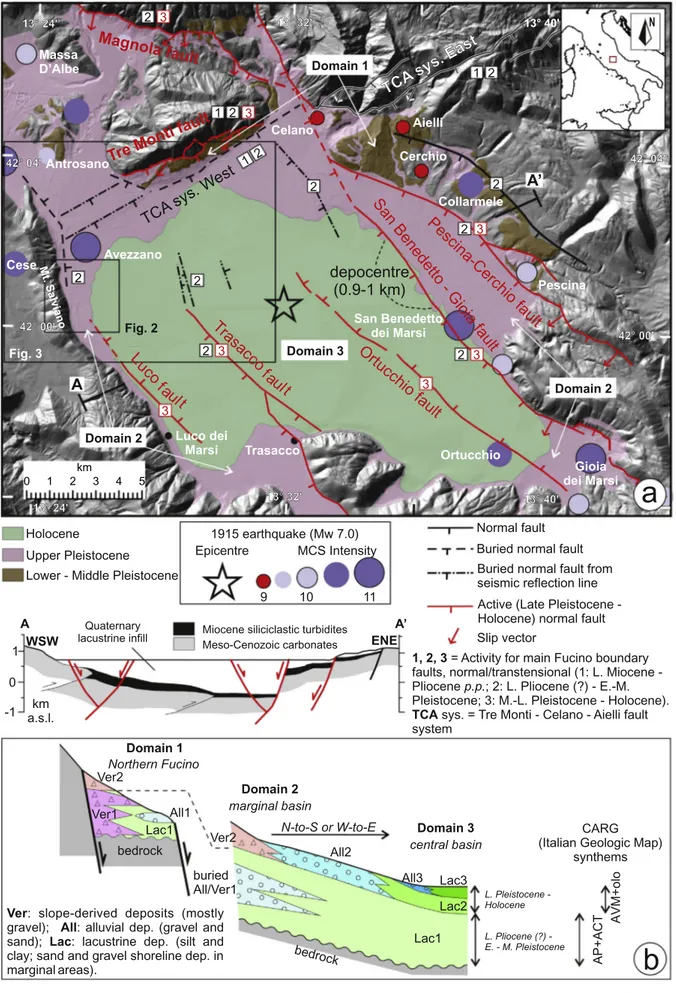
The Quaternary continental deposits unconformably cover the Meso-Cenozoic carbonates, cropping out in the reliefs surrounding the basin, and the Late Miocene sandstones and marls, mostly buried under the Quaternary sediments but largely exposed westward, along the Val Roveto valley. Concerning the continental infill, in the central part of the basin the uppermost stratigraphic levels are represented by Holocenefine-grained lacustrine sediments (silt and clay; domain 3 in Fig. 1) (e.g.Di Roberto et al., 2018;Giraudi, 1989). Along the perimeter of the basin, Pleistocene medium-to-coarse-grainedfluvial, alluvial fan, and slope-derived deposits are interfingered with lacustrine sediments (domains 1 and 2 inFig. 1). The perimeter area is also characterized by a complex morphology, with several erosional and depositional surfaces mainly related to lacustrine environment (Giraudi, 1998).
The basin evolution is related to the activity of two main fault systems bounding to the North and East the Fucino basin (Fig. 1). The first system strikes WSW-ENE and dips to the SSE (Tre Monti-Celano-Aielli fault system); the second system strikes NW-SE and dips to the SW (Pescina-Cerchio, Magnola and San Benedetto-Gioia principal faults), with synthetic (Trasacco) and antithetic (Ortucchio, Luco) faults. The NW-SE fault system has normal kinematics. The Tre Monti-Celano-Aielli (TCA) fault system is the western portion of the Neogene right-lateral strike slip Fucino-Bussi regional shear zone (Ghisetti and Vezzani, 1997). In the Fucino area, the TCA was active with down-to-SE normal component during the Messinian growth of the syn-orogenic flysch (Cavinato et al., 2002). During the early stage of the opening of the continental basin (Late Pliocene (?)– Early-Middle Pleistocene), the TCA fault system was reactivated with right-lateral transtensional ki-nematics, consistently with the NE-directed extension. Con-temporaneously, the major SW-dipping normal faults started to develop along the eastern side of the basin, becoming the master faults of the Fucino half-graben (Galadini and Messina, 1994). In more recent times (Middle-Late Pleistocene– Holocene), only the Tre Monti segment of the TCA system continued to be active, as release fault in the hanging wall of the SW-dipping fault system (Galadini and Galli, 1999). Seismic reflection and well data show the half-graben sedimentary infill in the hanging wall of the SW-dipping Fucino fault system (Fig. 1a) (Cavinato et al., 2002;Patacca et al., 2008), with a basin depocenter localized towards the eastern margin and estimated thickness of the basin infill of ~ 1000 m (Cavinato et al., 2002).
The current activity of the Fucino normal faults is highlighted by the occurrence of the January 13, 1915 earthquake (Mw7.0Fig. 1a) and high GPS-derived strain rates (Carafa and Bird, 2016). The 1915 earthquake was caused by slip on the SW dipping Fucino fault system. Paleoseismological studies on this fault system revealed the occurrence of at least 10 paleoearthquakes in the last 33 kyrs, with a recurrence interval ranging from 1400 and 2600 yrs. (Galadini and Galli, 1999; Michetti et al., 1996).
3. Data processing and methodology
Fig. 2 Fig. 3 Mt. Salviano 0 1 2 3 4 5 km 1 13° 24' 13° 32' 13° 40' 42° 00' 42° 04' 42° 00' 42° 04' 13° 24' 13° 32' 13° 40' 1 2 2 2 3 2 1 2 3 2 1 2 3 3 2 3 3 3 2 2 2
A
A’
WSW 0 1 -1 a.s.l.km ENE Quaternary lacustrine infillA Miocene siliciclastic turbidites A’
Meso-Cenozoic carbonates
Normal fault Buried normal fault Buried normal fault from seismic reflection line Active (Late Pleistocene -Holocene) normal fault Slip vector
Holocene Upper Pleistocene Lower - Middle Pleistocene
1, 2, 3 = Activity for main Fucino boundary
faults, normal/transtensional (1: L. Miocene - Pliocene p.p.; 2: L. Pliocene (?) - E.-M. Pleistocene; 3: M.-L. Pleistocene - Holocene).
TCA sys. = Tre Monti - Celano - Aielli fault
system Domain 1 Domain 3 Northern Fucino central basin Domain 2 marginal basin N-to-S or W-to-E AP+ACT Lac2 Ver2 All2 Lac1 Lac3 Ver2 Ver1 Lac1 bedrock All1 All3 buried All/Ver1 bedrock CARG (Italian Geologic Map)
synthems AVM+olo L. Pliocene (?) -E. - M. Pleistocene L. Pleistocene -Holocene
Ver: slope-derived deposits (mostly
gravel); All: alluvial dep. (gravel and sand); Lac: lacustrine dep. (silt and clay; sand and gravel shoreline dep. in marginal areas).
Trasacco t
l
u
fa
San Benedetto - Gioia fault
depocentre
(0.9-1 km)
L
uco t
l
u
fa
Ortucchio fault
Tre Monti fault
Pescina-Cerchio fault
Magnola fault
9 10 11 1915 earthquake (Mw 7.0) Celano Aielli Cerchio Antrosano Massa D’Albe Pescina Ortucchio Collarmele Avezzano San Benedetto dei Marsi Gioia dei Marsi MCS Intensity EpicentreTCA
sys.
Ea
st
Luco dei Marsi Trasacco CeseTCA
sys. W
est
Na
b
Domain 1 Domain 3 Domain 2 Domain 2Microzonation (SM) of the Avezzano town and surrounding area to evaluate the local seismic hazard and to subdivide it into zones having homogeneous seismic site response. The catalogued ground motion effects are those due to stratigraphic and/or topographic conditions, and coseismic deformation due to liquefaction, slope instabilities, or surface faulting due to active and capable faults.
In detail, the Level 1 SM of Avezzano was organized in 4 phases: 1) collection, quality-selection and georeferencing of all the
pre-ex-isting geological, geognostic and geophysical investigations (Subsection 4.1);
2) geologic and geomorphologicfield survey at 1: 5000 scale; synthesis of the data in the Geological-Technical Map for SM (hereinafter G-T Map); and construction of detailed geological sections re-presentative of the subsurface geological model (Subsection 4.2); 3) single-station recording of ambient seismic noise (65 new
record-ings) and analysis with the Horizontal-to-Vertical Spectral Ratio (HVSR) technique (Nakamura, 1989, 2000). The analysis allows to define: i) the zones where the H/V curve is flat and likely unaffected by stratigraphic and/or topographic amplification of the ground motion; ii) the zones where the H/V curve shows a peak and therefore characterized by site amplification; iii) the likely re-sonance frequency (f0) for the amplifying sites; and iv) constrain the geological model at depth (Section 5);
4) Synthesis of the data (i.e. subsurface geological, geophysical and seismic data) in the Map of Seismically Homogeneous Microzones (MOPS in the Italian guidelines for SM) (Gruppo di Lavoro, 2008; SM Working Group, 2015). This map is extensively used for urban and land use planning by municipalities and regional authorities (Section 6).
Point 2 is the most important during Level 1 SM as the knowledge of the local subsurface geological setting is necessary for a seismic re-sponse analysis. For this purpose, thefinal product of the phase, the G-T Map (1: 5000 scale), contains several technical features useful for SM such as lithology, physical-mechanical properties of soils (texture, compactness/strength), and bedrock (e.g. stratification and fracturing of rocks), structural (e.g. active and capable fault), hydrogeological and geomorphologic features. In particular, the G-T Map presented in this study and adopted for Level 1 SM of the Abruzzo region comes from the superposition of 3 different data layers (Fig. 2) including: geological units (Layer 1), lithological-technical units (Layer 2) and geomorpho-logical/hydrogeological/structural features (Layer 3).
This map is slightly different from the existing Italian guidelines (Gruppo di Lavoro, 2008;SM Working Group, 2015) because it includes an additional data layer, the geological map (Layer 1 inFig. 2a), respect to the standard guidelines. The classification of the geological units refers to the standard Italian Geological Map of the CARG project (e.g. APAT, 2005). This layer preserves the basic geological data (e.g. chronostratigraphic relations, sedimentary environments) allowing to proper constrain the 3D geometry of geological bodies. The map con-tains a lithotecnical classification of the units (Layer 2 inFig. 2a) based on a physical-mechanical characterization of soils (cover units) and bedrock fitting the variety of lithological, textural and structural fea-tures of the Apennine rocks and continental covers. In central Apen-nines, the geological bedrock is mainly formed by massive to thinly-bedded limestones, marly limestones, marly shales, shales and by al-ternating pelitic and arenaceous rocks; the cover unit consists of
continental deposits offluvial, lacustrine and glacial environment in-cluding coarse- and fine-grained soils with different degree of ce-mentation, compactness and cohesion.
Concerning the definition of “active and capable fault” (Layer 3 in Fig. 2a), the term“active” indicates a fault having evidence of activity during the late Quaternary and in particular, at least one activation during the last 40 kyrs (Gruppo di Lavoro, 2008;SM Working Group, 2015), and the term“capable” indicates the capability to rupture up to the surface during earthquakes, therefore determining a local seismic hazard (surface fault displacement hazard).
4. Surface and subsurface geology
4.1. Surface geological data
The stratigraphic units cropping out in the Avezzano region relate to a pre-Quaternary bedrock unconformably overlaid by Quaternary continental deposits (Geological Map inFigs. 2 and 3). The pre-Qua-ternary bedrock, cropping out in the Mt. Salviano and Tre Monti ridges (Fig. 1), consists of Cretaceous neritic limestones passing upwards to Miocene limestones, directly or through a more continuous succession of marginal-slope deposits of Cretaceous-Paleogene age. The carbonate successions evolve to pre-flysch (marly limestones, marls and marly shales) and pelitic-arenaceousflysch deposits of Late Miocene age.
The continental Quaternary deposits are formed by slope, alluvial fan and fluvial medium-to-coarse-grained deposits that are inter-fingered with fine-grained lacustrine deposits towards the central part of the basin (Fig. 1). In the studied area (Fig. 3), the maximum thickness of the Quaternary deposits is thought to be about 350 m (northern and eastern sectors).
Numerous works have been published in the last twenty years on the stratigraphy of the Quaternary continental deposits (Bosi et al., 1995; Cavinato et al., 2002; Centamore et al., 2006; Galadini and Messina, 1994;Giraudi, 1998;Zarlenga, 1987).
Three domains with three stratigraphic successions can be identified (Figs. 1 and 3):
1) Thefirst domain includes old fluvial and lacustrine deposits, with thick interlayers of slope-derived massive breccia (Lac1 Ver1 and All1; Lower-Middle Pleistocene“Aielli-Pescina” supersynthem and Middle Pleistocene“Catignano” synthem in the CARG geologic map; APAT, 2005). Their origin is related to the former opening of the basin, possibly since Late Pliocene (Cavinato et al., 2002;Galadini and Messina, 1994), and they are often faulted and uplifted in the footwall of the main normal faults. They crop out in the northern side of the basin where the boundary faults cumulated large amount of displacement, and they are absent along the western border of the basin where only small secondary antithetic faults are present. 2) The second domain includes the marginal area of the lacustrine
depression, wherefine-grained lacustrine sediments (silt and clay) are interlayered with coarse-grained (sand and gravel) alluvial, deltaic and shoreline deposits (outcropping units: Lac2 and All2; Upper Pleistocene“Valle Majelama” synthem in the CARG geologic map);
3) The third domain includes the central part of the basin, where the stratigraphy is dominated byfine-grained lacustrine sediments (silt and clay), with an increasing percentage of sand in the areas close to the margins (outcropping unit: Lac3). This area was occupied by the
Fig. 1. (a) Simplified geological map and the three stratigraphic domains of the Fucino basin (Central Italy). The basin depocenter is highlighted by the 0.9–1 km
contour line of the bottom of continental deposits from seismic reflection data (fromCavinato et al., 2002). The normal faults are classified taking into account their
activity, according toGaladini and Messina (1994)andCavinato et al. (2002). Macroseismicfield of the 1915 earthquake is fromLocati et al. (2016). The 2D geologic
section across the basin is also shown (modified fromCavinato et al., 2002). (b) Stratigraphic scheme illustrating the geometry and the facies distribution across the
three basin domains. The three domains are compared with the stratigraphic successions defined in the Italian Geological Map of the CARG project (APAT, 2005): AP
Fucino lake, which was completely drained by the end of the XIX century. The age of thefirst few meters is Late Pleistocene (upper part)– Holocene (Giraudi, 1998).
In this study, the Quaternary geological units (Fig. 3) were dis-tinguished on the base of sedimentary environment and age of deposits as follow:
The lacustrine deposits are divided into Lac1, Lac2 and Lac3 units (Fig. 3).
“Lac3” characterizes the third stratigraphic domain and is formed by prevailing silt and clay with sand, peat and pyroclastic interbeds.
“Lac2” crops out in the second domain, where it is made up of silty sands, alternating sandy gravel and gravelly sand of lacustrine deltaic facies, and clean gravels of lacustrine shoreline environment. Many erosional surfaces on both bedrock and continental deposits are present due to oscillations of the lake level (e.g., wave-cut erosional surface in Fig. 4; (Giraudi, 1998). In the third domain, Lac2 is in stratigraphic continuity with Lac3, without evident boundaries between the two units. The lithology is very similar to Lac3 (prevailing silt and clay), as observed in borehole cores. In this part of the basin, the bottom of the Late Pleistocene is at depths of ~15 m, with sedimentation rates as low as ~0.1 mm/yr (Giaccio et al., 2017).
“Lac1” crops out in the first domain, where it is formed by
alternating silts and clayey silts with minor interlayers of micaceous sands. In the second and third domains, Lac1 is in stratigraphic con-tinuity with Lac2. The prevailing lithology is silt and clay with peat layers, with several intercalations of sand and gravel in marginal areas (second domain;Fig. 4).
The alluvial deposits cropping out in the studied area are divided into All2 and All3 units, which can be correlated with Lac2 and Lac3 units, respectively.
“All3”is formed by rounded to sub-rounded calcareous gravels, loose or slightly cemented sands and silty sands constituting minor al-luvial fans located at the outlet of small valleys (Fig. 3).
“All2” is formed by rounded to sub-rounded calcareous gravels and sandy gravels, occasionally stratified. All2 deposits correspond to two large alluvial fans that fed the lacustrine basin during Late Pleistocene cold climatic conditions (Valle Majelama and Celano alluvial fans; Frezzotti and Giraudi, 1992).
The slope deposits are divided into Ver1 and Ver2 units (Fig. 3). “Ver2” crops out at the base of carbonaceous reliefs and is formed by medium- to coarse-grained bodies of loose to dense slope-derived calcareous gravels in a sandy-silty matrix. The matrix is brown to dark-red and vary from very abundant (matrix-supported) to absent. The age is Late Pleistocene-Holocene.
“Ver1”is formed by ancient massive or coarsely stratified breccias.
Fig. 2. (a) Methodological scheme used for the construction of Geological-Technical Map for SM, (b) illustrativefield views of bedrock (B1) and cover (E2)
We recognized three lithotypes: i) well-cemented calcareous breccia, with angular, heterometric clasts in sandy matrix; ii) stratified eous breccia with red, silty matrix; iii) less cemented, whitish calcar-eous breccia without matrix. The age is Early-Middle Pleistocene.
“Coll” is formed by colluvial-eluvial deposits accumulated along the foothills, heterogeneous both in grain size and textures. The age is Late Pleistocene-Holocene.
“Ant” and “dis” are local covers made up of backfill/anthropic material and waste material, respectively.
The lithostratigraphic units have been associated to six
litho-technical units (Fig. 2c). The geological bedrock is classified as B and groups medium-to-very thickly bedded rock masses. Cover units are classified as E (uncemented, coarse granular soils with different grain size and compactness), and F (fine soils) units. Anthropic and waste materials are incorporated in unit G.
The structural elements are mainly represented by ENE-WSW- and NW-SE-striking normal faults, related to the fault systems bounding the Fucino basin (Tre Monti and Fucino fault systems). Some are buried faults, inferred from well and seismic reflection data (Subsection 4.1; Cavinato et al., 2002) without evidence of late Quaternary activity, but
Fig. 3. Simplified geological map of the Avezzano area, based on 1:5000 scale field survey, with location of illustrative Geologic-Technical Map for SM (Fig. 2c) and
Fig. 4. Geological section across the western border of the Fucino basin in the southern Avezzano area (Industrial area) showing a simple basin-edge geometry (A-type). Vertical scale is exaggerated two times. Diagrams are Horizontal-to-Vertical Spectral Ratios (HVSR) of single-station ambient seismic noise recordings (this work); f0 is the resonance frequency. Note the systematic decrease of f0 moving from the outcropping bedrock (no H/V peak) to the deep central part of the basin. The bar above the section illustrates the distribution of Seismically Homogeneous Microzones.
responsible for the formation of bedrock steps (i.e. black faults with rank 1–2 in Fig. 1). Other faults display clear morphological and/or paleoseismological evidence of late Quaternary activity (rank 3 in Fig. 1) and are considered active and capable faults. This is the case of the NW-SE-striking Trasacco and Luco dei Marsi faults interpreted as respectively, synthetic and antithetic splays of the Fucino main fault system (rank 3 inFig. 1). Paleoseismological studies testify repeated reactivations of the SW-dipping Trasacco fault during large earth-quakes, the last one being the 1915 earthquake (Galadini and Galli, 1999;Galadini et al., 1997, 1999;Giraudi, 1986, 1998). The NE-dip-ping Luco dei Marsi fault wasfirst mapped byGiraudi (1986)close to the Luco dei Marsi village and then observed in paleoseismological trenches at the southern border of the studied area (Galadini and Galli, 1999). The fault trace is not easily recognizable in thefield, probably due to a combination of low cumulative displacement and intense agricultural activity since Roman times that erased the surface fault scarp. The uncertain fault trace has been prolonged to the NW up to the industrial area of Avezzano (Fig. 3) on the base of well data analyzed in this work (see section A-A' inFig. 4). Paleoseismological data display at least two reactivations of the Luco dei Marsi fault, both consistent with the seismic history of the Fucino fault system (Galadini and Galli, 1999).
Within the TCA fault system, the Tre Monti segment has been mapped as active and capable fault on the base of morphotectonic studies (Galadini and Galli, 1999; Galadini and Messina, 1994; Morewood and Roberts, 2000; Piccardi et al., 1999) and in situ36Cl dating of tectonically exhumed fault scarp (Benedetti et al., 2013).
The ENE-WSW-striking Paterno fault is the basal segment of the Tre Monti fault system. It is doubtful if the Paterno fault is presently active. The subsurface data show that this fault was highly active during a long part of the Quaternary, as it was responsible for a sharp deepening of the bottom of the lacustrine deposits (Lac1 and Lac2) (section D-D' in Fig. 5). On the other hand, there are no constraints on the late Qua-ternary activity of the fault.Giraudi (1998)documented discontinuous fault scarps along the Paterno fault trace, NE of the Paterno village, on Upper Pleistocene lacustrine shoreline deposits. On this base, the Pa-terno fault has been mapped as potentially active (displacement of Middle-Late Pleistocene deposits, but not necessarily more recent than 40 ka;Technical Commission on Seismic Microzonation, 2015). 4.2. Subsurface data and geological sections
The shallow subsurface geology of the soft cover units, the depth to the geologic bedrock and the identification of buried morphologies are prerequisites to evaluate areas potentially susceptible to site effects. With this purpose our analysis starts with the collection of all the available subsurface data, including geophysical, geognostic and geo-technical investigations, hydrogeology and groundwater data, and subsurface stratigraphy from well data. The quality of the data is then validated and organized into a GIS-geodatabase.
Overall, we collected 435 data (Fig. 6) which mainly consist of stratigraphy of water wells (made available by ISPRA, Italian Institute for Environmental Protection and Research; and by“Ente Fucino”, a local managing institution, for old wells drilled during‘50), geophysical investigation for hydrogeological exploration (Vertical Electric Sounding, VES), several stratigraphic and mechanical logs from geog-nostic wells made available by professional geologists. In detail, 35 wells of 160 (geognostic or for water exploration/exploitation) were drilled up to the geological bedrock (with maximum well depth 270 m). For the Castello Orsini site within the Avezzano town we collected HVSR data in 2D seismic array configuration used to characterize the AVZ-seismic station of the Italian Strong Motion Network (Luzi et al., 2017) and Seismic Dilatometer Tests (SDMT) by University of L'Aquila. Industrial seismic-reflection profiles available for the entire Fucino area (Cavinato et al., 2002) and a deep reflection seismic profile (CROP 11 line, Patacca et al., 2008) were used to constrain both the deep
structure of the continental basin and the depth of the pre-Quaternary bedrock (i.e.Figs. 4 and 5). The time-to-depth conversion is usually problematic, due to lateral seismic wave velocity variations within the lacustrine deposits produced by a number of variables such as porosity, compaction and grain size variations. Considering that coarse-grained sediments increase towards the margin of the basin, it is likely that also the average seismic wave velocity increases accordingly. Nevertheless, due to the lack offirm and homogeneously distributed constraints, we performed a time-to-depth conversion by using the average P wave velocity (Vp) of 2000 m/s for the continental infill used by Patacca et al. (2008)for the CROP11 seismic line. This value is consistent with Vp values calculated in this work for two sites where the isochrones by Cavinato et al. (2002)can be compared to the depth of the bedrock from boreholes.
For the acquisition of ambient noise data, we performed single station measurements by using Reftek130, MarsLite and MarsLite/ SARA digitizers equipped with Lennartz 3D/5 s velocimeters. In the Pietracquaria site (Mt. Salviano, West of the Avezzano town), we used the data acquired by the PTQR seismic station (available athttp://cnt. rm.ingv.it/instruments/network/IV) of the Italian Seismic Network (Michelini et al., 2016) equipped with a Gaia2 digitizer and a Trillium-120C velocimeter. For all the stations absolute timing was warranted by GPS devices. The HVSR has been computed using the processing pro-cedures developed within the Site EffectS assessment using AMbient Ex-citations project (SESAME European project, 2004). For each noise re-cording, the stationary portion of the signal was selected adopting an anti-trigger algorithm on the raw signal to remove strong transients inside time histories. This selection provided, at each site, a number of at least twenty 40 s-long windows. The time windows were detrended and 5% cosine tapered. The Fourier amplitude spectra were computed and then smoothed followingKonno and Ohmachi (1998)technique. The two horizontal components spectra were combined into quadratic mean. Thefinal geometric mean of the HVSR and standard deviation are obtained by averaging the H/V ratios from all windows. The fun-damental resonance frequency and the associated amplitude were vi-sually selected from the HVSR curves.
The subsurface geological model of the Avezzano area are synthe-sized along 2D geological sections realized in key areas best re-presenting the geological and buried topographic complexity of the lacustrine basin (Figs. 3, 4 and 5). We distinguished three typologies of basin margins based on its geometry: A-type margin or simple basin-edge geometry; B-type margin or sharp basin-basin-edge geometry due to boundary normal fault; and C-type margin, a special case of B-type margin where the sharp basin-edge geometry along the normal fault is covered by a thick layer of stiff deposits (i.e. gravels of the Valle Ma-jelama alluvial fan inFig. 3).
The A-type margin observed along the western edge of the Fucino basin (section A-A' inFigs. 3 and 4) is characterized by a progressive, gentle deepening of continental infill towards the centre of the basin. At the piedmont of Mt. Salviano, the top surface of carbonate bedrock is nearly-horizontal. It is an erosional surface carved by the water of the Fucino Lake during the last glacial maximum, when the lake level reached its maximum extension (~18–20 kyrs ago; Giraudi, 1998). Moving towards the centre of the basin, the progressive thickening of continental infill is interrupted by a small step of the top erosional surface of the bedrock (dashed black line inFig. 4) inferred from well stratigraphies. The buried step has been related to the Luco dei Marsi normal fault and it does not significantly modify the simple geometry of the basin edge. The estimated maximum depth of the bedrock is ~200 m beneath point A', but it further deepens eastwards as shown by seismic reflection data inCavinato et al. (2002).
The B-type margin characterizes the northern edge of the basin at the base of the Tre Monti ridge. Its sharp termination is due to the Tre Monti and Paterno synthetic boundary normal faults (section D-D' in Figs. 3 and 5). The carbonate bedrock crops out in the footwall of the Tre Monti fault and the deposits of Ver1 and Lac1 units are present
Fig. 5. Geological sections across the northern Fucino basin, showing a sharp termination of the lacustrine basin against a boundary normal fault (section D -D'; B-type margin), a sharp basin termination geometry covered by a thick layer of fan gravels (section C-C'; C-type margin), and a transition from A-type to C-type basin terminations (section B-B'). Key as in Fig. 4 . The bars above the sections illustrate the distribution of Seismically Homogeneous Microzones.
between the two faults. The textural features of the continental deposits are doubtful due to the absence of geognostic investigations in this area. However, we presume that the ancient lacustrine deposits (Lac1) are interfingered with coarse-grained continental deposits (Ver1), corre-sponding to the units that crop out in the footwall of the Paterno fault, or deriving from disruption and sedimentation of the footwall units. In the footwall of the Paterno fault, close to the fault trace, the bedrock, probably consisting of Miocene marls and sandstones (UAP in section D-D',Fig. 5), is at a depth of 20 m from the ground surface (Bertini and Bosi, 1976;Bosi et al., 1995). In the hanging wall of the Paterno fault the bottom of the Quaternary infill is interpreted to deepen sharply to depths of ~150 m. This interpretation is based on VES data, which indicate a transition from very-low resistivity rocks (18 Ωm), inter-preted as lacustrine sediments, to low-resistivity rocks (58Ωm), inter-preted as Miocene bedrock. About 1.2 km to the south, the top of this bedrock is inferred to be ~200 m deep from the stratigraphy of a water well. Instead, the Upper Pleistocene Lac2 deposits are only present in the hanging-wall of the Paterno fault.
The C–type margin characterizes the north-western sector of the Fucino basin bounded by buried ENE-WSW striking normal faults (B-B′ and C-C′ geological sections in Figs. 3, and 5). The presence of SE-dipping normal faults accounts for the progressive lowering of the bedrock units, with the Upper Pleistocene alluvial fan gravels sealing the faults. The gravels belong to the distal part of the Valle Majelama alluvial fan (All2,Fig. 3), which prograded within the lacustrine basin during the last glaciation period of Late Pleistocene (Frezzotti and Giraudi, 1992). The gravel thickness and the transition to the
underlying lacustrine units are constrained by a number of geognostic and water wells (Fig. 5).
5. Geological bedrock and microtremor analysis
For the seismic site response evaluation of Avezzano and sur-rounding areas, we carried out a seismological survey in two geological contests: soft soils and rock sites (see alsoCara et al., 2011;Famiani et al., 2015).
For these purposes, a very common methodology applied in seis-mological and microzonation studies is the ambient noise spectral ratios (hereinafter HVSR) analysis (Nakamura, 1989, 2000). In case of high impedance contrast between soft sediments and stiff bedrock, a clear peak can be observed in the H/V spectral ratios, representing the re-sonance frequency (f0) of the site (Bonnefoy-Claudet et al., 2006;Field and Jacob, 1993). Assuming 1D-resonant model, the f0can be related to the shear-wave velocities (Vs) of the basin infill and to the depth of the bedrock (H) by the following equation (Yamanaka et al., 1994):
=
f0 Vs/4H (1)
On the base of the available Vs values of the soft layers (Fig. 6), we used Eq.(1)to check the consistency of the measured f0with the sub-surface geological model obtained from independent geological/geo-physical data (geologic sections inFigs. 4 and 5), provided that varia-tions of lithology and H are not so large to prevent the assumption of constant average Vs.
In rock sites, the weathering and fracturing of rock might cause Fig. 6. Pre-existing sub-surface data collected for Level 1 SM. HVSRs include both pre-existing and new-acquired data. DH = geognostic well with Vs down-hole test.
consistent decrease of its stiffness which might favor the entrapment of seismic energy and thus inducing ground-motion amplification (Di Naccio et al., 2017;Hailemikael et al., 2016;Tucker et al., 1984). The frequency and amplitude in the H/V curves from the eastern side of the Mt. Salviano carbonate ridge were compared with the geomechanical properties of rocks (e.g. volumetric joint count Jv index, defined as the number of fractures in the unit of volume, according to the Interna-tional Society for Rock Mechanics procedures;Barton, 1978).
At the rock sites, the H/V curves are nearlyflat (i.e., H/V ~ 1 over the 0.2–20 Hz interval), unless complications due to fracturing (see HVSR Av-in01 and HVSR Av-in02 inFig. 4as examples) or topographic irregularities are present. The volumetric joint count (Jv) measure-ments in the carbonate rocks of Mt. Salviano give values varying from 10 to 20 (except for one site where Jv≥ 30) indicating that the geo-logical bedrock is formed by moderately fractured rock masses.
Down-hole and cross-hole investigations collected in the industrial area of Avezzano (western side of section A-A' inFig. 4) indicate Vs of ~1000 m/s for the carbonate bedrock close to the ground surface, in-creasing to > 2000 m/s at 10 m depth. Direct near-surface measure-ments of Vs for the Miocene bedrock are not available, but the Vs profiles obtained by passive 2D array in the northern side of Avezzano suggest Vs on the order of 1000 m/s at depths of ~ 100 m.
Thefine-grained lacustrine deposits (Lac units) are characterized by Vs velocity lower than 500 m/s. For example, at the AVZ-seismic station (Luzi et al., 2017), the Vs profile obtained from the 2D array indicates mean values of ~200 m/s for thefirst 35 m of Lac2 (inFig. 3), and of ~ 500 m/s for the thick pile of Lac1 + Lac2 lacustrine sediments from 35 to 160 m depths. These data suggest that a strong impedance contrast is expected between the geologic/seismic bedrock (carbonate or silici-clastic) and the Quaternary basin/soft deposits and also within the continental covers. The impedance contrast might decrease appreciably where the Quaternary infill is dominated by dense, coargrained se-diments. In the northern side of the basin the gravel deposits of the Valle Majelama alluvial fan (All2,Figs. 5 and 7) are characterized by Vs of 540–710 m/s in the first 30 m depths (down-hole data;Fig. 6). On these sites (e.g. All2 unit,Figs. 5 and 7), the H/V curves show a peak with amplitude up to 3 in a frequency range between 0.6 and 0.8 Hz.
In other gravel and sand deposits sites (i.e. Ver1, col. and FRA), as along the marginal area the H/V curves display sharp peaks (amplitude greater than 3), and f0generally higher than 1 Hz. Instead, in the north-eastern part of the Avezzano municipality, stratigraphic lateral varia-tions due to dense or cemented gravels of alluvial fan inter-fingered withfine-grained lacustrine deposits at depth (Lac1-Lac2) are reflected in some irregularities of the f0distribution. Moving towards the most central and deepest part of the basin on soft deposits, we observe a regular decrease in the f0values consistent with the deepening of the bedrock. For example, along the A-A' section (Fig. 4), the f0decreases eastward, varying from 1.7 to 1.0 to 0.7 Hz (0.4 Hz ~ 3 km NE of point A', not shown inFig. 4). This result can be explained by 1D transfer function of vertical incident SH-waves attesting a gentle dipping top surface of seismic bedrock sinking under soft layer deposit. The ob-served f0are in good agreement with the available bedrock depths and average Vs. As an example, the 0.7 Hz f0measured close to the ~160 m-deep bedrock is in good agreement with the average Vs of ~500 m/s for the Lac1-Lac2 succession. Along the geological section we also noted a sudden lateral variation of the f0values which accounts for a step in the buried bedrock (Figs. 3 and 4). Remarkably, the detected step is in agreement with our stratigraphic analysis on deep-well data across the Luco dei Marsi buried fault (Subsection 4.2).
A further interesting result of our HVSR analysis is the evidence of possible 2D/3D effects (Field, 1996; Kawase, 1996) in the northern edge area of the basin. The Paterno fault outlines a B-type margin edge which represents a lateral sudden variation in terms of subsoil geo-metries and strong elastic and rheological contrast in the bounding deposits. In this area, the H/V curves are affected by high standard deviations and at f0of ~0.5 Hz they do not show a very clear sharp
peak.
6. Seismic microzones
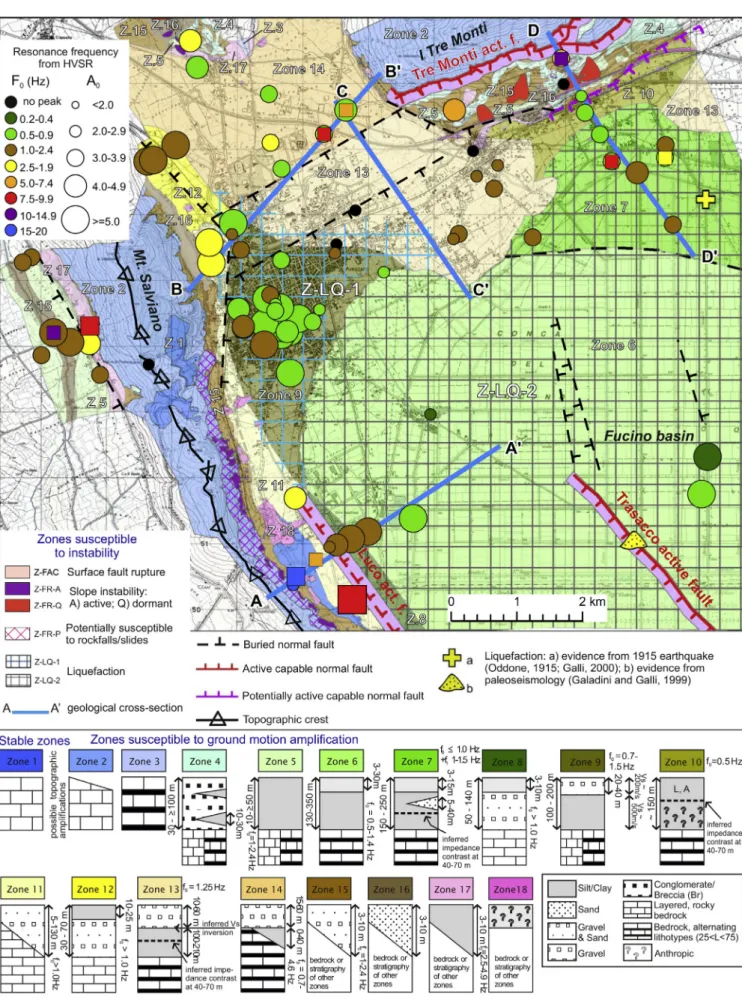
The Map of Seismically Homogeneous Microzones (MOPS;Fig. 7) and the simplified stratigraphic columns associated to the microzones is derived from the G-T Map for SM, particularly from Layers 2 and 3 (i.e. lithological-technical units and geomorphological/hydrogeological/ structural features; Fig. 2). The HVSR analyses integrated with the subsurface geometries (e.g., from geologic sections and G-T Map) allow to further constrain thefinal microzone subdivisions.
In detail, we distinguished: zones without appreciable ampli fica-tions (dark blue; i.e., stiff bedrock in nearly horizontal topography), zones susceptible to amplification due to topographic (light blue) or stratigraphic (other colors) conditions and zones susceptible to co-seismic permanent deformation.
The geological model (Section 4.2) allows to outline stratigraphic site amplification leaded by 1D effects mainly in the central part of the basin and by 2D/3D effects along sharp basin-edges (B- and C-type margins). The HVSR analysis independently and consistently supports the geological data where it can be coupled with a 1D-resonant model. The highest f0values (> 1 Hz, up to 2.5–5.0 Hz) are observed along the perimeter of the basin, with a general decrease in the f0values towards the centre of the basin (< 1 Hz, down to values as low as 0.4 Hz) ac-cording to the increase in sediment infill thickness. The spatial dis-tribution of f0in favorable conditions allowed also to better constrain buried morphologies (i.e. buried fault scarp, as for the Luco dei Marsi fault).
Our results prove that the widespread application of this technique without a previously defined geological model is not recommended. For example in the northern area (B- and C-types margins), the sharp lateral variation due to faults and the related strong lithological and elastic contrast between the geological units defines 2D/3D conditions in the geological-resonant model, which might account for seismic waves re-verberation and local ground motion amplification in terms of fre-quency, amplitude and spatial variability. The low stability found in the HVSR analysis reflects that the 1D-condition in the resonant model necessary for the applicability of the method are not fulfilled. Despite this, in the H/V curves a peak at f0of ~0.5 Hz is still recognizable.
Concerning the coseismic permanent deformations, we outlined the following zones susceptible to:
1) slope instability; 2) soil liquefaction;
3) coseismic surface faulting along active and capable normal faults.
It is worth noting that all the phenomena were documented during the 1915 earthquake (Castenetto and Galadini, 1999; Galli, 2000; Oddone, 1915).
1) Slope instability needs particular attention, considering that fallen rock blocks were found at the piedmont of the steep mountain ridges where urbanization and industrial development are high. This de-mands gaining a better understanding of the extension of unstable slope sectors, the slope failure mechanisms and associated hazard in static and dynamic condition. In this study, we outlined over a wide area (i.e. Mt. Salviano and Tre Monti ridges;Figs. 7 and 8) the slope sectors prone to rock slope instability in static condition and its failure mode (i.e. rock fall/topple, wedge and planar sliding) through a GIS-procedure implemented byMartino et al. (2018). The analysis according to the Markland test (Markland, 1972) verifies the kinematic compatibility to failure modes for each fracture set (joints, faults and bedding) with respect to slope angle and slope aspect (direction of maximum slope) pertaining a homogenous structural and morphological slope sector. The partitioning of the area allows to attribute the geo-structural data from punctual survey
Fig. 7. Map of Seismically Homogeneous Microzones with fundamental resonance frequencies (f0) from noise HVSR analyses (symbol size is proportional to the
amplitude of the H/V peak, A0). The map indicates stable zones (without amplification of the ground motion; i.e. stiff bedrock in nearly horizontal topography), zones
to a wide area.
In detail, we performed a structural survey in several sites best re-presenting the rock mass characteristics of the reliefs using scan lines and inventory areas (Fig. 8b and c) and we outlined homogeneous morpho-structural zones along the eastern Mt. Salviano and southern Tre Monti ridgeflanks. The fractures were characterized in terms of their typology, geometry, attitude, network properties (organization in sets, hierarchy, persistence, opening, spacing and density), and the rock mass in terms of its quantitative geomechanical properties (i.e. volu-metric joint count Jv), index according to ISRM prescriptions (Inter-national Society for Rock Mechanics) (Barton, 1978). We calculated the slope and aspect maps from 5 m DEM (http://opendata.regione. abruzzo.it/opendata/CTRN_Regione_Abruzzo_1_5000, last accessed in February 2019).
The zones potentially susceptible to earthquake-induced slope in-stability correspond to the steep slopes (> 30°) of fractured limestone (RDT) and calcareous breccia (Ver1) of Mt. Salviano and Tre Monti reliefs, respectively (Fig. 7) and the prevailing failure mode is re-presented by topple/rock falls.
In future steps, other approaches such as PARSIFAL (Probabilistic Approach to pRovide Scenarios of earthquake-Induced slope FAiLures; Martino et al., 2018), may include slope stability analysis to derive critical pseudostatic acceleration. This approach overcames some lim-itations of semi-quantitative analysis often based on empiric laws, providing a concomitant analysis of different slope failure mechanisms
for both reactivated orfirst-generation slope instabilities and a com-prehensive scenario of earthquake-induced landslides in terms of ex-ceedance probability of critical threshold values of co-seismic dis-placements.
2) Concerning the earthquake-induced soil liquefaction, we used ex-clusion criteria as recommended for Level 1 SM. The Italian building code“Norme Tecniche per le Costruzioni” (NTC, 2018) states that the liquefaction hazard at a site during an earthquake can be ne-glected if at least one of the following conditions is accomplished: 1) maximum peak ground acceleration (PGA)≤ 0.1 g; 2) mean sea-sonal water table depth > 15 m from ground surface; 3) clean sands with SPT (Standard Penetration Test) blow count N1(60) > 30 or CPT (Cone Penetration Test) resistance qc1N > 180, both normalized for overburden and energy ratio; 4) grading curves external to pre-defined granulometric zones.
According to the seismic hazard studies in the Fucino area (Gruppo di Lavoro, 2004; Pace et al., 2014; Valentini et al., 2019), the first condition is not fulfilled as the expected PGA is above the limit. The other conditions are not satisfied in large areas. For example, con-cerning the last two conditions, the available geognostic and geo-technical data are few and not sufficient to extrapolate the lithotecnical properties of soil cover over large areas. Moreover, the liquefaction cannot be excluded thanks to historical (1915 earthquake) and pre-historical (paleoseismologic studies) evidence of past liquefaction Fig. 8. Example of geological and structural analysis to assess the zones potentially susceptible to rock slope instability along the Mt. Salviano slopes. (a) rock fall block found at the piedmont of Mt. Salviano eastern slope; (b) example of inventory area (SA) and (c) scan-lines (SL) for the geomechanical analysis; (d) synoptic rose diagram (left side) and persistence and aperture frequency diagrams (right side) of the main joint sets and bedding used to verify the kinematic compatibility of different failure modes (topple, wedge and planar sliding). (For interpretation of the references to colour in this figure legend, the reader is referred to the web version of this article.)
(Galadini and Galli, 1999; Galli, 2000; Oddone, 1915). Having ac-counted all the above source of uncertainties, two“warning zones” for earthquake-induced soil liquefaction are defined (Z-LQ-1 and Z-LQ-2). They include the lowland zones both along the urbanized perimeter of the basin and within the youngest, central part of the basin, where the mean seasonal water table depth is < 15 m. In particular, Z-LQ1 cor-responds to zones where layers of saturated sands within thefirst 20 m of depths are present; Z-LQ2 corresponds to zones where historical and paleoseismological evidences of past liquefaction are present but sedi-ments are mostlyfine-grained and geotechnical and geological data are poor.
Our results highlight the necessity to improve the surface and sub-surface geological information in constructing reliable model able to fulfill the specific conditions in the occurrence of liquefaction phe-nomenon and severity of coseismic permanent deformations. A way to overcome such limitation has been recently illustrated byBoncio et al. (2018), which analyzed and quantitatively estimated the susceptibility to liquefaction of the Pozzone site, located at the north-eastern side of the Fucino lacustrine basin. The authors suggest that in such lacustrine geologic environments characterized by high content of fine-grained soils and thus not typically found in liquefiable soils, reliable estimates of the cyclic liquefaction resistance can be only detected by using de-tailed stratigraphic reconstructions, in situ characterization of lique-faction potential by comparing results from different techniques, and laboratory analyses.
3) Zones susceptible to instability due to active and capable faults (Z-FAC) outlines the surface fault displacement hazard. In the studied area, the NW-SE-striking“Luco dei Marsi” and “Trasacco” faults in the southernmost sector and the WSW-ENE-striking “Tre Monti” fault to the north are secondary structures to the main Fucino normal fault system (Fig. 1). The Luco and Trasacco faults are re-spectively the antithetic and synthetic splays of the Fucino fault system. The Tre Monti fault is a nearly-orthogonal release fault in the hanging wall of the main Fucino fault system.
Moreover, paleoseismological data suggest that at least the Luco and Trasacco faults can be activated contemporaneously with the main fault during earthquakes as large as the 1915 one (Galadini and Galli, 1999). Therefore, for these structural and paleoseismological reasons, we traced the Z-FACs along the three main fault traces (Luco dei Marsi, Trasacco and Tre Monti faults). The Paterno fault (eastern segment) has been classified as “potentially active and capable fault”.
According to the criteria suggested byBoncio et al. (2012), the Z-FACs width are asymmetrically distributed between the footwall (30 m) and the hangingwall (150 m) of the Trasacco and Tre Monti faults. Due to uncertainties on fault trace location, The Z-FAC of the Luco dei Marsi fault is wider (250 m).
It is important to note that the Z-FAC can be seen as zones where detailed investigations are required before building new structures for human occupancy. Hence, detailed topographic, geological, geophy-sical, geodetic and paleoseismological investigations can help in as-sessing fault activity, its potential to rupture the surface (capable fault) and eventually dismiss any non-tecnonic process. It is worth to note that in complex mountainous terrains such as the Apennines, steep slope and/or strong lithotecnical contrast may contribute to the ex-posure of fault scarps driving gravitational and erosional-depositional processes both during the coseismic and interseismic periods (Di Naccio et al., 2019;Galadini, 2006;Kastelic et al., 2017), thus perturbing the pure tectonic component. As example, along the steep Tre Monti fault zone the carbonate rocks at the footwall are in contact with slope and lacustrine deposits depicting a potentially unstable zone. Thus, a full understanding of the role played by each fault, the modes by which coseismic slip at depth is transferred to the surface, and the interplaying between tectonic versus non-tectonic processes acting in each fault zone should become a priority in the next years for properly suppling reliable
information to seismic hazard practitioners. This require the interaction of diverse expertise and the investigation from different perspectives possibly merging innovative approaches such as geodetic surveys or Interferomeric Synthetic-Aperture Radar analyses, with standard pa-leoseismological studies.
7. Discussions and conclusions
We provide a detailed study of a high-seismic risk area, the Avezzano town in central Italy, which experienced large urban and industrial expansion since the last century in a lacustrine basin. The studied area proved to be a case study of potential interest for the nu-merous intramountain basin of Apennines that are controlled by seis-mogenic normal faults and for similar geologic contexts worldwide.
We achieved a geologic model based on abundant geologic and subsurface data. For thefirst time, hundreds of subsurface data are collected, homogenized and integrated together withfield mapping to get a consistent shallow subsurface geological model for the assessment of local seismic response and seismic risk/hazard.
We focus the attention on geologic constraints aimed at the re-construction of the subsurface structural complexities (i.e. buried fault scarp), the 3D geometry of sedimentary bodies, their mutual relation-ships and the relations with the bedrock interface.
In this perspective, thematic maps such as the G-T Map need to preserve the basic geological data necessary to reconstruct 3D geologic units (sedimentary environment, lithology, age), useful to properly evaluate the seismic site effects.
The G-T Map proposed here derives from an implementation of the standard in the Italian guidelines for SM, with geological, geomor-phological, hydrogeological and structural data matched together in a map formed by 3 superposed layers: 1) geological units, 2) lithological-technical units, and 3) geomorphological/hydrogeological/structural features.
Our geological model coupled with the high-quality and rich data-base of HVSR data allow to make consideration on the applicability of the technique and on the expected results in the model margins iden-tified for extensional continental basin.
We propose 3 types of margin models for extensional continental basins (A-, B-, and C-type margins;Fig. 9).
The A-type margin, characterized by onlapping soft sediments on a gently dipping bedrock, without large fault-controlled steps, accounts for a simple H/V pattern with f0decreasing according to the cover se-diment thickness. The HVSR method proves to be efficient in such context, approximated to pseudo-1D-resonant model. Intercalations of coarse-grained alluvional deposits might cause high variability in the seismic waves velocities (i.e. Vs and Vp), resonance frequency and amplitude of the H/V peak.
In B- and C-type margins, characterized by sharp lateral variations due to boundary normal faults, seismic waves reverberation and local ground motion amplification in terms of frequency, amplitude and spatial variability are expected. In the B-type margin, the 2D-3D effects do not allow easy interpretations of the HVSR measurements, which show complex patterns. The f0is still recognizable, but it is less pro-minent than in simpler setting and it is often accompanied by second resonance peaks. In the C-type, the fault-controlled margin is covered by large coarse-grained alluvial fans. Noteworthy, the 2D-3D com-plexity of the margin is not evident by surface geology and the stiff gravel deposits on soft deposits cause seismic waves velocity inversion. Ourfindings also prove that the Level 1 SM is an indispensable step in a SM study for a first reconstruction of the shallow subsurface geology and the recognition of critical areas needing additional detailed analyses to resolve the uncertainties in evaluating local seismic hazard (e.g. 2D/3D complexities, seismic velocity inversions with depth; sus-ceptibility to permanent coseismic deformation).
Our analysis outlined a complex geological-resonant model for the studied area reveling that standard empirical laws or semi-quantitative
methods are often not adequate or applicable in many of the presented cases, thus inevitably introducing a bias in the resulting interpretation and inferences. In summary, the great challenge for supplying the most reliable information to seismic hazard practitioners is the good quality of the input data (i.e. geological, structural, geophysical and seismo-logical data) and the use of suitable methodoseismo-logical approaches able to constrain the uncertainties of the model and results.
Declaration of Competing Interest
The authors declare that they have no known competingfinancial interests or personal relationships that could have appeared to influ-ence the work reported in this paper.
Acknowledgements
The project was funded by Regione Abruzzo local authority (POR-FESR, IV, 3.1.c) and Italian National Department of Civil Protection (DPC) (art. 11, DL 39/2009) within an agreement between Regione Abruzzo and“G. d'Annunzio” University of Chieti-Pescara, Department DiSPuTer (Resp. P. Boncio). Scientific papers funded by DPC do not represent its official opinion and policies. This work has also benefited from founding provided by project MIUR-FIRB “Abruzzo” (code RBAP10ZC8K_007).
References
Aki, K., 1988. Local site effect on ground motion. In: Von Thun, J.L. (Ed.), Earthquake Engineering and Soil Dynamics. It: Recent Advances in Ground-Motion Evaluation Am. Sot. Civil Eng. Geotech. Spec. Publ, New York, pp. 103–155.
APAT, 2005. Italian Geological Map, Sheet n° 368 "Avezzano", Scale 1:50,000. APAT (Dipartimento Difesa del Suolo).
Bard, P.-Y., Bouchon, M., 1985. The two-dimensional resonance of sediment-filled val-leys. Bull. Seismol. Soc. Am. 75, 519–541.
Barton, N., 1978. International society for rock mechanics commission on standardization of laboratory andfield tests: Suggested methods for the quantitative description of discontinuities in rock masses. Int. J. Rock Mech. Min. Sci. Geomech. Abstr. 15, 319–368.https://doi.org/10.1016/0148-9062(78)91472-9.
Benedetti, L., Manighetti, I., Gaudemer, Y., Finkel, R., Malavieille, J., Pou, K., Arnold, M., Aumaître, G., Bourlès, D., Keddadouche, K., 2013. Earthquake synchrony and clus-tering on Fucino faults (Central Italy) as revealed from in situ 36Cl exposure dating. J. Geophys. Res. Solid Earth 118, 4948–4974.https://doi.org/10.1002/jgrb.50299. Bertini, T., Bosi, C., 1976. Sedimenti continentali probabilmente pliocenici nella Valle del Salto e della Conca del Fucino (Rieti e L'Aquila). Boll. Soc. Geol. Ital. 95, 767–801. Boncio, P., Galli, P., Naso, G., Pizzi, A., 2012. Zoning surface rupture hazard along normal
faults: insight from the 2009 Mw 6.3 L’Aquila, Central Italy, earthquake and other global earthquakes. Bull. Seismol. Soc. Am. 102, 918–935.https://doi.org/10.1785/ 0120100301.
Boncio, P., Amoroso, S., Vessia, G., Francescone, M., Nardone, M., Monaco, P., Famiani, D., Di Naccio, D., Mercuri, A., Manuel, M.R., Galadini, F., Milana, G., 2018. Evaluation of liquefaction potential in an intermountain Quaternary lacustrine basin (Fucino basin, Central Italy). Bull. Earthq. Eng. 16, 91–111.https://doi.org/10.1007/ s10518-017-0201-z.
Bonnefoy-Claudet, S., Cornou, C., Bard, P.-Y., Cotton, F., Moczo, P., Kristek, J., Fäh, D., 2006. H/V ratio: a tool for site effects evaluation. Results from 1-D noise simulations. Geophys. J. Int. 167, 827–837.https://doi.org/10.1111/j.1365-246X.2006.03154.x. Bosi, C., Galadini, F., Messina, P., 1995. Stratigrafia plio–pleistocenica della conca del
Fucino. Il Quaternario 8, 83–94.
Cara, F., Di Giulio, G., Cavinato, G.P., Famiani, D., Milana, G., 2011. Seismic character-ization and monitoring of Fucino Basin (Central Italy). Bull. Earthq. Eng. 9, 1961–1985.https://doi.org/10.1007/s10518-011-9282-2.
Carafa, M.M.C., Bird, P., 2016. Improving deformation models by discounting transient signals in geodetic data: 2. Geodetic data, stress directions, and long-term strain rates in Italy. J. Geophys. Res. Solid Earth 121, 5557–5575.https://doi.org/10.1002/ 2016JB013038.
Castenetto, S., Galadini, F., 1999. 13 gennaio 1915, il Terremoto Nella Marsica. Servizio Sismico Nazionale e C.N.R. Istituto di Ricerca sulla Tettonica Recente. Ist. Pol. Zecca dello Stato, Rome, Italy.
Cavinato, G.P., Carusi, C., Dall’Asta, M., Miccadei, E., Piacentini, T., 2002. Sedimentary and tectonic evolution of Plio–Pleistocene alluvial and lacustrine deposits of Fucino Basin (Central Italy). Sediment. Geol. 148, 29–59. https://doi.org/10.1016/S0037-0738(01)00209-3.
Centamore, E., Crescenti, U., Dramis, F., 2006. Note illustrative della Carta Geologica d’Italia alla scala 1:50.000, Foglio 368 “Avezzano”, APAT – Servizio Geologico d’Italia e Regione Abruzzo – Servizio Difesa del Suolo. pp. 115.
D’Agostino, N., Jackson, J.A., Dramis, F., Funiciello, R., 2001. Interactions between
F H/V F H/V F H/V F H/V
- Simple H/V pattern (pseudo-1D) - HVSR method higly efficient
F H/V F H/V F0 F1 F H/V F0 F1 - A can be > A
- Complex H/V pattern (F , F , masked F ) - HVSR can capture F , but poorly efficient
F H/V F H/V F0 F1
- 2D/3D complexities not evident from surface morfology - Same complexities as for B-Type, even more complex due to Vs inversion (attenuated A )
F H/V B - Type margin B - T ype margin C - Type m. 1D resonance
a
b
c
Old uplifted successions C - T ype m. Bedrock Boundary faults Boundaryfaults Mostly fine-grained
sediments (silt, clay)
Mostly coarse-grained sediments (gravel, sand) Intercalated coarse- (breccia, conglomerate) and fine-grained (silt, clay) sediments
A - Type
F decreases0 to 1D
a
Variability (Vs, F , A ) due to0 0intercalated coarse-grained sediments
B - Type
b
2D/3D complexity C - Typec
2D/3D complexity Vs inversion 10² m 10² m 10² mFig. 9. Geological model for fault-controlled Fucino basin and schematic 2D-sections for (a) A-type, (b) B-type and (c) C-type margins. The geophysical results expected along the margins are also shown.