Ital. J. Food Sci., vol. 32, 2020 - 367
PAPER
VALORIZATION OF RED GRAPE
(VITIS VINIFERA CV. SANGIOVESE) POMACE
AS FUNCTIONAL FOOD INGREDIENT
G. CARULLO1, U.G. SPIZZIRRI1, M.R. LOIZZO*1, M. LEPORINI1, V. SICARI2,
F. AIELLO1 and D. RESTUCCIA1
1Department of Pharmacy, Health and Nutritional Sciences, University of Calabria, 87036 Rende, CS, Italy 2Department of Agricultural Science, Mediterranean University of Reggio Calabria, 89123 Reggio Calabria,
Italy
*Corresponding author: [email protected]
ABSTRACT
The winemaking process generates large amounts of by-products that are still a potential source of bioactive compounds to be used as functional food ingredients. This study is aimed to develop a cow milk kefir fortified with Sangiovese red grape pomace. The phenolic extracts of skins and seeds, which were obtained after infusion and ultrasound-assisted extraction (UAE), were rich in (+)-catechin (105.0±147.0 mg/L) and (-)-epicatechin (76.0±364.0 mg/L) based on HPLC-DAD analysis. The UAE-derived skin extracts were selected for their best antioxidant effectiveness and incorporated into kefir, whose functional properties have been investigated through spectrophotometric assays. The addition of UAE-derived skin extract to kefir was significantly effective in enhancing the total phenolic content (43.2 %) thus increasing the total antioxidant capacity (+47.7 %) and lowering IC50 ABTS (-36.0%) and DPPH (-31.45%). An increased inhibitory activity towards
α-amylase, α-glucosidase and pancreatic lipase was also achieved by decreasing the corresponding IC50 values (69.39 and 73.01 "g/mL, respectively).
Keywords: antioxidant activity, kefir, grape pomace, ultrasound-assisted extraction, HPLC-DAD, metabolic
Ital. J. Food Sci., vol. 32, 2020 - 368 1. INTRODUCTION
Grape pomace is the most abundant by-product during the winemaking process, mainly composed by the grape skin and seeds. Huge amounts of this winery waste are generated every year, posing environmental and economic issues for their polluting load and disposal costs (DWYER et al., 2014; BERES et al., 2017; GARCÍA-LOMILLO et al., 2017.). Possible uses set by the European Regulation No. 555/2008 (EU, 2008) consider the exploitation of winery by-products for energy production, animal feeding, soil fertilization or ingredients recovery to be included in pharmaceutical, cosmetic and food processes. In particular, the latter aspect has gained much attention in recent years as many applications have been reported dealing with the enhancement of bioactive molecules from grape pomace for functional food design (GALANAKIS, 2012; YU and AHMEDNA, 2013; RESTUCCIA et al., 2019). Polyphenols from winery wastes represent one of the most attractive phytochemicals due to their health-promoting properties including effect on metabolic syndrome (MetS) (XIA et al., 2010; YU and AHMEDNA, 2013; XIA et al., 2014; TEIXEIRA et al., 2014; JARA-PALACIOS et al., 2015; CHIVA-BLANCH and BADIMON, 2017). Phenolics are usually used for fortification of many food products, including fish and seafood, meat, juices as well as bakery and dairy products (FERNÀNDEZ-MARÌN et
al., 2013; FONTANA et al., 2013; BERES et al., 2017; GARCÍA-LOMILLO et al., 2017).
MetS is characterized by several medical conditions including high blood glucose levels, high serum triglycerides, low value of high-density lipoprotein (HDL), and high blood pressure. MetS is associated with several diseases including cardiovascular diseases, heart failure, stroke, hyperuricemia, fatty liver, polycystic ovarian syndrome, erectile dysfunction, and diabetes (MENDRICK et al., 2018). Frequently, patients with MetS are overweight or obese. In these patients a progressive reduction in insulin secretion coupled with a progressive rise in insulin resistance are present. Moreover, a persistent blood hyperglycaemia determined, at cytosolic and mitochondrial level, an over production of Reactive Oxygen Species (ROS) (KANETO et al., 2010). To this regard, a topic of great interest is represented by the diet supplementation with functional foods. In fact, different studies indicated their positive effect on the body weight reduction; their action seemed to be related to the inhibition of the digestive enzymes interfering with the hydrolysis and absorption of lipids and carbohydrates (i.e. α-amylase, α-glucosidase and pancreatic lipase) (TUNDIS et al., 2018; LOIZZO et al., 2019).
Recently, AKABERI and HOSSEINZADEH (2016) proposed the use of grapes for MetS syndrome treatment. It is well know that grapes are rich in proanthocyanidins that have been used for diverse dedications such as antioxidants, nutritional supplements, preventing atherosclerosis, managing cardiovascular complications, to treat dyslipidaemia, other than as free radical scavenging and lipid lowering. Furthermore, several scientific studies and applications, confirmed the absence of toxicity of the tested grape pomace extracts (BLADÉ et al., 2016; COSTABILE et al., 2019; CARULLO et al., 2019). In this context, the goal of this research was focused on the realization of a new milk kefir, obtained by the addition of a Sangiovese pomace extract during the kefir preparation. The supplementation was accomplished in order to improve the antioxidant profile and the impact on metabolism. For this purpose, the grape skin and seeds extracts, obtained by two different procedures, infusion (a classical method) and ultrasound-assisted method (innovative and time-saving), were chemically investigated by HPLC analyses and the antioxidant activity was also monitored. Skin extract obtained by ultrasound-assisted extraction (UAE) resulted the most interesting extract and it was added to kefir grains and skimmed milk. Successively, the enriched product was tested for its antioxidant and
Ital. J. Food Sci., vol. 32, 2020 - 369
hypoglycaemic features by in vitro colorimetric assays, α-amylase and α-glucosidase inhibition tests. The hypolipidemic effects by pancreatic lipase inhibition were also assessed.
2. MATERIALS AND METHODS 2.1. Materials and chemicals
Sangiovese pomace was kindly given by Le Moire farm (Catanzaro, Italy) during September 2019. Cell culture and cell culture materials were obtained from Sigma-Aldrich Chemical Co. Ltd (Milan, Italy). All chemicals and reagents used in this study were purchased from Sigma-Aldrich Chemical Co. Ltd (Milan, Italy) and VWR International (Milan, Italy).
2.2. Preparation of the grape extracts
Skins and milled seeds (30 g), obtained by manually separation from Sangiovese pomace, were added of 200 mL ethanol/water mixture (50:50 v/v) acidified at pH=2 with HCl 37% (v/v) (CARRERA et al., 2012; GONÇALVES et al., 2017). The mixture was then subjected to ultrasound assisted extraction (UAE) at 30°C for 15 minutes (10 cycles/sec), at an ultrasonic frequency of 40 kHz using the ultrasound-bath Branson model 3800-CPXH (Milan, Italy). Alternatively, skins and seeds were immersed in a solution ethanol/water (80:20 v/v) and heated at 60°C for 60 minutes. The two procedures were repeated three times. The mixtures were then filtered out and concentrated under reduced pressure using a rotary evaporator Buchi RII®. Ration extraction between grape sample and solvent
mixture was 1:6. All the extracts were stored at -18°C until analyses. The obtained samples were labelled as A (skin extract obtained after UAE); B (skin extract obtained after infusion); C (seed extract obtained after UAE) and D (seed extract obtained after infusion). 2.3. Determination of D-(+)-glucose, D-(−)-fructose and organic acids
The sugars level in Sangiovese skin and seed extracts was performed using a Knauer high liquid chromatography system (Asi Advanced Scientific Instruments, Berlin, Germany) equipped with a Knauer HPLC Pump K-120 (Asi Advanced Scientific Instruments, Berlin, Germany), a Rheodyne injection valve with loop of 20 "L and a Smartiline RI detector 2300. Elution was obtained on a VARIAN Meta Carb H Plus column (300 mm× 7.8 I.D., 5 "m). The column temperature was 55°C and the flow rate was 0.25 mL/min. The mobile phase consisted of 0.01 N H2SO4 solution. The HPLC analyses of organic acids were
performed on a Knauer (Asi Advanced Scientific Instruments, Berlin, Germany) system equipped with two pumps Smartiline Pump 1000, a Rheodyne injection valve (20 "L) and a photodiode array detector UV/VIS equipped with a semi-microcell. Separation was obtained using an Acclaim OA column (250 mm×4.0 I.D., 5 "m) at T = 30°C. The mobile phase consisted of 100 mM Na2SO4 (pH =2.65 with methane sulfonic acid) and the flow rate
was 0.6 mL /min. Stock solutions of each standard, in different diluted concentration ranging from 0.2-2 g/L, were prepared in ultra-pure water provided by a Milli-Q system (Millipore Co., Bedford, MA). All solutions were filtered through 0.45 "m glass-microfiber GMF Whatman chromatographic filter (HAWP Millipore Co., Bedford), before analysis.
Ital. J. Food Sci., vol. 32, 2020 - 370
2.4. Phenolic characterization of Sangiovese skin and seed extracts
High performance liquid chromatography coupled to a diode array detector (HPLC-DAD) was applied to determine the phenolic profile of Sangiovese grape skin and seed extract (KAMMERER et al., 2004). The analysis was performed on a Knauer system (ASI - Advanced Scientific Instruments, Berlin, Germany) equipped with two Smartiline Pump 1000 pumps, a Rheodyne injection valve (20 µL) and a UV - VIS photodiode series detector equipped with a semi-microcell. Compounds were separated according the procedure previously described by LOIZZO et al. (2019) and monitored at 280, 254, 330 and 305 nm. Compounds identification and quantification were carried out by comparing the spectra and relative retention times of Sangiovese extracts peaks with those obtained by injecting pure standards as selected marker (gallic acid, (+)-catechin and (-)-epicatechin, catechin, caffeic acid, rutin, trans-resveratrol, and quercetin).
2.5. Measurement of the total phenolic content (TPC) and total anthocyanins (TA)
The total phenolic content (TPC) was detected in the phenolic extracts of grape seeds and skins and kefir or fortified kefir, according to the Folin-Ciocalteu colorimetric method of RESTUCCIA et al. (2011). Briefly, a 6.0 mL volume of each properly diluted sample was added with 1.0 mL of Folin-Ciocalteu reagent and after 3 min with 3.0 mL of 5.0% w/v Na2CO3. Positive control and blank solutions was also prepared by substituting the sample
with the same volume of 0.1 (w/v) ascorbic acid and hydro alcoholic solution (50:50 v/v), respectively. After shaking for 2 h, the absorbance value of each mixture was measured at 760 with a Jasco V-530 UV/Vis spectrometer (Jasco, Tokyo, Japan). The TPC was expressed as mg of gallic acid equivalents (GAE) per g of extract for samples A-D and mg GAE per L for kefir (M2) and fortified kefir (M2A10).
The total anthocyanins (TA) was determined using the differential pH method (LOIZZO et
al., 2019). Anthocyanins undergo a reversible modification of the structure with a change
in the pH that occurs with a variation in the absorbance spectrum. Seven and half mg of extract were added to 5 mL of distilled water. For each sample two dilutions were prepared, one with a 0.025 M hydrochloric acid buffer solution at pH 1, and the other with a 0.4 M sodium acetate buffer solution at pH 4.5, corrected with hydrochloric acid. The solutions were left to equilibrate for 15 min. Spectrophotometric reading was per-formed at 510 nm and 700 nm. The results were expressed as cyanidine-3-O-glucoside equivalent (CGE) per g of extract.
2.6. Determination of total antioxidant capacity (TAC)
A literature protocol, with few changes was employed to determine total antioxidant capacity (TAC) of each extract, kefir or fortified kefir (CIRILLO et al., 2012). Briefly, 0.3 mL of hydro alcoholic solution (50:50 v/v) of sample were added to 1.2 mL of reagent solution (0.6 M H2SO4, 28.0 M Na3PO4, and 4.0 M (NH4)2MoO4). The reaction mixture was incubated
at 95°C for 150 min and after cooling to room temperature, the absorbance of the mixture was measured at 695 nm. Positive control and blank solutions was also prepared by substituting the sample with the same volume of 0.1 (w/v) ascorbic acid and hydro alcoholic solution (50:50 v/v), respectively. The total antioxidant activity of each extract was expressed as mg of catechin equivalent (CTE) per g of extract for samples A-D and mg CTE per L for kefir (M2) and fortified kefir (M2A10).
Ital. J. Food Sci., vol. 32, 2020 - 371 2.7. Determination of scavenging activity on DPPH radicals
Free radical scavenging properties of the extracts were estimated towards DPPH (2,2-diphenyl-1-picrylhydrazyl)acid)) radical (SPIZZIRRI et al., 2011). Briefly, in a volumetric flask (10 mL) were placed 1.0 mL of hydro alcoholic solution (50:50 v/v) of each extract, kefir or fortified kefir, 4.0 mL of hydroalcoholic solution (50:50 v/v) and 5.0 mL of ethanol solution of DPPH (200 "M), obtaining a solution of DPPH with a final concentration of 100 "M. The solution was incubated at 25°C and, after 24 h, the absorbance of the remaining DPPH was determined at 517 nm. Ascorbic acid 0.1 (w/v) was used as positive control. The scavenging activity of the tested matrices was measured as the decrease in absorbance of the DPPH and it was expressed as IC50, defined as the concentration of sample that
causes a decrease in the initial DPPH concentration by 50%.
2.8. Determination of scavenging effect on the ABTS radical cation
Free radical scavenging properties of the extracts were estimated in aqueous media towards ABTS (2,2'-azino-bis (3-ethylbenzothiazoline-6-sulphonic acid)) radical (RESTUCCIA et al., 2017) ABTS radical cation (ABTS.+) solution (7.0 mM) remains in the
dark at room temperature for 12-16 h, and then the concentration was adjusted to an absorbance of 0.70±0.02 at 734 nm. In a general procedure, the scavenging effect of the samples was evaluated by adding 500 µL of hydroalcoholic solution (50:50 v/v) on each extract, kefir or fortified kefir at 2.0 mL of the ABTS.+ radical solution. The mixture was
incubated in a water bath at 37°C and protected from light. The decrease of absorbance at 734 nm was measured at the endpoint of 5 min. Ascorbic acid 0.1 (w/v) was used as positive control. The antioxidant activity was measured as the decrease in absorbance of the ABTS and it was expressed as IC50, defined as the concentration of sample that causes a
decrease in the initial ABTS concentration by 50%. 2.9. Kefir preparation and enrichment
Three mg of fresh kefir grains (Kefiralia, Burumart Commerce S.L, Spain) were added in a glass flask at room temperature, containing 3 mL, of six type of commercially available milks. The container not-hermetically closed, was posed at 20-25°C for 24 hours with or without the addition of the extract. The six types of milk, purchased in a local market, were labeled Ultra High Temperature (UHT) whole milk (M1), skimmed milk (M2) and partially skimmed milk (M3), pasteurized fresh whole milk (M4), skimmed milk (M5), and partially skimmed milk (M6). The kefir grains obtained by each milk type were finally weighted and the pH value measured by using the pH 211 Microprocessor pH Meter (HANNA Instruments Italia, Milan, Italy). The enriched kefir was obtained mixing 1.0, 5.0 and 10.0 mg of the A extract with 10.0 mL of M2 in the same experimental conditions in which pH was measured.
2.10. Carbohydrate hydrolysing enzymes inhibition assay
The carbohydrate-hydrolyzing enzymes inhibition was detected following the procedure previously described by LEPORINI et al., (2020). α-Amylase (0.0253 g in 100 mL of cold water) was mixed with starch solution (0.125 g of potato starch in 25 mL of 20 mM sodium phosphate buffer and 6.7 mM sodium chloride. The mixture was stirred for 15 min at 65°C. Sangiovese pomace samples, freeze-dried kefir and enriched kefir at concentrations
Ital. J. Food Sci., vol. 32, 2020 - 372
ranging from 25 to 1000 µg/mL were added to starch solution and left to react with enzyme at 25°C for 5 min. The absorbance was read at 540 nm. In the α-glucosidase assay a maltose solution (12 g of maltose in 300 mL of 50 mM sodium acetate buffer) was mixed with α-glucosidase (1 mg of enzyme in 10 mL of ice cold distilled water) and o-dianisidine (DIAN) (LOIZZO et al., 2019). The peroxidase/glucose oxidase (PGO) system-colour reagent solution was obtained by dissolving one capsule in 100 mL of ice-cold distilled water. Samples (pomace extracts, freeze-dried kefir and freeze-dried enriched kefir) at concentrations ranging from 25 to 1000 µg/mL were added to 250 µL maltose solution and 5 µL enzyme and left to incubate at 37°C for 30 min. Then, perchloric acid was added and the mixture was centrifuged. The supernatant was collected and mixed with DIAN and PGO, and left to incubate at 37°C for 30 min. The absorbance was read at 500 nm. Acarbose was used as positive control in both assays. The IC50 value for each sample,
defined as the concentration of sample causing 50% enzyme inhibition was determined from the curves plotted and tabulated.
2.11. Pancreatic lipase inhibitory activity
Pancreatic lipase inhibitory activity was determined by 96-well plate method based on the procedure proposed by EL-SHIEKH et al. (2019). 4-Nitrophenyl octanoate (NPC), 5 mM in dimethylsulfoxide solution and an aqueous solution of porcine pancreatic lipase enzyme (1 mg/mL), and Tris‐HCl buffer (pH 8.5) were prepared. Pomace extracts, freeze-dried kefir and freeze-dried enriched kefir at concentrations ranging from 2.5 to 40 mg/mL were added in a well with 6 "L of the enzyme, 6 "L of NPC and 279 "L of buffer. The mixture was incubated at 37°C for 30 min. The absorbance was measured at 405 nm. Orlistat was used as a positive control. The IC50 value for each sample, defined as the concentration of
sample causing 50% enzyme inhibition, was determined from the curves plotted and tabulated.
2.12. Statistical analysis
All of the data obtained from three replicates (n=3) were presented as mean±standard deviation (SD) were subjected to One-way analysis of variance (ANOVA) using Prism GraphPad Prism version 4.0 for Windows, GraphPad Software (San Diego, CA, USA). After that, the Tukey’s test was performed to compare all means. Differences among means with p<0.05 were accepted as representing statistically significant. Dunnett’s test was used to compare each mean of biological data to a positive control mean. Differences among means with ****p<0.0001; ***p<0.001; **p<0.01 were accepted as representing statistically significant.
3. RESULTS AND DISCUSSION
3.1. Chemical composition of Sangiovese pomace skin and seeds extracts
Grape sugar and acid were monitored by HPLC-RI. Glucose was particularly abundant in sample A followed by B. Differently, fructose was more present in skin extract obtained after infusion (sample B) (13.98 g/100g) (Table 1). Tartaric acid was the most abundant acid in all samples except seed extract obtained after infusion (sample D).
Ital. J. Food Sci., vol. 32, 2020 - 373
Table 1. Sugar and acids in Sangiovese skins and seeds extracts.
Glucose (g /100 g) Fructose (g/100 g) Tartaric acid (g/L) Malic acid (g/L) Lactic acid (g/L) Acetic acid (g/L) Fumaric acid (g/L) A 13.79±0.11a 6.01±0.11b 7.81±0.10a 4.86±0.04a 1.82±0.05a 2.68±0.04d 0.005±0.004a B 13.14±0.12b 13.98±0.20a 4.64±0.09c 1.67±0.03d 0.09±0.03d 3.25±0.01b 0.006±0.002a C 0.71±0.07d 0.32±0.07d 6.71±0.14b 2.61±0.04b 0.80±0.04b 4.51±0.04a 0.003±0.001a D 1.17±0.08c 1.19±0.24c 2.74±0.11d 1.78±0.06c 0.46±0.02c 3.05±0.04c 0.003±0.003b
A (skin extract obtained after UAE); B (skin extract obtained after infusion); C (seed extract obtained after UAE) and D (seed extract obtained after infusion). Data are expressed as mean ± standard deviation (SD) (n= 3). Means within each column and with different lowercase letters are statistically different according to Tukey’s test (p<0.05).
Vitis vinifera genotypes, environmental factors, postharvest treatments and applied
extraction procedure for recovery of polyphenolic compounds influenced their amount in the grapes extracts (SPIGNO and DE FAVERI, 2007; BUCIĆ-KOJIĆ et al., 2009). Grape skins and seeds TPC was evaluated by Folin-Ciocalteu procedure, an analytical methodology based on the electrons transferring from phenolic compounds to the Folin-Ciocalteu reagent in an alkaline medium. The TPC values of grape skins and seeds appear strictly related both to raw material (seeds or skins) and extraction procedure (infusion or UAE), as reported in the Table 2.
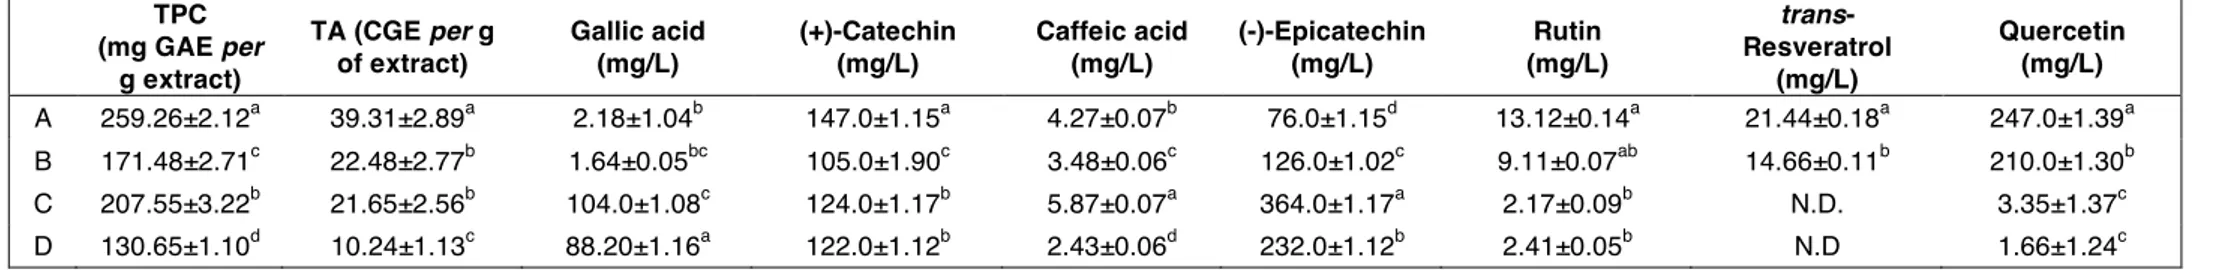
The TPC in the grape extracts examined in this study ranged from 130.65 to 259.26 mg GAE per g of extract. Generally, for both raw materials, UAE procedure appeared more useful than the infusion technique and higher amounts of TPC were detected in the skins (259.26 mg GAE per g of extract, for A), compared with the seed extracts (207.55 mg GAE
per g of extract, for C).
The TA content ranged from 39.31 to 10.24 CGE per g of extract for skin extract obtained after UAE and seed extract obtained after infusion, respectively. Our data are in the same order of magnitude of those reported by MENDOZA et al. (2012).
From HPLC analysis gallic acid, (+)-catechin and (-)-epicatechin, catechin, caffeic acid, rutin, trans-resveratrol, and quercetin were identified (Table 2). Different levels of phenolic compounds could be detected from seed and skin.
Ital. J. Food Sci., vol. 32, 2020 - 374
Table 2. TPC and phenolic profile of Sangiovese skins and seeds extracts.
TPC (mg GAE per g extract) TA (CGE per g of extract) Gallic acid (mg/L) (+)-Catechin (mg/L) Caffeic acid (mg/L) (-)-Epicatechin (mg/L) Rutin (mg/L) trans- Resveratrol (mg/L) Quercetin (mg/L) A 259.26±2.12a 39.31±2.89a 2.18±1.04b 147.0±1.15a 4.27±0.07b 76.0±1.15d 13.12±0.14a 21.44±0.18a 247.0±1.39a B 171.48±2.71c 22.48±2.77b 1.64±0.05bc 105.0±1.90c 3.48±0.06c 126.0±1.02c 9.11±0.07ab 14.66±0.11b 210.0±1.30b C 207.55±3.22b 21.65±2.56b 104.0±1.08c 124.0±1.17b 5.87±0.07a 364.0±1.17a 2.17±0.09b N.D. 3.35±1.37c D 130.65±1.10d 10.24±1.13c 88.20±1.16a 122.0±1.12b 2.43±0.06d 232.0±1.12b 2.41±0.05b N.D 1.66±1.24c
A (skin extract obtained after UAE); B (skin extract obtained after infusion); C (seed extract obtained after UAE) and D (seed extract obtained after infusion). N.D.: Not detected. Data are expressed as mean ± standard deviation (SD) (n= 3). Means within each column and with different lowercase letters are statistically different according to Tukey’s test (p<0.05).
Ital. J. Food Sci., vol. 32, 2020 - 375
Generally, (+)-catechin and (-)-epicatechin represent the main abundant compounds with values in the range105.0-147.0 and 76-364 mg/L, respectively. The applied extraction procedure, influenced a lot the amount of gallic acid. In fact, both C and D are characterized by the highest amount with values of 104.0 and 88.20 mg/L, respectively. A similar consideration could be done for trans-resveratrol and quercetin that are concentrated only in B and A samples (values of 14.66 and 21.44 mg/L, and 210.0 and 247.0 mg/L, respectively). According to our data, both catechin and epicatechin were the main abundant compounds of seeds from V. vinifera cv. Frankovka as reported by BUCIĆ-KOJIĆ et al., 2009. Significant amount of gallic acid were also found by Doshi et al., (2015) that evaluated the phenolic profile of Pusa Navarang and Merlot seeds and skin. In particular, Pusa Navarang seed extract showed high amounts of catechin and epicatechin whereas quercetin was abundant in its skin extract. According to our data, trans-resveratrol was detected only in skin with values of 34.5 and 37.5 mg/L for Pusa Navarang and Merlot varieties, respectively. These values are twofold higher than that found in Sangiovese samples. According to GODEVAC et al., (2010) the phenolic composition of grape seed extracts from V. vinifera cv., Prokupac, Smederevka, Italian Riesling, Traminer, Black Burgundy, Gamay Noir, Muscat Hamburg and Gamay Bojadiser, showed the flavan-3-ol monomers as the main abundant compounds especially in seeds derived from red wine grapes. Regarding rutin, our data showed that this flavonoid glycoside was more concentrated in skin than seeds. However, GENGAIHI et
al., (2014) evidenced a main content of rutin in both Red romy and Grenache noir seeds.
Quercetin-3-O-glucoside (39.86 "g/g dry sample), rutin (37.01 "g/g dry sample) and
trans-resveratrol (32.88 "g/g dry sample) were the most abundant compounds identified
in V. tiliifolia skin (JIMÉNEZ et al., 2018). The results recorded in the TPC determination are partially in agreement with the concentration of polyphenols recorded by HPLC-DAD. However, in this comparison it is necessary to consider the contribute of the single class of molecules to TPC value and the contribution of others compounds, such as pigments like anthocyanin, present at high concentration in the grape skins (BABBAR et al., 2011). Furthermore, it should be pointed out that some non-phenolic components also having reducing capacity, such as organic sugars and acids, affect the TPC value, leading to overestimated total phenolic contents. Finally, phenolic compounds differently react with the Folin-Ciocalteu reagent and several flavonoid molecules produce poor responses, leading to an underestimated TPC value (CIRILLO et al., 2016).
3.2. Evaluation of the antioxidant properties of Sangiovese skin and seed extracts
The results concerning the antioxidant activity expressed as total antioxidant capacity (TAC) and radical scavenging activity in aqueous and organic environments appear quite related to TPC values. Specifically, TAC values, as reported in Fig. 1, highlighted as sample A returned the most significant result (326.54 mg CTE per g extract), emphasizing the existence of a positive relationship between TPC and TAC.
Some recorded dissimilarities can be explained invoking structural differences in the phenolic molecules that affected antioxidant power of the extracts. Literature data indicate that the presence of others interfering molecules, often prevent a linear correlation between TPE and antioxidant activity (FERNANDO et al., 2018). The ability of the extracts as scavenger of lipophilic DPPH radical was expressed in terms of IC50 and reported in
Ital. J. Food Sci., vol. 32, 2020 - 376
Figure 1. TAC values of Sangiovese pomace samples. A (skin extract obtained after UAE); B (skin extract
obtained after infusion); C (seed extract obtained after UAE) and D (seed extract obtained after infusion).
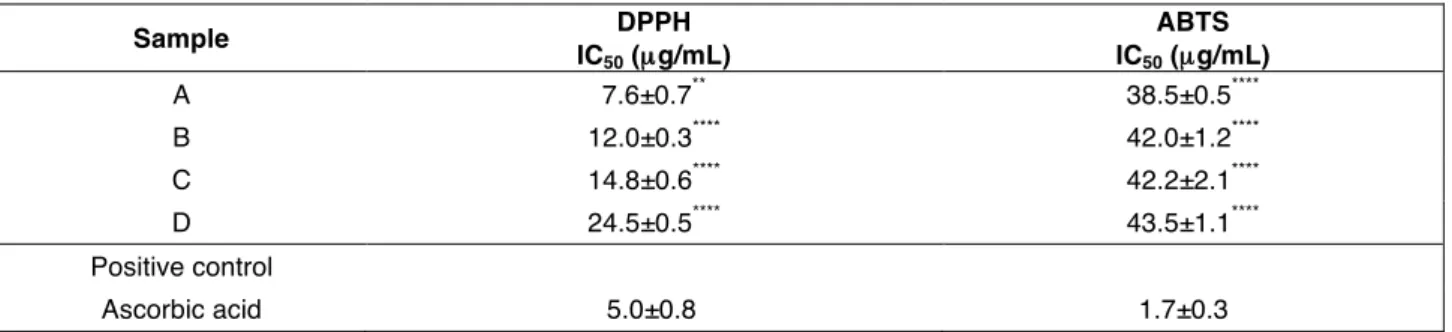
A comparison of IC50 values shows that skins extracts (7.6 and 12.0 µg/mL for A and B,
respectively) returned 2-times lower values compared to the seeds extracts. A comparison of this data with the HPLC-DAD analyses displayed as the solubility of recorded polyphenol plays an important role in the lipophilic scavenger activity. In particular, the high concentration of quercetin recorded in the skins extracts (both UAE and infusion extraction methodologies) justified the better performances recorded for A and B. Moreover, UAE process appears in both cases the better technique leading to lower IC50
values. The recorded data showed quite correspondence with the results of TAC and TPE. This trend is evident for both the samples and some discrepancies could be justified by considering the different environment (organic and aqueous) in which the assays were performed. The scavenging capacity of the extracts in the aqueous environment against the ABTS radical was expressed in terms of IC50 value, and Table 3 displayed the recorded
data.
Table 3. Radical scavenging activity of extracts from skins and seeds of Sangiovese cv grape.
A (skin extract obtained after UAE); B (skin extract obtained after infusion); C (seed extract obtained after UAE) and D (seed extract obtained after infusion). Data are expressed as mean ± S.D. (n = 3). Differences within and between groups were evaluated by One-way analysis of variance test followed by a multicomparison Dunnett’s test compared with the positive control (****p<0.0001; ** p<0.01).
The analysis of the IC50 values exhibited comparable values for both matrices and the
extraction methodologies did not deeply affect the result. However, the scavenging
Sample DPPH IC50 (µg/mL) ABTS IC50 (µg/mL) A 7.6±0.7** 38.5±0.5**** B 12.0±0.3**** 42.0±1.2**** C 14.8±0.6**** 42.2±2.1**** D 24.5±0.5**** 43.5±1.1**** Positive control Ascorbic acid 5.0±0.8 1.7±0.3
Ital. J. Food Sci., vol. 32, 2020 - 377
activity recorded in the aqueous environment appeared more than three times lower compared with the organic one. Lack of data concerning extracts antioxidant capacity of the investigated cultivars made very hard to compare the collected values with the literature analyses. In addition, many factors, such as fruit ripening, weather conditions, soil and place of growth, largely affect the distribution of the antioxidants in the vegetable matrix, further complicating whatever qualitative-quantitative comparison (TANG et al., 2018). The juxtaposition of these data with the HPLC-DAD analyses underlined also that the solubility of the recorded polyphenol plays an important role in the lipophilic scavenger activity. In particular, the high concentration of quercetin recorded in the skins extracts (UAE or infusion extraction method), justified the better performances recorded for sample B and A.
3.3. Kefir enrichment
As already stated, six types of milk have been considered for kefir preparation to underline the effect of different raw materials on kefir production (i.e grains growth and pH decrease). As summarized in Table 4, after 24 hours, all the considered samples produced a positive variation of the kefir grains mass as well as a decrease in pH values. Considering the obtained data (mass and pH) in the same experimental conditions, we decided to enrich only the skimmed milk (M2), which showed the lower kefir grains mass variation, in order to evaluate the improved effect of extract addition. Noteworthy, skimmed milk is mostly requested by female population and health fanatics, due to the poor fats content. Comparison between M2, M5 and M6, in terms of mass variation and pH decrease, supported the choice to use the former to obtain the functional beverage by adding 1, 5, 10 mg of extract A to 10 mL of M2, before grains addition (DOS SANTOS et
al., 2017). Addition levels have been carefully selected to avoid possible antimicrobial
effects exerted by wine polyphenols on kefir microorganisms (GARCÍA-LOMILLO et al., 2014; KATALINIĆ et al., 2010). The highest addition level, in fact corresponded to 0.1% w/w or to a supplementation equivalent to 25.9 mg GAE/100g of kefir.
Table 4. Milk type screening.
Sample mass (g) Mass
variation pH pH decrease t (h) = 0 t (h) = 24 t (h) = 0 t (h) =24 M1 0.30±0.01 0.37±0.02b 0.07±0.01c 6.98±0.02 4.71±0.01d 2.27±0.01c M2 0.29±0.01 0.31±0.01c 0.02±0.01d 6.99±0.01 4.42±0.01f 2.57±0.01a M3 0.29±0.02 0.44±0.01a 0.15±0.02a 7.01±0.02 5.54±0.02a 1.47±0.02e M4 0.30±0.02 0.44±0.02a 0.14±0.02a 7.02±0.01 4.76±0.02c 2.26±0.01c M5 0.29±0.01 0.39±0.01b 0.10±0.01b 6.97±0.02 4.98±0.01b 1.99±0.01d M6 0.31±0.02 0.41±0.02b 0.10±0.02bc 7.00±0.01 4.65±0.01e 2.36±0.01b
Data are expressed as mean ± standard deviation (SD) (n= 3). Means within each column and with different lowercase letters are statistically different according to Tukey’s test (p<0.05).
As we recently reported (CARULLO et al., 2020) for the same kind of samples, the applied fortification level ensured proper activity of LAB and yeasts, at the same time, improving antioxidant features and avoiding possible drawbacks. Metabolomics analyses of the kefir
Ital. J. Food Sci., vol. 32, 2020 - 378
extracts, in fact, revealed the same compounds produced during fermentation with and without addition, demonstrating that metabolic pathways of LAB and yeasts were not influenced by the presence of the wine pomace extracts, at least under the qualitative point of view (CARULLO et al., 2020). Under the technological point of view, TSENG and ZHAO (2013) found that the addition of grape pomace flour to milk at levels higher than 3%, produced an excessive syneresis of yogurt while at levels higher than 5% the coagulation was inhibited. Considering sensory features, grape extract at 1% improved the acceptability of yogurt (KARAASLAN et al., 2011) and only reaching fortification with skin wine pomace at 6% induced decrease in the liking score, especially for the taste and flavor (MARCHIANI et al., 2016). All considered, the supplementation levels employed in this research are far below those generally found in literature and regarded as producing adverse effects.
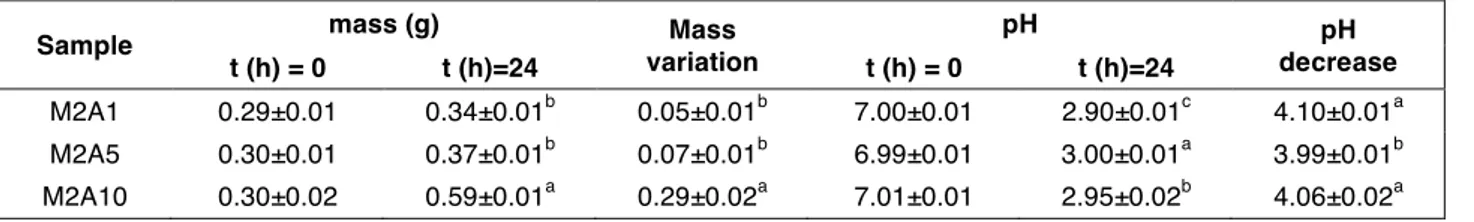
The kefir grains (i.e. M2A1, M2A5 and M2A10) were weighted and their pH was measured after fortification and after 24 h of activity. As reported in Table 5, the kefir grains presented different weights, in particular M2A10 resulted the heaviest, although pH values resulted similar among the three kefirs. For this reason, considering that a similar pH value agrees with a similar chemical composition, we decided to investigate only the heaviest kefir (M2A10) for their properties in metabolic syndrome (CARULLO et
al., 2020; SETTANNI et al., 2019). By the comparison between unfortified kefir (M2) with
M2A1, M2A5 and M2A10 showed a lower pH decrease probably in relation with high sugars and organic concentration found in the wine pomace extract. More sugars in the environment mean more lactic acid in kefir, thus producing the strong pH decrease. At the same time, wine organic acids can be metabolized and/or partially remain after fermentation. In the latter case, they obviously contribute to the pH decrease. A significant increase in TPC concentrations was observed in M2A10 that showed a TPC of 393.32 mg GAE per L in comparison to unfortified kefir (M2) that showed a TPC of 274.74 mg GAE
per L, as a consequence of the addition of the extract to the unfermented milk before the
kefir production. In general, this value appears in accordance with literature data confirming that during the fermentation process, irregular changes in the total phenol content of kefir samples can be observed, due to the biotransformation of phenolic compounds (KARAASLAN et al., 2011; NAJGEBAUER-LEJKO and SADY, 2015; PERNA et
al., 2019; OZCAN et al., 2019).
Table 5. Screening of the enriched kefir samples.
Sample mass (g) Mass
variation pH pH decrease t (h) = 0 t (h)=24 t (h) = 0 t (h)=24 M2A1 0.29±0.01 0.34±0.01b 0.05±0.01b 7.00±0.01 2.90±0.01c 4.10±0.01a M2A5 0.30±0.01 0.37±0.01b 0.07±0.01b 6.99±0.01 3.00±0.01a 3.99±0.01b M2A10 0.30±0.02 0.59±0.01a 0.29±0.02a 7.01±0.01 2.95±0.02b 4.06±0.02a
Data are expressed as mean ± standard deviation (SD) (n= 3). Means within each column and with different lowercase letters are statistically different according to Tukey’s test (p<0.05).
Ital. J. Food Sci., vol. 32, 2020 - 379
3.4. Evaluation of the functional properties of kefir fortified with UAE-derived Sangiovese skin extract
Polyphenol compounds influence the composition of microbiota by the inhibition of pathogen growth and the stimulation of the commensal bacteria growth and these changes appear deeply related to their chemical structure and concentration (CUEVA et al., 2010). The action of fermentative enzyme, such as β-glycosidase, produces the hydrolysis of complex phenolic compounds to simpler types producing a significant increase of the total phenolic content (CODA et al., 2012). A further increase of the antioxidant activity can be obtained by milk supplementation, before the fermentation process, with a source of bioactive molecules. These compounds can interact with the milk proteins determining changes in the microbiological quality and oxidative stability of the dairy products. The results of antioxidant activity (TAC and DPPH free radical scavenging assays) showed that enriched kefir had higher antioxidant activity than unfortified kefir (Fig. 2 and Table 6).
Table 6. Radical scavenging activity of kefir from skins and seeds of Sangiovese cv grape.
Kefir sample DPPH IC50 (µg/mL) ABTS IC50 (µg/mL) M2 107.0± 2.9**** 498.3±8.2**** M2A10 73.4±1.7**** 318.7±7.4**** Positive control Ascorbic acid 5.0±0.8 1.7±0.3
Data are expressed as mean ± SD (n = 3). Differences within and between groups were evaluated by One-way analysis of variance test followed by a multicomparison Dunnett’s test compared with the positive control (****p<0.0001).
Figure 2. TAC values of kefir (M2) and fortified kefir (M2A10).
Data clearly showed significant increase of TAC value (+47.7% in the fortified kefir respect to the unfortified one), while IC50 value against DPPH radical displayed a value that is
Ital. J. Food Sci., vol. 32, 2020 - 380
Obtained results highlighted that the fortified kefir displayed improved antioxidant performances, compared to the unfortified sample.
3.5. Effect of kefir and its fortified derived products on enzymes linked to MetS
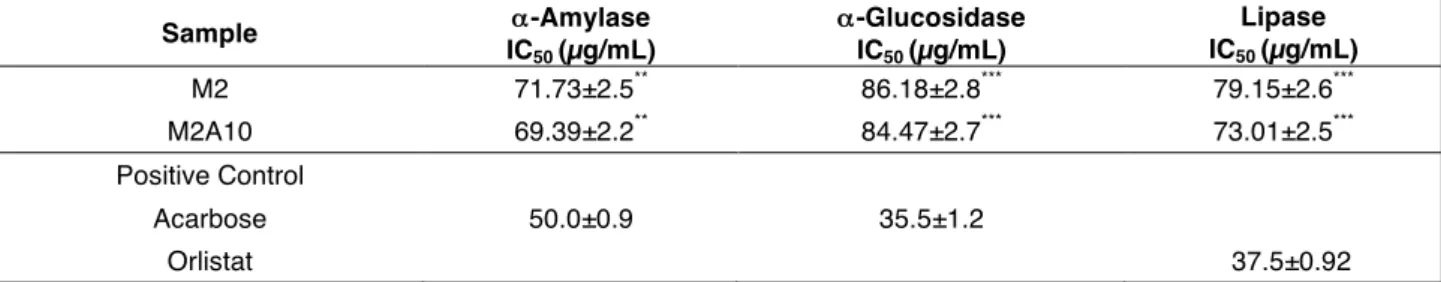
Both kefir and its derived fortified product are able to inhibit the enzymes linked to metabolic syndrome in a concentration- dependent manner. Generally, α-amylase resulted more sensible to the action of our investigated samples and the obtained IC50 values are
quite similar than that found with the positive control acarbose (Table 7).
Table 7. Effect of fortified kefir on enzyme linked to MetS.
Sample α-Amylase IC50 (µg/mL) α-Glucosidase IC50 (µg/mL) Lipase IC50 (µg/mL) M2 71.73±2.5** 86.18±2.8*** 79.15±2.6*** M2A10 69.39±2.2** 84.47±2.7*** 73.01±2.5*** Positive Control Acarbose 50.0±0.9 35.5±1.2 Orlistat 37.5±0.92
Data are expressed as means ± SD (n= 3). Acarbose used as positive control in α-amylase and α-glucosidase tests. Orlistat used as positive control in pancreatic lipase test. Differences within and between groups were evaluated by one-way ANOVA followed by a multicomparison Dunnett’s test compared with the positive control (***p<0.001, **p<0.01).
Fortified kefir (M2A10) showed an IC50 value of 69.39 mg/mL. Value of 84.47 mg/mL was
found against α-glucosidase. Moreover, M2A10 exerted a promising activity against lipase enzyme (IC50 value of 73.01 mg/mL). Previously MORENO et al., (2003) demonstrated that
grape seed extract (GSE) was able to inhibit fat-metabolizing enzyme pancreatic lipase. More recently, HASSAN et al., (2014) reported the ability of water and ethanol grape seed extracts (WGSE and EGSE) against some pancreatic enzymes including α-amylase and lipase. Analysis of data revealed that EGSE had higher α-amylase inhibitory activity in comparison with WGSE. Moreover, daily administration of Kefir (3.6 mL/200 g) in alloxan-induced diabetes mellitus rats for 20 days, showed a significant reduction in blood glucose, total cholesterol, triglycerides, as well as in low density lipoprotein (LDL) and very low density lipoprotein (VLDL) whereas HDL was effectively increased (GHAZI et
al., 2018). The positive effect of kefir on MetS was confirmed, also, by a randomized
double-blind placebo-controlled clinical trial on diabetic patients treated with kefir containing Lactobacillus casei (600 mL/day) for 8 weeks (OSTADRAHIMI et al., 2015). 4. CONCLUSIONS
The present study assessed the total phenolic and anthocyanin content, HPLC-DAD phenolic profile, antioxidant activity, α-amylase, α-glucosidase, and lipase inhibitory activities of kefir and Sangiovese pomace fortified kefir. Between the two extractive methods, UAE showed the better performances in the recovery of the bioactive
Ital. J. Food Sci., vol. 32, 2020 - 381
compounds. Moreover, UAE skin extract (A) characterized by the highest TPC and TA content was selected to be added to Skimmed Milk (M2) and kefir grains. The amount of sample A added to kefir grains did not inhibit the growth of microorganisms as revealed by the increase weight of fortified kefir grains after 24 hours. Fortified kefir showed a better antioxidant activity than unfortified one as evidenced by the comparison of data obtained in all performed assays (TAC, DPPH, and ABTS). Despite the new beverage demonstrated a good performance in the inhibition of key enzymes linked to metabolic syndrome (α-amylase, α-glucosidase and lipase) this activity is not significantly different from unfortified kefir. In conclusion, our data showed a chemical characterization of winery wastes (Sangiovese skins and seeds) also proposing a useful extraction of bioactive molecules to be used as functional ingredients for fermented milk fortification.
ACKNOWLEDGEMENTS
Authors wish to thanks Le Moire farm (Catanzaro, Italy) for grape samples supplying.
ABBREVIATIONS
ABTS 2,2′-Azino-bis(3-ethylbenzothiazoline-6-sulphonic acid) BHT Butylated Hydroxytoluene
CGE Cyanidine-3-O-glucoside equivalent CTE Catechin equivalent
DIAN o-Dianisidine
DM2 Diabetes Mellitus Type 2 DPPH 2,2-Diphenyl-1Picrylhydrazyl GAE Gallic acid equivalent
HDL High-Density Lipoprotein
HPLC-DAD High-Performance Liquid Chromatography/Diode Array Detector IC50 Half Maximal Inhibitory Concentration
MET Metabolic syndrome
PGO Peroxidase/Glucose Oxidase ROS Reactive Oxygen Species
SD Standard Deviation
TA Total Anthocyanins
TAC Total antioxidant capacity TPC Total phenolic content
REFERENCES
Akaberi M. and Hosseinzadeh H. 2016. Grapes (Vitis vinifera) as a potential candidate for the therapy of the metabolic syndrome. Phytother. Res. 30:540-556. DOI: doi.org/10.1002/ptr.5570
Babbar N., Oberoi H.S., Uppal D.S. and Patil, R.T. 2011. Total phenolic content and antioxidant capacity of extracts obtained from six important fruit residues. Food Res. Int. 44:391-396. DOI: doi.org/10.1016/j.foodres.2010.10.001
Beres C., Costa G.N.S., Cabezudo I., da Silva-James N.K., Teles A.S.C., Cruz A.P.G., Mellinger-Silva C., Tonon R.V., Cabral L.M.C. and Freitas, S.P. 2017. Towards integral utilization of grape pomace from winemaking process: A review. Waste Manage. 68:581-594. DOI: doi.org/10.1016/J.WASMAN.2017.07.017
Bladé C., Aragonès G., Arola-Arnal A., Muguerza B., Bravo F.I., Salvadó M.J., Arola L. and Suárez M. 2016. Proanthocyanidins in health and disease. Biofactors 42(1):5-12. DOI: doi.org/10.1002/biof.1249.
Ital. J. Food Sci., vol. 32, 2020 - 382
Bucić-Kojić A., Planinić M., Tomas S., Jakobek L. and Šeruga, M. 2009. Influence of solvent and temperature on extraction of phenolic compounds from grape seed, antioxidant activity and colour of extract. Int. J. Food Sci. Technol. 44:2394-2401. DOI: doi.org/10.1111/j.1365-2621.2008.01876.x
Carrera C., Ruiz-Rodríguez A., Palma M. and Barroso C.G. 2012. Ultrasound assisted extraction of phenolic compounds from grapes. Anal. Chim. Acta 732:100-104. DOI: doi.org/10.1016/j.aca.2011.11.032
Carullo G., Durante M., Sciubba F., Restuccia D., Spizzirri U.G., Ahmed A., Di Cocco M.E., Saponara S.B., Aiello F. and Fusi F. 2019. Vasoactivity of Mantonico and Pecorello grape pomaces on rat aorta rings: An insight into nutraceutical development. J. Funct. Foods 57:328-334. DOI: doi.org/10.1016/j.jff.2019.04.023
Carullo G., Governa P., Spizzirri U.G., Biagi M., Sciubba F., Giorgi G., Loizzo M.R., Di Cocco M.E., Aiello F., and Restuccia D. 2020. Sangiovese cv Pomace Seeds Extract-Fortified Kefir Exerts Anti-Inflammatory Activity in an In Vitro Model of Intestinal Epithelium Using Caco-2 Cells. Antioxidants 9:54. DOI: doi.org/10.3390/antiox9010054.
Chiva-Blanch G. and Badimon L. 2017. Effects of Polyphenol Intake on Metabolic Syndrome: Current Evidences from Human Trials. Oxid. Med. Cell Longev. 2017:5812401. DOI: doi.org/10.1155/2017/5812401
Cirillo G., Curcio M., Vittorio O., Iemma F., Restuccia D., Spizzirri U.G., Puoci, F. and Picci N. 2016. Polyphenol conjugates and human health: a perspective review. Crit. Rev. Food Sci. Nutr. 52:326-337. DOI: doi.org/10.1080/10408 398.2012.752342
Cirillo G., Puoci F., Iemma F., Curcio M., Parisi O.I., Spizzirri U.G., Altimari I. and Picci N. 2012. Starch-quercetin conjugate by radical grafting: synthesis and biological characterization. Pharm. Dev. Technol. 17:466-476. DOI: doi.org/ 10.3109/10837450.2010.546413
Coda R., Larena A., Trani A., Gobbetti M. and Cagno R.D. 2012. Yogurt-like beverages made of a mixture of cereals, soy and grape must: microbiology, texture, nutritional and sensory properties. Int. J. Food Microbiol. 155:120-127. DOI: doi.org/10.1016/j.ijfoodmicro.2012.01.016
Costabile G., Vitale M., Luongo D., Naviglio D., Vetrani C., Ciciola P., Tura A., Castello F., Mena P., Del Rio D., Capaldo B., Rivellese A., Riccardi G. and Giacco, R. 2019. Grape pomace polyphenols improve insulin response to a standard meal in healthy individuals: A pilot study. Clin. Nutr. 38:2727-2734. DOI: doi.org/10.1016/j.clnu.2018.11.028
Cueva C., Moreno-Arribas M.V., Martín-Álvarez P.J., Bills G., Vicente M.F., Basilio A., Rivas C.L., Requena T., Rodríguez J.M. and Bartolomé B. 2010. Antimicrobial activity of phenolic acids against commensal, probiotic and pathogenic bacteria. Res. Microbiol. 161:372-382. DOI: doi.org/10.1016/j.resmic.2010.04.006
Dos Santos K.M., de Oliveira I.C., Lopes M.A., Cruz A.P., Buriti F.C. and Cabral L.M. 2017. Addition of grape pomace extract to probiotic fermented goat milk: The effect on phenolic content, probiotic viability and sensory acceptability. J. Sci. Food Agric. 97(4):1108-1115. DOI: doi.org/10.1021/jf102759e
Doshi P., Adsule P., Banerjee K. and Oulkar D. 2015. Phenolic compounds, antioxidant activity and insulinotropic effect of extracts prepared from grape (Vitis vinifera L) byproducts. J. Food Sci. Technol. 52:181-190. DOI: doi.org/10.1007/s131 97-013-0991-1
Dwyer K., Hosseinian F. and Rod M. 2014. The market potential of grape waste alternatives. J. Food Res. 3:91-106. DOI: doi.org/10.5539/jfr.v3n2p91
El-shiekh R.A., Al-Mahdy D.A., Hifnawy M.S. and Abdel-Sattar E.A. 2019. In vitro screening of selected traditional medicinal plants for their anti-obesity and anti-oxidant activities. South Afr. J. Bot. 123:43-50
European Union. COMMISSION REGULATION (EC) No 555/2008 of 27 June 2008 laying down detailed rules for implementing Council Regulation (EC) No 479/2008 on the common organisation of the market in wine as regards support programmes, trade with third countries, production potential and on controls in the wine sector. Off. J. EU 2008, L/170, 1-80
Fernàndez-Marìn M.I., Guerrero R.F., Puertas B., Garcìa-Parrilla M.C. and Cantos-Villar E. 2013. Functional grapes. In “Natural Products”. K.G. Ramawat and J.M. Mérillon (Eds), Springer-Verlag: Berlin Heidelberg, Volume 1, p. 2581-2606 Fernando I.P.S., Sanjeewa K.K.A., Samarakoon K.W., Lee W.W., Kim H.-S. and Jeon, Y.-J. 2018. Squalene isolated from marine macroalgae Caulerpa racemosa and its potent antioxidant and anti-inflammatory activities. J. Food Biochem. 42:e12628. DOI: doi.org/10.1111/jfbc.12628
Ital. J. Food Sci., vol. 32, 2020 - 383
Fontana A.R., Antoniolli A. and Bottini R. 2013. Grape pomace as a sustainable source of bioactive compounds: extraction, characterization, and biotechnological applications of phenolics. J. Agric. Food Chem. 61:8987-9003.
DOI: doi.org/10.1021/jf402586f.
Galanakis C.M. 2012. Recovery of high added-value components from food wastes: conventional, emerging technologies and commercialized applications. Trends Food Sci. Technol. 26:68-87. DOI: doi.org/10.1016/j.tifs.2012.03.003
García-Lomillo, J., Gonzalez-SanJose, M. L., Del Pino-García, R., Rivero-Perez, M. D. and Muniz-Rodriguez, P. 2014. Antioxidant and antimicrobial properties of wine byproducts and their potential uses in the food industry. J. Agr. Food Chem. 62:12595-12602. DOI: doi.org/10.1021/jf5042678
García-Lomillo J. and González-SanJosé M.L. 2017. Applications of wine pomace in the food industry: approaches and functions. Compr. Rev. Food Sci. F. 16:3-22. DOI: doi.org/10.1111/1541-4337.12238
Gengaihi S.E., Ella F.M.A., Emad M.H., Shalaby E. and Doha H. 2014. Antioxidant Activity of Phenolic Compounds from Different Grape Wastes. J. Food Process. Technol. 5:296. DOI: doi.org/10.4172/2157-7110.1000296
Ghazi I., Abdel R. and Hassan A. 2018. Evaluation of antidiabetic and antihyperlipidimic activity of Kefir in alloxan induced diabetes mellitus rat. Sci. J. Med. Res. 2:83-86.
Gođevac D., Tešević V., Veličković M., Vujisica L., Vajs V. and Milosavljević S. 2010. Polyphenolic compounds in seeds from some grape cultivars grown in Serbia. J. Serbian Chem. Soc. 75: 1641-1652. DOI: doi.org/10.2298/JSC100519131G Gonçalves G.A., Soares A.A., Barros . Haminiuk C., Peralta R., Ferreira I., and Bracht A. 2017. Merlot grape pomace hydroalcoholic extract improves the oxidative and inflammatory states of rats with adjuvant-induced arthritis. J. Functional Foods. 33:408-418. DOI: doi.org/10.1016/j.jff.2017.04.009
Hassan H.M.M. 2014. Inhibitory Effects of Red Grape Seed Extracts on Pancreatic α-amylase and lipase. Glob. J. Biotechnol. Biochem. 9(4):130-136. DOI: doi.org/10.5829/idosi.gjbb.2014.9.4.1114
Jara-Palacios M.J., Hernanz D., Cifuentes-Gomez T., Escudero-Gilete M.L., Heredia F.J. and Spencer J.P.E. 2015. Assessment of white grape pomace from winemaking as source of bioactive compounds, and its antiproliferative activity. Food Chem. 183, 78–82. DOI: doi.org/10.1016/j.foodchem.2015.03.022
Jiménez M., Juárez N., Jiménez-Fernández V.M., Monribot-Villanueva J.L. and Guerrero-Analco J.A. 2018. Phenolic compounds and antioxidant activity of wild grape (Vitis tiliifolia). Ital. J. Food Sci. 30:128-143.
Kammerer D., Claus A., Carle R. and Schieber A. 2004. Polyphenol screening of pomace from red and white grape varieties (Vitis vinifera L.) by HPLC-DAD-MS/MS. J. Agric. Food Chem. 52:4360-4367. DOI: doi.org/10.1021/jf049613b Kaneto H., Katakami N., Matsuhisa M. and Matsuoka T. 2010. Role of Reactive Oxygen Species in the Progression of Type 2 Diabetes and Atherosclerosis. Mediat. Inflamm. Article ID 453892. DOI: doi.org/10.1155/2010/453892
Karaaslan M., Ozden M., Vardin H. and Turkoglu H. 2011. Phenolic fortification of yogurt using grape and callus extracts. LWT. 44:1065-1072. DOI: doi.org/10.1016/j.lwt.2010.12.009
Katalinić, V., Možina, S. S., Skroza, D., Generalić, I., Abramovič, H., Miloš, M., Ljubenkov I., Piskernik S., Pezo, I., Terpinc P. and Boban, M. 2010. Polyphenolic profile, antioxidant properties and antimicrobial activity of grape skin extracts of 14 Vitis vinifera varieties grown in Dalmatia (Croatia). Food Chem. 119:715-72. DOI: doi.org/10.1016/j.food chem.2009.07.019
Leporini M., Tundis R., Sicari V., Pellicanò T., Dugay A., Brigitte D. and Loizzo M.R. 2020. Impact of extraction processes on phytochemicals content and biological activity of Citrus × clementina Hort. Ex Tan. leaves: new opportunity for under-utilized food by-products. Food Res. Int. 127:108742. DOI: doi.org/10.1016/j.foodres.2019.108742
Loizzo M., Tundis R., Dall'Acqua S., Ilardi V., Leporini M., Falco T., Sicari V. and Bruno M. 2019. High-Performance Liquid Chromatography/Electrospray Ionization Tandem Mass Spectrometry (HPLC-ESI-MSn) Analysis and Bioactivity Useful for Prevention of “Diabesity” of Allium commutatum Guss. Plant Foods Hum. Nutr. DOI: doi.org/10.1007/s11130-019-00782-2.
Loizzo M.R., Sicari V., Tundis R., Leporini M., Falco T. and Calabrò V. 2019. The influence of ultrafiltration of Citrus
limon L. Burm. cv Femminello comune juice on its chemical composition and antioxidant, and hypoglycaemic properties.
Ital. J. Food Sci., vol. 32, 2020 - 384
Loizzo M.R., Sicari V., Pellicanò T., Xiao J., Poiana M. and Tundis R. 2019. Comparative analysis of chemical composition, antioxidant and anti-proliferative activities of Italian Vitis vinifera by-products for a sustainable agro-industry. Food Chem. Toxicol. 127:127-134. DOI: doi.org/10.1016/j.fct.2019.03.007
Marchiani R, Bertolino M, Belviso S, Giordano M, Ghirardello D, Torri L, Piochi M, and Zeppa G. 2016. Yogurt enrichment with grape pomace: effect of grape cultivar on physicochemical, microbiological and sensory properties. J. Food Quality 39:77-89. DOI: doi.org/10.1111/jfq.12181
Mendoza L., Milena C., Vivanco M., Matsuhiro B., Torres S. and Aguirre M. 2012. Evaluation of antifungal properties against the phytopathogenic fungus botrytis cinerea of anthocyanin rich-extracts obtained from grape pomaces. J. Chilean Chem. Soc. 58:1725-1727. DOI: doi.org/10.4067/S0717-97072013000200018
Mendrick D.L., Diehl A.M., Topor L.S., Dietert R.R., Will Y., La Merrill M.A., Bouret S., Varma V., Hastings K.L., Schug T.T., Emeigh Hart S.G. and Burleson F.G. 2018. Metabolic Syndrome and Associated Diseases: From the Bench to the Clinic. Toxicol Sci. 162(1):36-42. DOI: doi.org/10.1093/toxsci/kfx233.
Moreno D.A., Ilic N., Poulev A., Brasaemle D.L., Fried S.K. and Raskin I. 2003. Inhibitory effects of grape seed extract on lipases. Nutrition 19(10):876-879. DOI: doi.org/10.1016/S0899-9007(03)00167-9
Najgebauer-Lejko D. and Sady M. 2015. Estimation of the antioxidant activity of the commercially available fermented milks. Acta Sci. Pol. Technol. Aliment. 14:387-396. DOI: doi.org/10.17306/J.AFS.2015.4.38
Ostadrahimi A., Taghizadeh A., Mobasseri M., Farrin, M., Payahoo, L., Beyramalipoor Gheshlaghi Z. and Vahedjabbari M. 2015. Effect of probiotic fermented milk (kefir) on glycemic control and lipid profile in type 2 diabetic patients: a randomized double-blind placebo-controlled clinical trial. Iran J. Public Health. 44(2):228-237.
Ozcan T., Sahin S., Akpinar-Bayizit A. and Yilmaz-Ersan L. 2019. Assessment of antioxidant capacity by method comparison and amino acid characterisation in buffalo milk kefir. Int. J. Dairy Technol. 72:65-73. DOI: doi.org/10.1111/1471-0307.12560
Perna A., Simonetti A. and Gambacorta E. 2019. Phenolic content and antioxidant activity of donkey milk kefir fortified with sulla honey and rosemary essential oil during refrigerated storage. Int. J. Dairy Technol. 72(1):74-81.
DOI: doi.org/10.1111/1471-0307.12561
Restuccia D., Sicari V., Pellicanò T.M., Spizzirri U.G. and Loizzo M.R. 2017. The impact of cultivar on polyphenol and biogenic amine profiles in Calabrian red grapes during winemaking. Food Res. Int. 102:303-312.
DOI: doi.org/10.1016/j.foodres.2017.10.012
Restuccia D., Giorgi G., Spizzirri U.G., Sciubba F., Capuani G., Rago V., Carullo G. and Aiello F. 2019. Autochthonous white grape pomaces for the development of functional jams. Int. J. Food Sci. Technol. 54:1313-1320. DOI: doi.org/10.1111/ijfs.14045
Restuccia D., Spizzirri U.G., Chiricosta S., Puoci F., Altimari I. and Picci, N. 2011. Antioxidant properties of extra virgin olive oil from cerasuola cv olive fruit: Effect of stone removal. It. J. Food Sci. 23:62-71.
Settanni L., Cruciata M., Guarcello R., Francesca N., Moschetti G., La Carrubba V., and Gaglio R. 2019. Valorisation of Dairy Wastes Through Kefr Grain Production. Waste and Biomass Valorization. DOI: doi.org/10.1007/s12649-019-00718-6
Spigno G. and De Faveri D.M. 2007. Antioxidants from grape stalks and marc: influence of extraction procedure on yield, purity and antioxidant power of the extracts. J. Food Eng. 78:793-801. DOI: doi.org/10.1016/j.jfoodeng.2005.11.020 Spizzirri U.G., Altimari I., Puoci F., Parisi O.I., Iemma F. and Picci N. 2011. Innovative antioxidant thermo-responsive hydrogels by radical grafting of catechin on inulin chain. Carbohydr. Polym. 84:517-523. DOI: doi.org/10.1016/j.carbpol. 2010.12.015
Tang G.Y., Zhao C.N., Liu Q., Feng X.L., Xu X.Y., Cao S.Y., Meng X., Li S., Gan R.Y. and Li H.B. 2018. Potential of grape wastes as a natural source of bioactive compounds. Molecules 23:2598-2618. DOI: doi.org/10.3390/molecules23102598 Teixeira A., Baenas N., Dominguez-Perles R., Barros A., Rosa E., Moreno D.A. and Garcia-Viguera C. 2014. Natural bioactive compounds from winery by-products as health promoters: a review. Intl. J. Mol. Sci. 15:15638-15678.
DOI: doi.org/10.3390/ijms150915638
Tseng A., and Zhao Y. 2013. Wine grape pomace as antioxidant dietary fibre for enhancing nutritional value and improving storability of yogurt and salad dressing. Food Chem 138:356-65. DOI: doi.org/10.1016/j.foodchem.2012. 09.148
Ital. J. Food Sci., vol. 32, 2020 - 385
Tundis R., Loizzo M.R., Bonesi M., Sicari V., Ursino C., Manfredi I., Conidi C., Figoli A. and Cassano A. 2018. Concentration of bioactive compounds from elderberry (Sambucus nigra L.) juice by nanofiltration membranes. Plant Foods Hum. Nutr. 73:336-343. DOI: doi.org/10.1007/s11130-018-0686-x.
Xia E., He X., Li H., Wu S., Li S. and Deng G. 2014. Biological activities of polyphenols from grapes. In “Polyphenols in Human Health and Disease”. R.R. Watson, V.R. Preedy and S. Zibadi (Eds.) Volume 1, p. 47-58. Academic Press: San Diego, CA.
Xia E.Q., Deng G.F., Guo Y.J. and Li H.B. 2010. Biological activities of polyphenols from grapes. Intl. J. Mol. Sci. 11:622-646. DOI: doi.org/10.3390/ijms11020622
Yu J. and Ahmedna, M. 2013. Functional components of grape pomace: their composition, biological properties and potential applications. Int. J. Food Sci. Technol. 48:221-237. DOI: doi.org/10.1111/j.1365-2621.2012.03197.x