Expression patterns and genetic
variation of the ovine skeletal
muscle transcriptome of sheep
from five Spanish meat breeds
A. Noce
1,2, T. F. Cardoso
1,3, A. Manunza
1, A. Martínez
4, A. Cánovas
5, A. Pons
6, L. A. Bermejo
7,
V. Landi
4, A. S nchez
1,8, J. Jordana
8, J. V. Delgado
4, S. Adán
9, J. Capote
10, O. Vidal
11,
M. Pazzola
2, G. M. Vacca
2, J. Casellas
8& M. Amills
1,8The goal of the current study is to analyse the gene expression profile of the ovine skeletal muscle as well as to characterize the genetic variation of transcripts expressed in such tissue. This aim has been achieved by sequencing the longissimus dorsi transcriptomes of 50 sheep distributed in five pools representing the Canaria de Pelo, Roja Mallorquina, Gallega, Xisqueta and Ripollesa Spanish autochthonous breeds. Approximately, 363 million reads per pool have been produced and 71.9–82.9% have been successfully mapped to the ovine genome in a paired-end mode (2 × 75 bp). The 200 most expressed muscle transcripts (≈1% of the total transcript count) account for 51% (Canaria de Pelo) to 67% (Gallega) of the total ovine skeletal muscle mRNA expression. These highly expressed genes play key roles in pathways related with striated muscle contraction, gluconeogenesis, glycolysis, citric acid cycle and respiratory electron transport. RNA-Sequencing of muscle transcripts has also revealed that ~72% of the SNPs detected with this approach are shared by at least two pools, and 10% of them segregate in the five pools under analysis. Most of the substitutions detected by RNA-Seq are synonymous or missense and only a minority are predicted to have consequences on protein function.
The development of next generation sequencing techniques has made possible to characterize in depth the ovine transcriptome across multiple tissues. Recently, a high resolution atlas of gene expression in sheep was generated by combining data from 441 RNA-Seq libraries representing all major organ systems1. This study highlighted the
existence of at least 25,350 expressed genes, of which 19,921 encode proteins1. Moreover, hundreds of genes were
functionally annotated based on their co-expression patterns with loci with a well-known function1. Massive
sequencing of transcripts expressed in specific ovine tissues, such as skeletal muscle and the mammary gland2–4,
has also been carried out to better understand the physiology of these organs and its impact on production per-formance. RNA-Seq has also been used to generate large collections of single nucleotide polymorphisms (SNPs) mapping to transcripts expressed in certain tissues2,3, though SNP calling from sequencing data can be
challeng-ing due to the intrinsic complexity of the transcriptome5,6. In a recent study, Suárez-Vega et al.7 identified, through
RNA-Seq of the milk somatic cell transcriptome, 197,948 SNPs in eight Churra and Assaf ewes. Zhang et al.2
1Department of Animal Genetics, Centre for Research in Agricultural Genomics (CRAG) CSIC-IRTA-UAB-UB,
Campus de la Universitat Autònoma de Barcelona, Bellaterra, 08193, Barcelona, Spain. 2Dipartimento di Medicina
Veterinaria, Università degli Studi di Sassari, via Vienna, 2, 07100, Sassari, Italy. 3CAPES Foundation, Ministry of
Education of Brazil, Brasilia - D. F., Zip Code 70.040-020, Brasilia, Brazil. 4Departamento de Genética, Universidad de
Córdoba, Córdoba, 14071, Spain. 5Centre for Genetic Improvement of Livestock, Department of Animal Biosciences,
University of Guelph, Guelph, N1G 2W1, Ontario, Canada. 6Unitat de Races Autòctones, Servei de Millora Agrària
i Pesquera (SEMILLA), Son Ferriol, 07198, Spain. 7Departamento de Ingeniería, Producción y Economía Agrarias,
Universidad de La Laguna, 38071, La Laguna, Tenerife, Spain. 8Departament de Ciència Animal i dels Aliments,
Universitat Autònoma de Barcelona, Bellaterra, 08193, Spain. 9Federación de Razas Autóctonas de Galicia (BOAGA),
Pazo de Fontefiz, 32152, Coles, Ourense, Spain. 10Instituto Canario de Investigaciones Agrarias, La Laguna, 38108,
Tenerife, Spain. 11Departament de Biologia, Universitat de Girona, Girona, 17071, Spain. A. Noce and T. F. Cardoso
contributed equally to this work. Correspondence and requests for materials should be addressed to J. Casellas (email: [email protected]) or M.A. (email: [email protected])
Received: 27 March 2018 Accepted: 22 June 2018 Published: xx xx xxxx
detected 40,481 and 38,851 potential SNPs in transcripts expressed in the skeletal muscle of Small-Tailed Han and Dorper sheep, respectively. Characterizing the levels of expression and variation of genes transcribed in the ovine skeletal muscle may shed light on the physiological mechanisms that regulate muscle growth and development, two key aspects determining the economic output of meat sheep producers.
The current study aimed to analyse the gene expression profile of the ovine skeletal muscle by sequencing RNA extracted from longissimus dorsi samples of 50 individuals distributed in pools representing five meat sheep breeds from Spain i.e. Canaria de Pelo, Roja Mallorquina, Gallega, Xisqueta and Ripollesa (Supplementary Table S1). Our goal was to identify the genes making a major contribution to the muscle transcriptome and to determine their biological functions with the aim of providing insights into the molecular basis of meat traits. Moreover, we were interested in characterizing the SNP variation of transcripts expressed in the ovine skele-tal muscle and to investigate if such variation is shared across breeds with different origins and demographic histories.
Methods
Ethics statement.
Biological samples were extracted from the carcasses of sheep slaughtered in a commer-cial abattoir. The killing of these animals was exclusively due to the fact that they were at the end of their pro-ductive cycle and followed the Spanish legislation expressed in the Royal Decree 37/2014 which regulates animal welfare during slaughtering procedures. Given that this is a standard and routine farming procedure not directly related with our research, no permission from the Ethics Committee of the UAB was required.RNA isolation and sequencing.
Samples from the longissimus dorsi muscle were retrieved from Canaria de Pelo, Roja Mallorquina, Xisqueta, Ripollesa and Gallega sheep (10 individuals per population) in a com-mercial abattoir. Muscle samples were submerged into RNAlater (Ambion, Austin, TX) and stored at −20 °C until use. Total RNA was extracted using the RiboPure RNA Purification kit (Ambion) following the recom-mendations of the manufacturer. Total RNA concentration was estimated with a Nano-Drop ND-1000 spec-trophotometer (NanoDrop products; Wilmington, USA). The quality of the RNA extractions was evaluated in an Agilent Bioanalyzer 2100 equipment (Agilent Technologies, Inc., Santa Clara CA, USA). All samples showed RNA Integrity Numbers (RIN) values above 7. Subsequently, five RNA pools were prepared by mixing equal RNA amounts from each one of the 10 individuals representing a given breed. Sequencing libraries (five cDNA pools) were made using the TruSeq RNA Sample Preparation kit (Illumina, San Diego, CA) and following the protocols recommended by the manufacturer. The TruSeq RNA Kit captures the coding transcriptome (without strand information) by using oligo-dT beads complementary to poly-A tails. RNA paired-end sequencing (2 × 75 bp) was carried out in a HiSeq 2000 Sequencing System (Illumina, San Diego, CA) at the Centre Nacional d’Anàlisi Genòmica (http://www.cnag.crg.eu, Barcelona, Spain).Bioinformatic analysis.
Quality control of sequence reads was carried out with the CLC Genomics Workbench 8.0 (https://www.qiagenbioinformatics.com), by using the NGS quality control tool, which assesses sequence quality indicators based on the FastQC-project (http://www.bioinformatics.babraham.ac.uk/projects/ fastqc). Subsequently, sequences were trimmed for any remaining sequencing adapter and low quality bases by using Trimmomatic v.0.228 and taking into account default parameters. Raw reads were mapped to the ovineref-erence genome Oar_v3.1 (https://www.ensembl.org/Ovis_aries/.) by using the Spliced Transcripts Alignment to a Reference (STAR) software9 with a 2-pass mapping strategy. This strategy relies on a double mapping of the reads
by STAR. In the 1st pass, the novel junctions are identified and included into the genome indices. In the 2nd pass, all reads are mapped again by considering the original GTF file plus the novel junctions (i.e. those detected in the 1st pass). To characterize muscle gene expression in each pool, we used the FeatureCounts tool10. The data inputted
to FeatureCounts consists of one or more files of aligned reads in Binary Alignment/Map (BAM) format and a list of genomic features (GTF annotation file). FeatureCounts assigns reads to features by comparing the genomic location of each base in the read with the chromosomal region encompassed by each feature10. By combining
highly efficient chromosome hashing and feature blocking techniques, FeatureCounts provides highly precise read counts with a low computational cost10. In order to normalise the raw counts, we determined the relative library
sizes for each library through the function estimateSizeFactors of the DESeq2 package11. This function is based on
the median of ratios method, which performs the following steps: 1 - a pseudo-reference sample is created (that is equal to the geometric mean across all samples) for each gene; 2 - for every gene in a sample, the ratios (sample/ pseudo-reference) are calculated; 3 - the median value of all ratios for a single sample is taken as the normaliza-tion factor (size factor) for each sample and 4 - the funcnormaliza-tion divides each raw count value by the normalizanormaliza-tion factor to generate normalized count values12. The Cytoscape software13 combined with the ReactomeFIViz app14
were used to identify which pathways are enriched in the data set of 200 genes displaying the highest levels of expression in each pool.
Variant discovery procedures followed the GATK Best Practices workflow for SNP calling on RNA-Seq data (https://software.broadinstitute.org/gatk/documentation/article.php?id=3891). After mapping, reads were split into exon segments and any sequences overhanging into the intronic regions were hard-clipped. Mapping qual-ities were reassigned by using the SplitNCigarReads GATK tool (https://software.broadinstitute.org/gatk). We used the Haplotype Caller (https://software.broadinstitute.org/gatk) tool to detect SNPs by considering the pres-ence of ten individuals (–ploidy 20) in each pool. A Phred-scaled confidpres-ence threshold of 20 was taken into consideration. Stringent parameters were used to minimize the detection of false-positive SNPs. In this way, variants meeting any of the two following conditions were eliminated: a) with Fisher Strand values above 30.0 (the Fisher’s exact test is used to determine if there is strand bias between forward and reverse strands for the reference or alternate alleles); and b) Qual By Depth values (quality score normalized by allele depth for a variant) below 2. Indel variation was not taken into account because accurate indel calling is still difficult to implement,
as reflected by the low agreement between calling algorithms15. We used the BEDTools software16 to filter out
intronic and intergenic SNPs, thus retaining those that map to exons (reference genome Oar_v3.1). The poten-tial effects and impact of exonic SNPs identified via RNA-Seq were predicted with the SnpEff software v4.3s17.
The impact of a SNP is categorised by SnpEff as follows: HIGH, the variant is assumed to have high (disruptive) impact on the protein, probably causing protein truncation, loss of function or triggering nonsense mediated decay; MODERATE, a non-disruptive variant that might change protein effectiveness; LOW, assumed to be mostly harmless or unlikely to change protein behavior; MODIFIER, usually non-coding variants or variants affecting non-coding genes, where predictions are difficult or there is no evidence of impact (http://snpeff.source-forge.net/SnpEff_manual.html). We considered as “previously reported variants” those described in the Single Nucleotide Polymorphism database (dbSNP)18.
Data availability.
The raw sequencing data used to perform RNA-Seq analysis are available in the Sequence Read Archive (SRA) BioProject No. PRJNA472958. The new polymorphisms identified in the current work can be found in Figshare19.Results and Discussion
A few hundred genes are highly expressed in the ovine skeletal muscle.
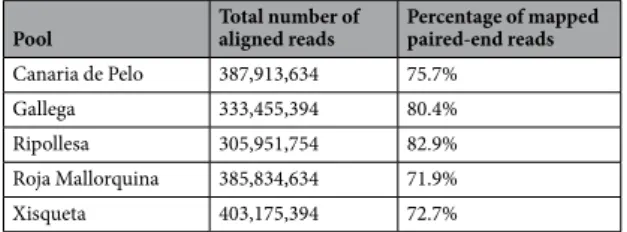
Approximately, 363 mil-lion reads per pool have been produced and 71.9–82.9% of these reads have been successfully mapped to the ovine genome in a paired-end (2 × 75 bp) mode (Table 1). Nearly 49–55% of unambiguously mapped reads cor-respond to exons. We have discarded from subsequent analyses intergenic (21–27%) and intronic (22–23%) reads because the functional annotation of such regions in the ovine genome is still very poor and, moreover, they could be the result of genomic DNA contamination. Based on exonic data, we have detected the existence of 14,743-15,454 expressed genes (the threshold of expression was set at >10 normalized DESeq2 counts) in the ovine skeletal muscle. The number of expressed genes detected in the current work is similar to those identified in pre-vious reports1,2,4. In this way, Zhang et al.2 sequenced the muscle transcriptome of two sheep from the Dorper andSmall-tailed Han breeds and detected the expression of about 13,500 known reference genes based on 50 M reads/ sample (in our experiment we generated an average of 363 M reads per pool). In the sheep gene expression atlas data set1, 25,350 genes (19,921 protein-coding loci) with expression levels above 1 transcript per million were
detected in at least one tissue from one individual1. Amongst the most expressed loci (Supplementary Table S2),
we have found genes encoding myofibrilar proteins involved in muscle contraction (ACTA1, MYLPF, MYH2,
MYH7, TPM2 and TTN) as well as genes related with oxygen storage and diffusion (MB), mitochondrial
respira-tion (MT-CYB), calcium transportarespira-tion and release (ATP2A1 and RYR1) and energy homeostasis (ALDOA, CKM and GAPDH). The pattern of expression of muscle transcripts is highly unbalanced, with a few genes contributing most of transcripts (Supplementary Table S2). For instance, the 200 most expressed transcripts (≈1% of the total transcript count) account for 51% (Canaria de Pelo), 53% (Roja Mallorquina), 62% (Xisqueta), 65% (Ripollesa) and 67% (Gallega) of the total muscle gene expression. These patterns of expression were confirmed by analysing three independent additional RNA-Seq data sets (Supplementary Table S3, Sabino et al.20). The genes identified by
us as showing the highest expression levels in the longissimus dorsi muscle of Spanish sheep also showed the high-est expression levels and similar expression rankings in Appenninica × Sarda lambs (Supplementary Table S3). This unbalanced expression profile has been also observed in human tissues21. For instance, 60% of the blood cell
transcriptome is contributed by the three hemoglobin genes21. Zhang et al.2 also observed this phenomenon in the
ovine skeletal muscle of Dorper and Small-Tailed Han sheep i.e. they found 12,618-12,746 genes with an expres-sion of 0–100 RPKM, whilst only 12 genes displayed very high levels of expresexpres-sion (>10,000 RPKM).
Our results clearly indicate that the most expressed locus in the skeletal muscle tissue of the five breeds under analysis is the actin α1 (ACTA1) gene (Supplementary Table S2), which encodes the thin filaments of the mus-cle contractile apparatus22. Myosin heavy chain 2 (MYH2) and 7 (MYH7) and myosin light chain,
phospho-rylatable, fast skeletal muscle (MYLPF) genes are also strongly expressed (Supplementary Table S2), and their products form part of the thick filaments of muscular myofibrils, while tropomyosin 2 (TPM2) and titin (TTN) are key modulators of muscle contraction22. The myoglobin (MB) and mitochondrially encoded cytochrome B
(MT-CYB) loci also display a high expression (Supplementary Table S2), reflecting the fundamental role of oxida-tive phosphorylation in the generation of the ATP needed for muscle contraction23. Calcium is an essential trigger
of muscle contraction and by this reason the mRNA levels of the ATPase sarcoplasmic/endoplasmic reticulum Ca2+ transporting 1 (ATP2A1) gene, which translocates Ca2+ from the cytosol to the sarcoplasmic reticulum, and the ryanodine receptor 1 gene, that facilitates the release of Ca2+ into the cytosol, are expressed at high levels in the ovine skeletal muscle (Supplementary Table S2)24. Given the high energy expenditure of the skeletal muscle
Pool Total number of aligned reads Percentage of mapped paired-end reads Canaria de Pelo 387,913,634 75.7%
Gallega 333,455,394 80.4%
Ripollesa 305,951,754 82.9%
Roja Mallorquina 385,834,634 71.9%
Xisqueta 403,175,394 72.7%
Table 1. Output of the RNA-Sequencing of longissimus dorsi muscle RNA pools representing five Spanish ovine
tissue, creatine kinase, M-type (CKM), which is involved in energy storage25, and aldolase, fructose-bisphosphate
A (ALDOA) and glyceraldehyde-3-phosphate dehydrogenase (GAPDH), which participate in glycolysis26, are
also strongly expressed (Supplementary Table S2). In close concordance with our data, genes mentioned above are present in the list of the 100 top expressed loci in the human skeletal muscle21. As shown in Supplementary
Table S4, the main functions of the 200 ovine top genes listed in Supplementary Table S2 are related with mus-cle contraction and metabolism (gluconeogenesis, glycolysis, citric acid cymus-cle, formation of ATP by chemios-motic coupling and respiratory electron transport). Both groups of pathways are highly interconnected because the energy needed for the contraction of skeletal muscle fibers is supplied by ATP via anaerobic glycolysis, the phosphocreatine shuttle and oxidative phosphorylation27. As observed in humans21, nuclear genes are the main
contributors to the transcriptomic output of the ovine skeletal muscle (Supplementary Table S2). In contrast, RNA-Seq experiments have demonstrated that in highly aerobic human tissues, such as kidney, 51% of the tran-scriptional output comes from mitochondrial genes21.
About the variation of genes expressed in the ovine skeletal muscle.
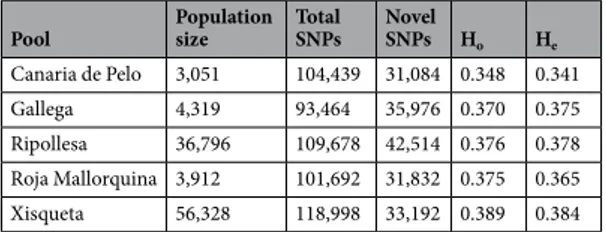
The amount of exonic pol-ymorphisms detected by RNA-Seq in the Ripollesa (109,678 SNPs), Xisqueta (118,998 SNPs), Gallega (93,464 SNPs), Roja Mallorquina (101,692 SNPs) and Canaria de Pelo (104,439 SNPs) breeds does not correlate with the current census of these five populations (Table 2). The identification of SNPs from RNA-Seq data is a challenging task due to the inherent complexity of the transcriptome and also because SNP calling is greatly affected by gene expression levels and coverage i.e. SNPs in highly expressed genes are detected with a higher probability than those mapping to weakly expressed transcripts5,6. In consequence, the number of SNPs identified in each poolwould be a very rough estimate of genetic diversity. In order to tackle this issue, we have used previously reported Ovine SNP50 BeadChip data from Ripollesa (N = 23), Xisqueta (N = 25), Gallega (N = 25), Roja Mallorquina (N = 29) and Canaria de Pelo (N = 27) sheep28 to estimate observed and expected heterozygosities. Individuals
included in this latter data set were not sequenced in the current work, so they can be considered as an independ-ent sample of each one of the breeds under analysis. We have observed that both diversity parameters have similar values across the five breeds despite the fact that their population sizes are very different (Table 2). Although in general population size correlates with the amount of diversity29, this relationship is not linear and it can be
affected by the reproductive management and demographic history (bottlenecks and founder effects, admixture, etc.) of domestic breeds. For instance, the census of Holstein cattle in Canada is much larger than that of Jersey cattle, but paradoxically effective sizes are remarkably alike i.e. 115 and 55 individuals for Holstein and Jersey, respectively30. Moreover, the high genetic variation of the two insular ovine breeds, Canaria de Pelo and Roja
Mallorquina, could be due to population admixture e.g. Roja Mallorquina sheep have a fat tail and a red colora-tion that is typical from certain African and Asian breeds28.
Approximately 33%, of the SNPs detected by RNA-Seq in each breed appear to be novel i.e they are not recorded in the dbSNP18 database. The segregation, in the five breed pools, of a substantial proportion of SNPs
that are not recorded in the dbSNP18 database (Table 2) matches previous results obtained by Suárez-Vega et
al.7. These authors characterized the variation of the milk somatic cell transcriptome from eight ewes and found
that 22% of variants were not annotated in the dbSNP18 database (https://www.ncbi.nlm.nih.gov/projects/SNP).
Similarly, sequencing of the transcriptome of muscle samples from three Limousin bulls showed that approxi-mately 60% of the variation was unannotated31. Taken together, these results suggest that a substantial fraction of
ovine genetic diversity remains to be identified.
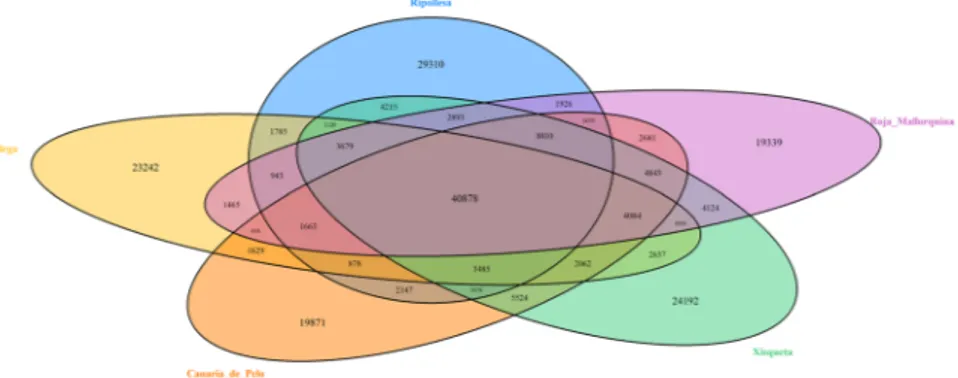
The majority (72%) of the SNP variants identified in the current work are present in 2 or more pools, and 10% segregate in the five pools (Fig. 1). These results could be due, at least in part, to the fact that population-specific alleles have usually low frequencies32. When using pooled sequencing data, these rare alleles are detected with
a much lower efficiency than alleles segregating at intermediate or high frequencies. This means that a robust estimate of breed-specific variation cannot be obtained from our data. However, the general picture that emerges from our results is consistent with previous studies indicating that the majority of ovine SNP variation is shared across breeds33. High haplotype sharing across short chromosomal distances and weak population structure
observed in a worldwide sample of sheep breeds has been interpreted as evidence of extensive gene flow in ancient Pool Population size Total SNPs Novel SNPs Ho He
Canaria de Pelo 3,051 104,439 31,084 0.348 0.341
Gallega 4,319 93,464 35,976 0.370 0.375
Ripollesa 36,796 109,678 42,514 0.376 0.378 Roja Mallorquina 3,912 101,692 31,832 0.375 0.365 Xisqueta 56,328 118,998 33,192 0.389 0.384
Table 2. Single nucleotide polymorphisms (SNPs) detected in five ovine Spanish breeds by RNA-Sequencing
and two diversity parameters (observed and expected heterozygosities) calculated from an independent sample of individuals genotyped with the Ovine SNP50 BeadChip. Observed (Ho) and expected (He) heterozygosities were estimated on the basis of a data set previously reported by Manunza et al.28 which included 129 individuals
from the Ripollesa (N = 23), Xisqueta (N = 25), Gallega (N = 25), Roja Mallorquina (N = 29) and Canaria de Pelo (N = 27) breeds. These 129 individuals are different from the 50 sheep sequenced in the current experiment and, moreover, they are representative of the five breeds under analysis. Population sizes were retrieved from the Catalogue of Spanish livestock breeds (http://www.mapama.gob.es).
times33. However, the short time of divergence of ovine breeds (less than 10,000 YBP) and the existence of a single
domestication center in the Near East might be also important causal factors explaining the extensive sharing of variants even amongst distant sheep populations.
About the predicted functional consequences of the variation detected in the five ovine pools, high impact variants are much less frequent (less than 1% on average) than modifier (38–39%), moderate (23–26%) or low (34–37%) impact variants (Fig. 2). The vast majority of exonic SNPs are synonymous or missense or map to the 3′UTR, while those located in the 5’UTR or introducing a premature stop codon are much scarcer (Fig. 2). Nonsense variants are very scarce probably because they are purged by purifying selection (Fig. 2). Suárez-Vega
et al.7 sequenced the ovine mammary gland transcriptome of Churra and Assaf sheep and found a similar pattern Figure 1. Venn-Diagram depicting the breed distribution of exonic SNPs identified in Canaria de Pelo, Roja
Mallorquina, Gallega, Xisqueta and Ripollesa sheep. The total number of SNPs detected in each breed is as follows: Canaria de Pelo = 104,439 variants, Roja Mallorquina = 101,692 variants, Gallega = 93,464 variants, Xisqueta = 118,998 variants and Ripollesa = 109,678 variants.
Figure 2. (A) Classification of single nucleotide polymorphisms (SNPs) identified in five ovine Spanish breeds
according to their impact on gene function as predicted with the SnpEff software17. (B) Major types of SNPs
of variation, with ≈43,000 synonymous, ≈21,800 missense and ≈12,900 3′UTR SNPs plus 112–119 nonsense mutations.
Detection of high impact variants in fifteen genes related with meat quality.
As shown in Supplementary Table S5, we have explored the missense and nonsense variation of 15 genes related with meat quality which are listed in Supplementary Table S6. In Supplementary Table S5, we have only catalogued variants that have been independently discovered in at least two pools. The majority of missense substitutions identified in this way have been predicted to be non-damaging by SIFT (http://sift.jcvi.org/), but several of them, i.e. those mapping to the MYF5, FABP4, PGAM2 and PRKAG3 genes might have functional consequences (Supplementary Table S5). The variability of the MYF5 gene has been associated with meat quality traits in pigs34, cattle35 andrab-bits36, and a missense substitution in the porcine PRKAG3 gene is a causal factor determining muscle glycolytic
potential37. Allelic variation in the PGAM2 gene has been associated with drip loss percentage in pigs38 and the
polymorphism of FABP4 shows associations with meat quality traits in multiple species39. The FABP4 gene
poly-morphism is associated with meat tenderness in three Chinese native sheep breeds40. Moreover, we have detected
twelve missense mutations in the ovine ryanodine receptor 1 (RYR1) gene, which has a high level of expression in the skeletal muscle, fulfills and essential role in muscle contraction and it is a strong determinant of post-mortem meat pH in pigs41. In humans, over 300 mutations in ryanodine receptors have been linked to severe skeletal and
cardiac muscle disorders42. A practical application of the catalogue of mutations generated in the current work
would be the genotyping of sets of selected polymorphisms in reference populations with available production records in order to investigate if they are associated with meat quality traits of economic importance for the sheep industry.
Conclusions
In summary, our results indicate that a substantial proportion (51–67%) of the transcriptional output of the ovine skeletal muscle is contributed by a few hundred of genes (≈1% of expressed loci) which are mainly involved in muscular contraction, metabolism, calcium transport and energy homeostasis. The broad majority of SNP var-iants mapping to muscle transcripts are shared by at least two of the breeds under analysis, a result that could be the consequence of admixture as well as of recent divergence from a single domestication site.
References
1. Clark, E. L. et al. A high resolution atlas of gene expression in the domestic sheep (Ovis aries). PLoS Genet. 13, e1006997 (2017). 2. Zhang, C. et al. Characterization and comparative analyses of muscle transcriptomes in Dorper and Small-Tailed Han sheep using
RNA-Seq technique. PLoS ONE 8, e72686 (2013).
3. Suárez-Vega, A., Gutiérrez-Gil, B., Klopp, C., Tosser-Klopp, G. & Arranz, J. J. Comprehensive RNA-Seq profiling to evaluate lactating sheep mammary gland transcriptome. Sci. Data 3, 160051 (2016).
4. Chao, T. et al. Identification and classification of new transcripts in Dorper and Small-Tailed Han sheep skeletal muscle transcriptomes. PLoS ONE 11, e0159638 (2016).
5. Piskol, R., Ramaswami, G. & Li, J. B. Reliable identification of genomic variants from RNA-Seq data. Am. J. Hum. Genet. 93, 641–651 (2013).
6. Cirulli, E. T. et al. Screening the human exome: a comparison of whole genome and whole transcriptome sequencing. Genome Biol. 11, R57 (2010).
7. Suárez-Vega, A., Gutiérrez-Gil, B., Klopp, C., Tosser-Klopp, G. & Arranz, J. J. Variant discovery in the sheep milk transcriptome using RNA sequencing. BMC Genomics 18, 170 (2017).
8. Bolger, A. M., Lohse, M. & Usadel, B. Trimmomatic: a flexible trimmer for Illumina sequence data. Bioinformatics 30, 2114–2120 (2014).
9. Dobin, A. et al. STAR: ultrafast universal RNA-seq aligner. Bioinformatics 29, 15–21 (2013).
10. Liao, Y., Smyth, G. K. & Shi, W. FeatureCounts: an efficient general purpose program for assigning sequence reads to genomic features. Bioinformatics 30, 923–930 (2014).
11. Love, M. I., Huber, W. & Anders, S. Moderated estimation of fold change and dispersion for RNA-seq data with DESeq2. Genome
Biol. 15, 550 (2014).
12. Anders, S. & Huber, W. Differential expression analysis for sequence count data. Genome Biol. 11, R106 (2010).
13. Shannon, P. et al. Cytoscape: a software environment for integrated models of biomolecular interaction networks. Genome Res. 13, 2498–2504 (2003).
14. Wu, G., Dawson, E., Duong, A., Haw, R. & Stein, L. ReactomeFIViz: a Cytoscape app for pathway and network-based data analysis.
F1000Res 3, 146 (2014).
15. Fang, H. et al. Reducing INDEL calling errors in whole genome and exome sequencing data. Genome Med 6, 89 (2014).
16. Quinlan, A. R. & Hall, I. M. BEDTools: a flexible suite of utilities for comparing genomic features. Bioinformatics 26, 841–842 (2010). 17. Cingolani, P. et al. A program for annotating and predicting the effects of single nucleotide polymorphisms, SnpEff: SNPs in the
genome of Drosophila melanogaster strain w1118; iso-2; iso-3. Fly 6, 80–92 (2012).
18. Sherry, S. T. et al. dbSNP: the NCBI database of genetic variation. Nucleic Acids Res. 29, 308–311 (2001).
19. Noce, A. et al. Expression patterns and genetic variation of the ovine skeletal muscle transcriptome of sheep from five Spanish meat breeds. Figshare. https://figshare.com/articles/5_breeds_sheep_novel_SNP/5011838 (2017).
20. Sabino, M. et al. Gene co-expression networks in liver and muscle transcriptome reveal sex-specific gene expression in lambs fed with a mix of essential oils. BMC Genomics 19, 236 (2018).
21. Mele, M. et al. The human transcriptome across tissues and individuals. Science 348, 660–665 (2015).
22. Geeves, M. A. & Holmes, K. C. Structural mechanism of muscle contraction. Annu. Rev. Biochem. 68, 687–728 (1999). 23. Rich, P. R. & Maréchal, A. The mitochondrial respiratory chain. Essays Biochem. 47, 1–23 (2010).
24. Raffaello, A., Mammucari, C., Gherardi, G. & Rizzuto, R. Calcium at the center of cell signaling: interplay between endoplasmic reticulum, mitochondria, and lysosomes. Trends Biochem. Sci. 41, 1035–1049 (2016).
25. Sahlin, K. & Harris, R. C. The creatine kinase reaction: a simple reaction with functional complexity. Amino Acids 40, 1363–1367 (2011).
26. Lunt, S. Y. & Vander Heiden, M. G. Aerobic glycolysis: meeting the metabolic requirements of cell proliferation. Annu. Rev. Cell Dev.
Biol. 27, 441–464 (2011).
27. Ohlendieck, K. Proteomics of skeletal muscle glycolysis. Biochim. Biophys Acta 1804, 2089–2101 (2010).
28. Manunza, A. et al. Population structure of eleven Spanish ovine breeds and detection of selective sweeps with BayeScan and hapFLK.
29. Hague, M. T. J. & Routman, E. J. Does population size affect genetic diversity? A test with sympatric lizard species. Heredity 116, 92–98 (2016).
30. Stachowicz, K., Sargolzaei, M., Miglior, F. & Schenkel, F. S. Rates of inbreeding and genetic diversity in Canadian Holstein and Jersey cattle. J. Dairy Sci. 94, 5160–5175 (2011).
31. Djari, A. et al. Gene-based single nucleotide polymorphism discovery in bovine muscle using next-generation transcriptomic sequencing. BMC Genomics 14, 307 (2013).
32. Gravel, S. et al. Demographic history and rare allele sharing among human populations. Proc. Natl. Acad. Sci. USA 108, 11983–11988 (2011).
33. Kijas, J. W. et al. Genome-wide analysis of the world’s sheep breeds reveals high levels of historic mixture and strong recent selection.
PLoS Biol. 10, e1001258 (2012).
34. Liu, M. et al. Association of MYF5 and MYOD1 gene polymorphisms and meat quality traits in Large White × Meishan F2 pig
populations. Biochem. Genet. 46, 720–732 (2008).
35. Ujan, J. A., Zan, L. S., Ujan, S. A., Adoligbe, C. & Wang, H. B. Back fat thickness and meat tenderness are associated with a 526 T → A mutation in the exon 1 promoter region of the MyF-5 gene in Chinese Bos taurus. Genet. Mol. Res. 10, 3070–3079 (2011). 36. Wang, J. et al. Genetic effect of Myf5 gene in rabbit meat quality traits. J. Genet. 96, 673–679 (2017).
37. Milan, D. et al. A mutation in PRKAG3 associated with excess glycogen content in pig skeletal muscle. Science 288, 1248–1251 (2000).
38. Fontanesi, L., Davoli, R., Nanni Costa, L., Scotti, E. & Russo, V. Study of candidate genes for glycolytic potential of porcine skeletal muscle: identification and analysis of mutations, linkage and physical mapping and association with meat quality traits in pigs.
Cytogenet. Genome Res. 102, 145–151 (2003).
39. Shin, S. C., Heo, J. P. & Chung, E. R. Genetic variants of the FABP4 gene are associated with marbling scores and meat quality grades in Hanwoo (Korean cattle). Mol. Biol. Rep. 39, 5323–5330 (2012).
40. Xu, Q. L. et al. The FABP4 gene polymorphism is associated with meat tenderness in three Chinese native sheep breeds. Czech J.
Anim. Sci. 56, 1–6 (2011).
41. Rosenvold, K. & Andersen, H. J. Factors of significance for pork quality-a review. Meat Sci. 64, 219–237 (2003). 42. Van Petegem, F. Ryanodine receptors: structure and function. J. Biol. Chem. 287, 31624–31632 (2012).
Acknowledgements
This research was partially funded by a grant (RZ2011-00015-C03-01) from the Instituto Nacional de Investigación y Tecnología Agraria y Alimentaria (Spain) and by the CERCA Programme/Generalitat de Catalunya. We acknowledge financial support from the Spanish Ministry of Economy and Competitiveness through the Severo Ochoa Programme for Centres of Excellence in R&D 2016-2019 (SEV-2015-0533). A. Cánovas received a fellowship from the Juan de la Cierva program (JCI-2011-10804). Tainã F Cardoso was funded with a fellowship from the CAPES Foundation-Coordination of Improvement of Higher Education, Ministry of Education (MEC) of the Federal Government of Brazil. The authors are grateful to the Canaria de Pelo, Gallega Ripollesa, Roja Mallorquina and Xisqueta breeding associations for their collaboration in sample collection.
Author Contributions
M.A., J.V.D., J. Cas., M.P., G.M.V. and O.V. conceived and designed the experiments; A. Mar., A.P., L.A.B., V.L., S.A., A.S., J.J. and J. Cap. collected muscle samples; A.N. did the RNA extractions; T.F.C. made the RNA-Seq analysis; A.N., A. Man. and A.C. contributed to the bioinformatic analyses; M.A. and T.F.C. wrote the manuscript; all authors discussed the data and read and approved the contents of the manuscript.
Additional Information
Supplementary information accompanies this paper at https://doi.org/10.1038/s41598-018-28760-9.
Competing Interests: The authors declare no competing interests.
Publisher's note: Springer Nature remains neutral with regard to jurisdictional claims in published maps and
institutional affiliations.
Open Access This article is licensed under a Creative Commons Attribution 4.0 International
License, which permits use, sharing, adaptation, distribution and reproduction in any medium or format, as long as you give appropriate credit to the original author(s) and the source, provide a link to the Cre-ative Commons license, and indicate if changes were made. The images or other third party material in this article are included in the article’s Creative Commons license, unless indicated otherwise in a credit line to the material. If material is not included in the article’s Creative Commons license and your intended use is not per-mitted by statutory regulation or exceeds the perper-mitted use, you will need to obtain permission directly from the copyright holder. To view a copy of this license, visit http://creativecommons.org/licenses/by/4.0/.