ASA CONFERENCE 2019
Statistics for Health and Well-being
BOOK OF SHORT PAPERS
Maurizio Carpita and Luigi Fabbris
Editors
ASA Conference 2019 - Book od Short Papers Statistics for Health and Well-being University of Brescia, September 25-27, 2019 Maurizio Carpita and Luigi Fabbris (Editors) ISBN: 978-88-5495-135-8 This Book is published only in pdf format. Copyright © 2019 CLEUP sc Cooperativa Libraria Editrice University of Padova via G. Belzoni 118/3 35121 Padova [email protected]
INTRODUCTION
This Book includes a selection of 53 peer-reviewed short papers submitted to the Scientific Conference "Statistics for Health and Well-Being", held at the University of Brescia from 25 to 27 September, 2019.
The Conference, aimed at promoting applications that use statistical techniques and models suitable for health and well-being analyses, was organized by the ASA (Association for Applied Statistics) and the DMS StatLab (Data Methods and Systems Statistical Laboratory) of the Department of Economics and Management, University of Brescia.
The programme of the Conference included 25 parallel sessions with a total of 82 contributions with about 100 attendants, 4 plenary sessions (organised by ISTAT, the Italian National Statistical Institute, and USCI, the Statistical Union Italian Municipalities; SIS, the Italian Statistical Society, and ASA; AICQ-CN, the Italian Association for Quality Culture-North and Centre of Italy, and AISS, the Italian Academy for Six Sigma; and DBSPORTS, Big Data Analytics in Sports Project, respectively) and 4 special events (ISTAT and ASA Open Conference with the President of ISTAT, IASA Sensory Experiment, Visit to Capitolium, and Kick-off meeting ISI-SPG in Sports Statistics). Thank you very much to Eugenio Brentari, Chair of the Local Program Committee. For more information about the programme and other material visit the website www.sa-ijas.org/statistics-for-health-and-well-being/.
As co-chairs of the ASA Conference 2019, we are very grateful to the authors for submitting their interesting research with various real application of statistics in so many contexts of health and well-being, and to the members of the Scientific Committee for collaborating to the peer-reviewing process. October, 2019 Co-chair Scientific Program Committee Maurizio Carpita Luigi Fabbris University of Brescia University of Padova
Conference session topics include, but are not limited to, the following areas of special interest:
Health and healthcare Education and health Health Psychology Work and life balance Economic well-being
Social relationships and social health Welfare and well-being
Safety and security Subjective well-being Environment and pollution
Innovation, research and creativity Quality of health services
Equitable and sustainable well-being
Resilience and vulnerability Sport, Health and wellbeing Sport analytics
Health and fitness Sport psychology Statistics and tourism
Food and beverage, health, well-being and life quality Qualitative and quantitative methods for sensory analysis Psychology and food
Food and beverage industries and markets
Methods and models for health and well-being analysis Technology for health analysis
Scientific Program Committee: Local Program Committee:
Luigi Fabbris (University of Padua, co-chair) Maurizio Carpita (University of Brescia, co-chair) Giuseppe Arbia (SIS - Università Cattolica di Milano) Rossella Berni (University of Florence)
Matilde Bini (SIS - European University of Rome) Giovanna Boccuzzo (University of Padova) Eugenio Brentari (University of Brescia) Vittoria Buratta (ISTAT)
Giulia Cavrini (University of Bolzano-Bozen)
Alessandro Celegato (AICQ-AISS, PSV Project Service and Value) Giuliana Coccia (ISTAT)
Adriano Decarli (University of Milan)
Tonio Di Battista (‘G. D’Annunzio’ University of Chieti and Pescara) Simone Di Zio (‘G. D’Annunzio’ University of Chieti and Pescara) Benito Vittorio Frosini (Sacred Heart Catholic University of Milan) Antonio Giusti (University of Florence)
Silvia Golia (University of Brescia)
Maria Gabriella Grassia (Federico II University of Naples) Maria Iannario (Federico II University of Naples)
Domenica Fioredistella Iezzi (Tor Vergata University of Rome) Michele Lalla (University of Modena and Reggio Emilia) Fabio Lucidi (SIPSA - La Sapienza University of Rome) Marica Manisera (University of Brescia)
Paolo Mariani (University of Milan-Bicocca) Francesco Mola (University of Cagliari)
Antonio Mussino (La Sapienza University of Rome) Luigi Odello (International Academy of Sensory Analysis) Francesco Palumbo (Federico II University of Naples) Maurizio Pessato (Assirm)
Alessandra Petrucci (University of Florence) Alfonso Piscitelli (Federico II University of Naples) Marco Trentini (Unione Statistica Comuni Italiani) Fabio Vernau (Federico II University of Naples) Domenico Vistocco (Federico II University of Naples) Paola Zuccolotto (University of Brescia)
Eugenio Brentari (University of Brescia, chair) Maurizio Carpita (University of Brescia) Silvia Golia (University of Brescia) Marica Manisera (University of Brescia) Manlio Migliorati (University of Brescia) Anna Simonetto (University of Brescia) Marika Vezzoli (University of Brescia)
Mariangela Zenga (University of Milano-Bicocca) Paola Zola (University of Brescia)
Paola Zuccolotto (University of Brescia)
Visit to the Capitolium. Brescia, 26th September 2019
INDEX OF SHORT PAPERS
Giuseppe Alfonzetti, Laura Rizzi, Luca Grassetti, Michele Gobbato
Observed expenditures vs estimated burden of health care: a comparative evaluation based on spatial analysis ... pag. 1 Pietro Amenta, Antonio Lucadamo, Gabriella Marcarelli
Computing ordinal consistency thresholds for pairwise comparison matrices ... pag. 5 Ilaria Lucrezia Amerise, Agostino Tarsitano
Household wealth and consumption in Italy: analysis by density-weighted quantile regression ... pag. 9 Fabrizio Antolinia, Francesco Giovanni Truglia
Ecotourism and food geographic areas ... pag. 13 Bruno Arpino, Silvia Bacci, Leonardo Grilli, Raffaele Guetto, Carla Rampichini
Issues in prior achievement adjustment for value added analysis: an application to Invalsi tests in Italian schools ... pag. 17 Silvia Bacci, Bruno Bertaccini, Alessandra Petrucci
Museum preferences analysis: an item response model applied to network data ... pag. 21 Chiara Bocci, Silvana Salvini
Elderly with and without children: do they report different health conditions? ... pag. 25 Chiara Bocci, Laura Grassini, Emilia Rocco
A multi-inflated hurdle regression model for the total number of overnight stays of Italian tourists in the years of the economic recession ... pag. 29 Riccardo Borgia, Elena Castellari, Paolo Sckokai
Family lifestyle habits: what is passed down from adults to children? ... pag. 33 Elena Bortolato, Luigi Fabbris, Marco Vivian
Quantity and mood of final open-ended comments on an Erasmus+ VET mobility questionnaire pag. 37 Rafaela Soares Bueno, Luiz Sá Lucas, Ana Carolina Sá Lucas
Balancing multi-class imbalanced data into a training dataset using SCUT method ... pag. 41 Stefania Capecchi, Carmela Cappelli, Maurizio Curtarelli, Francesca Di Iorio
Investigating well-being at work via composite indicators ... pag. 45 Maurizio Carpita, Enrico Ciavolino, Paola Pasca
Exploring the statistical structure of soccer team performance variables using the Principal Covariates Regression ... pag. 49 Maurizio Carpita
The mobile phone big data tell the story of the impact of Christo's The Floating Piers on the Lake Iseo ... pag. 53 Daniela Caso, Maria Iannario, Francesco Palumbo
Athletes’ mental skills, personality and other drivers to assess the performance in a study on volleyball ... pag. 57 Rosanna Cataldo, Maria Gabriella Grassia, Marina Marino
Partial Least Squares Path Modelling approach for sustainability using qualitative information ... pag. 61 Carlo Cavicchia, Pasquale Sarnacchiaro, Maurizio Vichi
A composite indicator via hierarchical disjoint factor analysis for measuring the Italian football teams’ performances ... pag. 65
Giulia Cavrini, Andrea Lazzerini
The determinants of vaccination behaviour of general practitioners in South Tyrol: Differences and similarities between Italian and German respondents ... pag. 69 Anna Crisci, Luigi D’Ambra
Analysis of the financial performance in Italian football championship clubs via longitudinal count data and diagnostic test ... pag. 73 Angela Maria D'Uggento, Nunziata Ribecco, Ernesto Toma, Ignazio Grattagliano
Cyberbullying: a threat for relationships and social health ... pag. 77 Cristina Davino, Pasquale Dolce, Stefania Taralli, Domenico Vistocco
Quantile Composite-based path modelling to handle differences in territorial well-being ... pag. 81 Gioia Di Credico, Jerry Polesel, Luigino Dal Maso,Carlo La Vecchia, Francesco Pauli, Nicola Torelli, Valeria Edefonti
Modeling the joint effect of intensity and duration of alcohol drinking with bivariate spline models pag. 85 Matteo Di Maso, Laura Tomaino, Monica Ferraroni, Carlo La Vecchia, Valeria Edefonti, Francesca Bravi
Potential impact fraction for a continuous risk factor: assessing the burden of oral and pharyngeal cancer according to the adherence to the healthy eating index ... pag. 89 Leonardo Egidi, Nicola Torelli
Comparing statistical models and machine learning algorithms in predicting football outcomes .. pag. 93 Rosa Fabbricatore, Carla Galluccio, Cristina Davino, Daniela Pacella, Domenico Vistocco, Francesco Palumbo
The effects of attitude towards Statistics and Math knowledge on Statistical anxiety: a path model approach ... pag. 97 Luigi Fabbris, Alessandra Andreotti, Bruno Genetti, Paolo Vian, Claudia Mortali, Luisa Mastrobattista, Adele Minutillo, Roberta Pacifici
Personal and familial determinants of gambling risk among adolescent Italian students ... pag. 101 Francesca Fortuna, Giulia Caruso, Tonio Di Battista
A functional data analysis of Google Trends on health and wellness ... pag. 105 Alberto Franci, Pietro Renzi
Measuring health inequalities: some application in Marche region ... pag. 109 Carlotta Galeone, Rossella Bonzi, Federica Turati, Claudio Pelucchi, Carlo La Vecchia
Socioeconomic inequalities and cancer risk: the challenges and opportunities of worldwide epidemiological data consortia ... pag. 113 Ilaria Giordani, Gaia Arosio, Ilaria Battiston, Francesco Archetti
A data analytics framework: medical prescription pattern dynamics ... pag. 117 Laura Giuntoli, Giulio Vidotto
Applying network modelling to uncover the relationships among well-being dimensions ... pag. 121 Francesca Greco, Silvia Monaco, Michela Di Trani, Barbara Cordella
Emotional text mining and health psychology: the culture of organ donation in Spain ... pag. 125 Elena Grimaccia, Alessia Naccarato
Validation of a food insecurity scale through structural equation models ... pag. 129 Maria Iannario, Domenico Vistocco, Maria Clelia Zurlo
A mixture model with discrete variables for depression diagnosis in infertile couples ... pag. 133 Rosaria Lombardo, Ida Camminatiello, Antonello D’Ambra
Alessandro Lubisco, Stefania Mignani, Carlo Trivisano
Assessment of game actions performance in water polo: a data analytic approach ... pag. 141 Luiz Sá Lucas, Ana Carolina Sá Lucas, Rafaela Bueno
Selecting features for Machine Learning in Alzheimer’s diagnostics ... pag. 145 Paolo Mariani, Andrea Marletta, Nicholas Missineo
Missing values in social media: an application on Twitter data ... pag. 149 Milica Maricic
Application of multivariate statistics in sports: exploration of recall and recognition of UEFA Champions League sponsors ... pag. 153 Daria Mendola, Paolo Li Donni
Short-run and long-run persistence of bad health among elderly ... pag. 157 Vittorio Nicolardi, Caterina Marini
Harmonised Administrative Databases: a new approach in the era of Big Data ... pag. 161 Antonio Notarnicola, Vito Santarcangelo, Nicola Martullib, Francesco Abbondanza
The blockchain for the certification of the dairy supply chain, the “Lucanum” basket and the bakery products for well-being ... pag. 165 Omar Paccagnella, Ilaria Zanin
Another look at the relationship between perceived well-being and income satisfaction ... pag. 169 Anna Parola, Francesco Palumbo
Profile pattern of italians NEET by nonlinear PCA ... pag. 173 Anna Maria Parroco, Vincenzo Giuseppe Genova, Laura Mancuso, Francesca Giannone
Assessing mental health therapeutic communities functioning ... pag. 177 Eugenio Pomarici, Alfonso Piscitelli, Luigi Fabbris, Raffaele Sacchi
A pre-post sensory experiment on the effect of a seminar on olive oil preferences of Italian consumers ... pag. 181 Luca Romagnoli, Luigi Mastronardi
Understanding local administrations policies effects on well-being in Italian inner areas ... pag. 185 Vito Santarcangelo, Emilio Massa, Diego Carmine Sinitò, Giuseppe Scavone
Intelligent systems to support patients ... pag. 189 Anna Simonetto, Silvia Golia, Buirma Malo, Gianni Gilioli
Food quality perception in children: a comparison between Bayesian Network and Structural Equation Modelling ... pag. 193 Federico M. Stefanini, Yura Loscalzo
The studyholism comprehensive model: towards a bayesian reanalysis ... pag. 197 Alessio Surian, Andrea Sciandra
City Prosperity Index: a comparative analysis of Latin American and Mediterranean cities based on well-being and social inclusion features ... pag. 201 Emma Zavarrone, Maria Gabriella Grassia, Rocco Mazza
Invariance in the structural topic models ... pag. 205 Paola Zola, Costantino Ragno, Paulo Cortez
Inferring Twitter users home location based on trend topics ... pag. 209
Exploring the statistical structure of soccer team performance
variables using the Principal Covariates Regression
Maurizio Carpita
a, Enrico Ciavolino
b, Paola Pasca
ba Department of Economics and Management. University of Brescia, Italy;
bDepartment of History, Society and Human Studies. University of Salento, Lecce, Italy.
1. Introduction
In the Data Science panorama, great room for indicators building, as well as predictive modeling is represented by sports data. Match outcome is a non-ambiguous, well-defined re-sponse variable that lends itself to the application of statistical learning models. In addiction, the availability of data related to sports players reveals what components of players’ perfor-mance matter the most, thus representing a topic of particular interest for decision making and best choices in the competitive framework. The European Soccer database, available on Kaggle (KES database) incorporates data about both players and teams of about 20,000 soccer matches for seasons 2009-2015 in 10 different European countries (Carpita et al., 2019b-c). Experts of the EA Sports FIFA videogame (see the website sofifa.com) state that the performance of a soccer player is made up of 7 broad dimensions (power, mentality, skill, movement, attacking, defendingand goalkeeping), each of which incorporates, in turn, more specific skills to be de-veloped and mastered by players on the pitch (e.g. finishing, volleys, crossing, short passing, headingas components of the attacking ability)1.
Relying on experts’ suggestion, Carpita et al. (2019b) modify the original indicators related to the 7 sofifa dimensions by incorporating the four player roles (forward, midfielder, defender, goalkeeper): results showed that performance skills might play a more or less consistent role according to where players are located in the pitch. However, no statistical inquiry has been carried out on sofifa experts’ performance indicators. Correlations among them revealed an unclear dimensional structure, making multicollinearity concerns, as well as the reconstruction of broad performance areas worth to be examined in detail. As a first development, Carpita et al. (2019a) used a non-supervised clustering technique for multivariate data which, however, did not significantly improve prediction of match results.
For this reason, it is worth to examine the KES database with clustering techniques that also encompass prediction objectives. Principal Covariates Regression (PCovR) fits this purpose: it simultaneously reduces the predictors to a few components and regresses the criterion on these components (De Jong and Kiers, 1992). The predictive performances of the PCovR components are compared with the experts’ sofifa indicators using the Skellam Model, a regression variation that best fits the distribution of home and team goal differences (Karlis and Ntzoufras, 2008).
2. Methods
Principal Covariates Regression This procedure was developed by De Jong and Kiers (1992) to deal with the interpretational and technical problems that emerge when a regression analysis is performed on a relatively high number of predictor variables. The method simultaneously reduces the matrix of the predictor variables X (N , units ×J , variables) to a limited number 1The 33 original performance variables and their sofifa classification in 7 dimensions are in the first three
columns of Table 1 at page 3 of this short paper.
ASA Conference 2019 - Book of Short Papers
Maurizio Carpita and Luigi Fabbris (Editors) Statistics for Health and Well-being Brescia, September 25-27, 2019
CLEUP Coop. Libraria Editrice
of components and regresses the vector of the criterion variable y (N × 1) directly on these components. A parameter α ∈ [0; 1] allows to emphasize the Principal Components Regression (PCR, α = 1) over the Reduced-Rank Regression (RRR, α = 0), both being an integral part of PCovR. This translates into a flexible tuning on predictors reconstruction rather than on the predictive power of the regression model and vice versa. PCovR aims at minimizing the loss function: L = α ·||X − T PX|| 2 ||X||2 + (1 − α) · ||y − T Py|| 2 ||y||2 .
The left part of L concerns dimension reduction: T is an N × R score matrix that contains the scores of the N observations on the R components, PX is the R × J loading matrix that
contains the loadings of the predictor variables on the J components. In the right part of L, the criterion variable y is simultaneously regressed on the J components, thus the vector Py
(R × 1) contains the resulting regression weights for the criterion variable. The R package PCovRallows Vervloet et al. (2015) to carry out PCovR by flexibly setting:
• the number of components to extract; • the value of the parameter α;
• the rotation option.
In this study, for the loss function L the difference between the home and away team of the first 28 performance variables2in Table 1 are used as X, and the goals’ difference is used as y.
Moreover, the choice of 4 components with the rotation option varimax provide stable results independently to the α value (the automatic procedure would emphasize the PCR part of L). Skellam Regression Consider the number of goals scored in a match as a pair of counts (H,A), where H is the number of goals scored by the home team and A the number of goals scored by the away team, so that Y = (H − A) is the goals’ difference (if Y > 0 the home team won; if Y = 0 the home team drew; if Y < 0 the home team lost). Assuming that (H,A) is generated by a bivariate Poisson distribution with positive parameters λH, λA and positive
covariance parameter λHA, the random variable Y has the Skellam (or Poisson Difference)
distribution, which does not depend on correlation between H and A. Under these assumptions, the Skellam regression model specification for the random variable of the goals’ difference Y is the following (Karlis and Ntzoufras, 2008):
Y ∼ Skellam(λH, λA)
log(λH) = µH + zTβH
log(λA) = µA+ zTβA
where z is the (K × 1) vector of the standardized differences between the home and away team performance indicators (simple averages of the variables grouped using the classification in Table 1) by each of the four players roles, and we expect that for the parameter’s vectors βH > 0 and βA < 0 (Carpita et al., 2019b; Pelechrinis and Winston, 2018).
2The five goalkeeping variables have been excluded from the analysis for two main reasons: first, those
vari-ables only belong to the goalkeepers role, thus produced a large amount of NAs for other players’ roles; second, from an interpretational point of view, the goalkeeping is a very specific role (e.g. variables such as handling or divingare allowed for goalkeepers role only) thus it has not been considered worth to be included in the PCovR.
ASA Conference 2019 - Book of Short Papers
Maurizio Carpita and Luigi Fabbris (Editors) Statistics for Health and Well-being Brescia, September 25-27, 2019
CLEUP Coop. Libraria Editrice
3. Results
The last two columns in Table 1 gives the two classifications, according to experts (sofifa) and PCovR (pcovr) with R = 4 components and α = 0.5. For the pcovr classification, the correlation between each variable x and its component with the max column value of the loading matrix PX is shown in brackets; these correlations are positive and much higher than those with
the other three components, with the exception of x2, x3 and x6. The 1st component contains
variables belonging to heterogeneous dimensions in experts’ classifications; the 2ndcomponent
is still mainly characterized by the defending abilities; the 3rd components incorporates most of the abilities in the movement dimension, along with the stamina variable, while the latter components is made up by all the variables related to an aggressive response in the match.
Variables Classifications Variables Classifications Label Long Name sofifa pcovr Label Long Name sofifa pcovr x01 shot power power comp 1(0.626) x19 acceleration movement comp 3(0.881)
x02 jumping power comp 4(0.543) x20 sprint speed movement comp 3(0.848)
x03 stamina power comp 3(0.422) x21 agility movement comp 3(0.769)
x04 strength power comp 4(0.727) x22 reactions movement comp 1(0.651)
x05 long shots power comp 1(0.770) x23 balance movement comp 3(0.659)
x06 aggression mentality comp 4(0.486) x24 crossing attacking comp 1(0.695)
x07 interceptions mentality comp 2(0.691) x25 finishing attacking comp 1(0.687)
x08 positioning mentality comp 1(0.650) x26 heading attacking comp 4(0.787)
x09 vision mentality comp 1(0.768) x27 short passing attacking comp 1(0.788)
x10 penalties mentality comp 1(0.654) x28 volleys attacking comp 1(0.726)
x11 dribbling skill comp 1(0.725)
x12 curve skill comp 1(0.766) x29 diving goalkeeping goalkeeping x13 free kick skill comp 1(0.726) x30 handling goalkeeping goalkeeping x14 long passing skill comp 1(0.702) x31 kicking goalkeeping goalkeeping x15 ball control skill comp 1(0.805) x32 gok positioning goalkeeping goalkeeping x16 marking defending comp 2(0.881) x33 reflexes goalkeeping goalkeeping x17 standing tackle defending comp 2(0.892)
x18 sliding tackle defending comp 2(0.886)
Table 1: Summary of sofifa and pcovr classifications of the 33 variables of the KES database The Regression weights vector with the correlations between y and the four components is Py = (0.286, 0.097, 0.139, 0.126)T, so that the criterion variable (the goals’ difference) is more
positively correlated with the first and the third components. Note that correlations for the cri-terion variable y are lower than correlations for the performance variables x: as a consequence, the proportion of explained variance for y is only 13% and for x is 66%, so that the weighted sum of the variance accounted for y and x by the four components is 39%. These results could be expected because, considering the correlations between all the 28 predictor variables x: the average is 0.32, the median is +0.29, the third quartile is 0.48 and the maximum is 0.87.
Considering the results for the Skellam regression model for the goals’ difference, both sofifa and pcovr predictors z have significant parameters with the expected positive signs for the home team and negative for the away team equation. Table 2 illustrates the main results, with some diagnostics obtained with a 75%-25% split for training and testing: results are very similar, and suggest that the use of the different predictors z does not modify the predictive abilities of the Skellam regression model, for what concerns the final match results. However, note that the number of pcovr predictors (13) is lower than the number of sofifa predictors (22).
ASA Conference 2019 - Book of Short Papers
Maurizio Carpita and Luigi Fabbris (Editors) Statistics for Health and Well-being Brescia, September 25-27, 2019
CLEUP Coop. Libraria Editrice
Predictors bic n.ind sigin.H sigin.A cor.OE rmse mae acc.3 acc.2 sen.2 spe.2
sofifa 57,579 22 11 10 0.406 1.621 1.262 0.523 0.597 0.820 0.405
pcovr 57,454 13 7 7 0.405 1.621 1.261 0.518 0.591 0.816 0.398
Legend: bic: bayesian information criterion for the model; n.ind: number of indicators in each equation of the model; sigin.H-A: number of indicators with significance < 0.15 in equations H and A; cor.OE: correlation between observed and estimated goal differences; rmse: root mean square error of the model; mae: mean absolute error of the model; acc.3: accuracy for the prediction of 3 results (W-D-L); acc.2: accuracy for the prediction of 2 results (W-NW); sen.2: sensitivity for the prediction of 2 results (W-NW); spe.2: specificity for the prediction of 2 results (W-NW).
Table 2: Skellam regression model diagnostics for sofifa and pcovr predictors
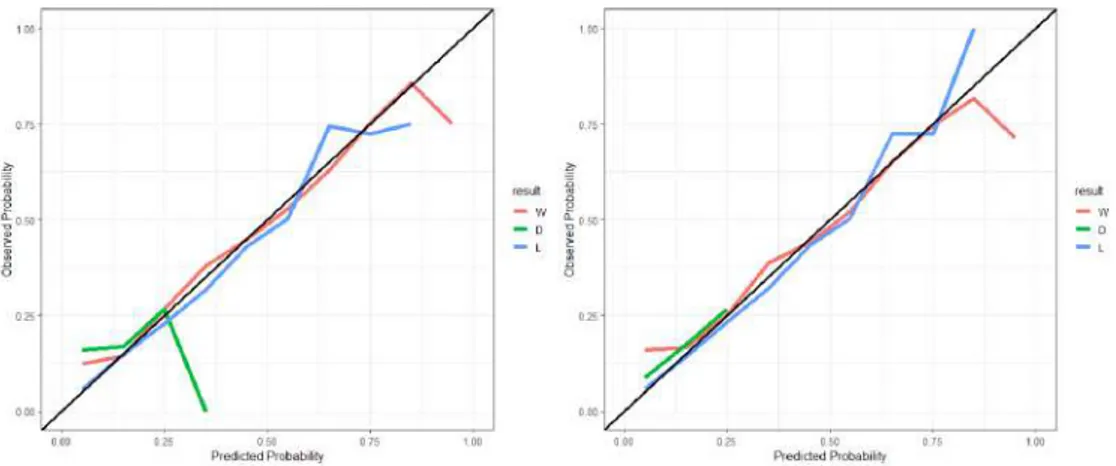
Finally, Fig. 1 illustrates the calibration curves for the match results (win, draw and loss) in sofifa(left) and pcovr (right): as it can be seen, the prediction for draws represent a problematic category for prediction (Pelechrinis and Winston, 2018), while the prediction for win approxi-mates the ideal the most, at least up to around 85%. For what concerns loss, for an observed probability > 75% the pcovr prediction tends to be under confident.
Figure 1: probability calibration curve for the Skellam regression model with 22 sofifa predic-tors (left) and 13 pcovr predicpredic-tors (right)
References
Carpita, M., Ciavolino, E., and Pasca, P. (2019a). Composite indicators of the Soccer Players’ Performance Indices. In Mariani P. (Editor): Data Science & Social Research 2019 Book of Abstracts,PKE Publisher, Milano (Italy), page 40.
Carpita, M., Ciavolino, E., and Pasca, P. (2019b). Exploring and modelling team performances of the kaggle european soccer database. Statistical Modelling, 19(1): pp. 74–101.
De Jong, S. and Kiers, H. A. (1992). Principal covariates regression: Part I. Theory. Chemo-metrics and Intelligent Laboratory Systems, 14(1-3): pp. 155–164.
Karlis, D. and Ntzoufras, I. (2008). Bayesian modelling of football outcomes: using the skel-lam’s distribution for the goal difference. IMA Journal of Management Mathematics, 20(2): pp. 133–145.
Pelechrinis, K. and Winston, W. (2018). Positional value in soccer: Expected league points added above replacement. arXiv.org – arXiv: 1807.07536 [stat.AP].
Vervloet, M., Kiers, H. A., Van den Noortgate, W., and Ceulemans, E. (2015). Pcovr: An R package for principal covariates regression. Journal of Statistical Software, 65(8): pp. 1–14.
ASA Conference 2019 - Book of Short Papers
Maurizio Carpita and Luigi Fabbris (Editors) Statistics for Health and Well-being Brescia, September 25-27, 2019
CLEUP Coop. Libraria Editrice