CONTENTS
1. EXECUTIVE SUMMARY ... 4
2. PREFACE ... 6
2.1 MELCOR Code ... 6
3 PWR 900 MW SEVERE ACCIDENT ANALYSIS ... 7
3.1 PWR Plant Description ... 7
3.2 MELCOR Nodalization Description ... 9
3.2.1 HS ... 10
3.2.2 COR model ... 10
3.2.3 DCH model ... 11
3.2.4 Start of transient condition (steady state) ... 11
3.3 Unmitigated Loss of Feed Water ... 12
3.3.1 Analysis of calculated data ... 12
3.3.1.1 Pressure trends ... 12
3.3.1.2 Core degradation phases ... 15
4. BWR FUKUSHIMA DAIICHI UNIT 1 SEVERE ACCIDENT MODEL ... 17
4.1 Boiling Water Reactors NPP Description ... 17
4.1.1 The BWR MARK 1 containment description ... 17
4.1.2 BWR safety systems ... 17
4.2 MELCOR 2.1 Model Developing ... 18
4.2.1 Thermal hydraulic model ... 19
4.2.1.1 Main TH data [26] ... 20
4.2.2 Safety valves ... 20
4.2.2.1 Drywell leaks ... 21
4.2.2.2 Pump leakage ... 22
4.2.3 Isolation condenser model ... 22
4.2.4 Water injection through fire engines ... 23
4.2.5 Containment model ... 24 4.2.6 HS ... 25 4.2.7 CORE model ... 26 4.2.8 RN package ... 30 4.2.9 DCH ... 30 4.2.10 Cavity ... 33 4.2.11 Burn ... 34
4.3 Reference Accident Description ... 34
4.4 Model Results and Comparison With Experimental Data ... 37
4.4.1 Water level into the RPV ... 37
4.4.2 RPV and DW Pressure ... 37
4.4.3 Core degradation ... 38
5. LARGE BREAK LOCA ANALYSES ... 41
5.2 MELCOR Steady State Calculation ... 41
6. ANALYSIS OF TWO UNMITIGATED LBLOCA TRANSIENTS ... 47
6.1 Analysis of the Severe Accident Caused by the Unmitigated Double-Ended Rupture of CL 1 ... 48
6.2 Analysis of the Severe Accident Caused by the Unmitigated Double-Ended Rupture of HL 1. ... 54
7. CONCLUSIONS ... 59
8. ABBREVIATIONS ... 61
1. EXECUTIVE SUMMARY
Following the Fukushima accident events, a particular attention on the severe accident mitigation strategies have been addressed by the International Scientific Community. This interest has induced the study of different transients in order to further understand the accidents progression and evaluate the consequence of severe accidents in terms of core damage and fission products release. Therefore, this kind of activities have become of great importance since they allow the study of severe accident management analyses and to plan potential first aid and prevention activities in order to minimize accidents consequences if a severe accident takes place in the NPP at the Italian Border.
It becomes clear how this kind of activities assume a key role also for Italy which, even it doesn’t use nuclear power in its national energy mix, should nonetheless maintain the scientific competences necessary to indipendentely analize severe accident sequences and to evaluate potential radionuclide release. Even if this kind of scenarios are characterized by a very low occurrence probability they could affect european reactors and in particular the ones next to italian borders (27 overall, within 200 km from national borders). Taking account of the italian experience in the nuclear field and of the strategical importance of this complex technology, it is therefore absolutely desirable continues to give contributes to the research activities in this field.
In general, the nuclear reactors are designed to maintain the fuel damage and radioactive release within authorized limits during selected postulated accident (Design Basis Accident - DBA). A severe accident is a Beyond Design Basis Accident (BDBA) involving significant core degradation. Several computational tools can be used to analyze a severe accident transient. Considering the length and the several interacting phenomena, taking place during a severe accident, integral codes with a modular design are used and permit a fast transient simulation reproducing the different coupled phenomena.
In the framework of the severe accident research activity developed by ENEA, the target of this work is to analyse, by using the MELCOR code obtained in the framework of the USNRC Research Program “Cooperative Severe Accident Research Program” (CSARP), transient scenarios that could take place in the nucler reactor at the Italian border.
In relation to the Pressurized Water Reactors (PWR) activities, two different kind of transient have been analysed using MELCOR code:
- Unmitigated Loss of Feedwater (LFW);
- Unmitigated Large Break Loss Of Coolant Accident (LBLOCA).
Concerning the LFW, the aim of this work is an update LFW (Loss of Feed Water) analysis by using the MELCOR code. Since the transient is postulated unmitigated and the actions of the operator are assumed to fail it evolves as a BDBA. The analysis focuses mainly in the characterization of the thermal hydraulic behavior, the in-vessel phenomena, the core degradation and corium behavior in the lower head.
Concerning the LBLOCA, the target of the activity has been to investigate the in-vessel consequences of two independent LBLOCA. In particular, the two severe accidents analyzed are initiated respectively by the unmitigated double-ended rupture of the Cold Leg (CL) and of the Hot Leg (HL) of the Loop 1 of reactor Primary Cooling System (PCS). The activity has been performed using the code MELCOR 2.1.
In relation to the Boiling Water Reactor (BWR) activity a nodalization of the Fukushima Daiichi Unit 1 capable to reproduce the accident occurred have been developed. The Fukushima Daichii Unit 1 severe accident (consequence of the March 11, 2011 heartquake and tsunami) was also analyzed and compared with the plant data now available with the aim to evaluate code accuracy for potential analogous analysis ragarding BWRs next to italian borders.
2. PREFACE
After the Fukushima accident the interest of each country, that uses nuclear power plants in its national energy mix, is more focused on the severe accident mitigation strategies. Several severe accident management analyses have been performed, to analyze the accident progression, the core damage, the grace period and the fission product release demonstrating the management strategy adequacy.
In general, the nuclear reactors are designed to maintain the fuel damage and radioactive release within authorized limits during selected postulated accident (Design Basis Accident). A severe accident is a Beyond Design Basis Accident involving significant core degradation. Several computational tools can be used to analyze a severe accident transient. Considering the length and the several interacting phenomena, taking place during a severe accident, integral codes with a modular design are used and permit a fast transient simulation reproducing the different coupled phenomena. Example of severe accident codes are ASTEC, MAAP and MELCOR [1], [2] and [3].
Though the nuclear energy is not part of the Italian energy mix, among the twenty-five NPPs in the Italian border areas, twenty are PWRs and five are BWR [4]. Therefore, the analyses of possible severe accident sequences are of interest for our national emergency preparedness strategy. Since fifteen of the twenty PWR type reactors have a net electric power of about 900 MWe, the reference reactor considered for this analysis is a generic PWR three loops design like of 900 MWe.
The aim of this work is a new LFW (Loss of Feed Water) analysis, with the updated input, by using the MELCOR code. Since the transient is postulated unmitigated and the actions of the operator are assumed to fail it evolves as a BDBA. The analysis focuses mainly in the characterization of the thermal hydraulic behavior, the in-vessel phenomena, the core degradation and corium behavior in the lower head.
The Fukushima Daichii Unit 1 severe accident (consequence of the March 11, 2011 heartquake and tsunami) was also analyzed and compared with the plant data now available.
2.1
MELCOR Code
MELCOR is a fully integrate severe accident code able to simulate the thermal-hydraulic phenomena in steady and transient condition and the main severe accident phenomena characterizing the RPV, the reactor cavity, the containment, and the confinement buildings typical of LWR. The estimation of the source term is obtained by the MELCOR code as well. The code is based on the “control volume” approach. MELCOR can be used with the Symbolic Nuclear Analysis Package (SNAP) in order to develop the nodalization and for the post processing data by using its animation model capabilities.
MELCOR has a modular structure and is based on packages. Each package simulates a different part of the transient phenomenology. In particular the CVH and FL packages simulate the mass and energy transfer between control volumes, the HS package simulates the thermal response of the heat structure and the COR evaluates the behavior of the fuel and core structures. It is to underline that the role of the CVH/FP packages that provide the boundary condition for other packages.
MELCOR is being developed at Sandia National Laboratories for the US Nuclear Regulatory Commission (NRC) [7] and [12].
3 PWR 900 MW SEVERE ACCIDENT ANALYSIS
3.1
PWR Plant Description
The reference reactor, chosen for this analysis, is a generic PWR three loops design like of 900 MWe [5] and [6]. The state of the art severe accident code, chosen for this analysis, is the MELCOR code [7]. A simplified preliminary, but exhaustive, MELCOR nodalization of the reference NPP, briefly described below, has been developed [8] and [18].
In general, this kind of reactor is characterized by 3 loops; each loop is constituted by a single Hot Leg (HL) a single U tube SG, a loop seal, a single Cold Leg (CL) with a centrifugal pump. A Pressurizer (PRZ) is connected to one loop of the reactor through the surge line. The thermal power of the reactor is around 2700 MWth, the pressure of the primary system is around 15.5 MPa, the SG heat transfer surface is around 5000 m2 and the PRZ volume is around 40 m3. Safety Relief Valves (SRV) and PORV valves are installed in the PRZ and are connected to a Pressurizer Relief Tank (PRT). SRV valves are installed in each SG.
The system is located in a containment divided in several parts as the basement, the cavity, the SGs cubicle, the PRZ cubicle and the lower/upper dome part. All the structures of the containment (equipment’s, walls, floors and ceiling) during a transient, involving the containment, absorb/release energy and are the place where the fission products can deposit.
Reactor thermal power, MWth 2775 Heat generated into the fuel, % 97.4 Primary circuit nominal pressure, MPa (a) 15.51 Total mass flow rate, kg/s 13734
Loop number 3
Pressure Vessel Height, m 13
Internal diameter, m 4
Mass, t 355
Thickness, mm 202
Core Linear power, W/cm 178.5
Inlet core temperature, °C 291.7 Core temperature difference, °C 36.9
Fuel assemblies Number 157
Rods per assembly 264
Rod external diameter, mm 9.5
Gap, mm 0.165
Clad thickness, mm 0.572
Height, m 3.66
U235 Enrichment 3.20%
UO2 mass , t 82.2
Control rods Number 48
Absorber material Ag-In-Cd
Pressurizer Volume, m3 40
Heaters number 50
Heaters max power, kW 1000
Primary pumps Number 3
Type Centrifugal single
stage
Nominal Head, m (H2O) 84.7
Seal mass flow rate ( inlet, per pump), l/s 0.5 Seal mass flow rate ( outlet, per pump), l/s 0.2
Pipes Cold leg, internal diameter, mm 698.5
Cold leg, nominal thickness, mm 58.9 Hot leg, internal diameter, mm 736.6 Hot leg, nominal thickness, mm 62.2 Surge line, internal diameter, mm 284
Steam Generators Number 3
Type Vertical inverted
U-tube
Heat transfer surface, m2 5110
Tubes material Inconel
Vapor pressure at full power, MPa (a) 6.6
Feedwater temperature, °C 226.7
Steam quality, % 99.75
Vapor mass flow rate, kg/s 516.6
Thermal power, MW 938
3.2
MELCOR Nodalization Description
The MELCOR nodalization was designed to have a reasonable computational time and a realistic prediction of the phenomena involved during the transient assuring a reliable and accurate transient simulation.
The three different loops are modeled separately (Figure 3.1); each loop consists of the HL, SG primary side (U tubes), the loop seal, the pump and the CL (Figure 3.2). All the U tubes are modeled with two equivalent hydraulic regions; one region represents the ascending U tubes side and the other represents the U tubes descending side. The PRZ and the related surge line are modeled as well. The vessel of the reactor is modeled with different hydraulic regions simulating the lower plenum, the core, the by-pass core, the upper plenum, the upper head and the downcomer. The upper head flow and the by-pass flow are modeled.
The model consists in 55 control volumes, 96 junctions and 90 heat structures.
Figure 3.2: Detailed Loop 1 primary circuit TH MELCOR nodalization.
The U tubes ascending side is coupled with the riser of the correspondent secondary side by a heat structure. The descending part of the U tubes is coupled with the riser of the correspondent secondary side by another heat structure.
The SRV and the PORV valves are modeled. In particular three PRZ SRV trains are modeled separately.
The pump seal leakage during the transients is simulated by a FL (one for each pump) with a flow area regulated by a tabular function.
3.2.1
HS
All “active” heat structures are modelled. For the correct evaluation of the containment pressure, the “passive” structures are also modelled. In particular, for the RN package correct working, an horizontal heat structure simulating the floor (for the RN deposition) have been implemented in the nodalization.
3.2.2
COR model
The core is modeled by a single hydraulic region, CVH package, coupled with the correspondent MELCOR code model of the COR package, Figure 3.3. The Core, in the COR package, is modeled with 17 axial regions and 6 radial regions. The lower plenum is modeled with 6 axial regions and the core with the remain 11 axial regions. All steel masses, Zircaloy masses and fuel masses are considered. In particular about 80 t of fuel are considered in the COR package.
Figure 3.3: PWR core nodalization.
3.2.3 DCH model
The elements data used for the decay heat calculation are reported in [19], in order to have specific data, related to a 900 MWe PWR reactor. The data used are the ones at equilibrium cycle.
3.2.4
Start of transient condition (steady state)
The initial conditions before the start of the transient are in general agreement with the operational condition of a generic PWR. The principal parameters which characterize the steady state condition are reported in Table 3.2; the variation versus time of all parameters are negligeble after the stabilization period (8 000 s).
Parameter UM VALUE
Core Mass flow rate kg/s 13 021 Bypass Mass flow rate kg/s 670
PRZ pressure MPa 15.41
Core inlet temperature °C 292 Core outlet temperature °C 329
PRZ level - 54%
Steam flow kg/s 1550
Steam generator feedwater temperature °C 120 Turbine inlet pressure MPa 6.6
3.3
Unmitigated Loss of Feed Water
The Loss of Feed Water (LFW) transient has received particular attention in the PWR safety analysis due to the potential for RCS over-pressurization. A LFW causes a decrease of capability of secondary system to remove the heat generated in the reactor core. Without an auxiliary feed water available, due to the SG gradual dry-out, the core residual thermal power would heat the water in the primary system to the point where the SRV from the PRZ would open, resulting in a substantial loss of water from the RCS. Considering that the transient is unmitigated, the LPI and HPI are hypothesized not available, and the only water entering into the core to compensate the loss of water coolant is that contained in the accumulators. The containment sprays are also hypothesized not available in this scenario.
At the state of art, the actual operator severe accident management actions would be stopping the main coolant pumps and the PORV valves are opened by the operator action to avoid the over-pressurization, consequently, the core degradation occurs at low pressure due to the primary circuit depressurization via PORV valves; in this transient no manual depressurization is considered and the only valves in operation are the PRZ and steam line SRVs.
Reactor configuration for the scenario implemented in MELCOR are: • HPI and LPI are unavailable;
• Containment spray system is unavailable; • At time = 0 s Main feed water loss;
• At time = 0 s Auxiliary feed water unavailable;
• At time = 0 s Chemical and volume control system loss; • When the SG level =25% SCRAM;
• At time = 1 200 s Main coolant pumps stop; • At time = 12 000 s PORV valves open;
• Isolation of accumulators when the pressure in the primary circuit is lower than 15bar.
3.3.1 Analysis of calculated data
After a MELCOR steady state analysis, in agreement with the full power operation values of the reference reactor, the LFW event takes place.
The loss of the main feed water, with the auxiliary feed water unavailable, lead to a dry-out in the SGs. When the level decreases to less than 25% in the SGs, the reactor SCRAM takes place and also the turbine is isolated. The secondary system loses gradually the capability to remove the heat and, after more than one hour (during this time the reactor is into a subcritical condition) the primary circuit reaches the maximum allowable pressure and the PRZ SRVs open.
3.3.1.1
Pressure trends
The pressure in both systems, as shown in Figure 3.4, is anchored between the on/off range of the respective SRVs for the first 11 000 s.
Figure 3.4: Pressure transient during LFW (short term).
At 12 000 s is hypothesized an operator action (the only “human action” during the transient) with the opening of PORV and the pressure in the primary circuit decreases.
So when the pressure is lower than 43 bar, the accumulators start to discharge water. In this simulation, the vessel fail is predicted at 23 100 s, after the depressurization of the primary circuit, and a sequence of core degradation is reported in Figure 3.7.
The containment pressure is practically constant until the opening of the rupture disk in the PRT (after 2 300 s). Then the vapor exits from the primary circuit into the containment then a pressure increase is caused.
The rupture of the lower head and the consequent MCCI is the cause of the increment of the pressure derivative in the period 20 000 – 30 000 s.
The high peak value of the containment pressure could be due to different reasons as an underestimation of the structure masses implemented in the MELCOR nodalization or an underestimation of the HTC in the external boundary due to the nodalization approach used. In fact the environment is modeled as a single volume thermally coupled with the containment confining structures. The external containment heat transfer coefficient resulted by the model is reported in Figure 3.6. For this, a new analysis was carried out with an imposed HTC equal to 15 W/m2K. Figure 3.5 shows the effect of this parameter on the containment pressure behavior.
At the rupture of the vessel, the fission products are starting to release, first into the containment, and after, through the small containment leakage1 , part of those are released in the atmosphere.
Figure 3.6: Containment external HTC.
1 The flow area of this leakage is practically zero for a containment pressure less than 3 barg, and after is
3.3.1.2
Core degradation phases
The starting condition is the steady state.
The phases of the severe accident core degradation are represented in Figure 3.7.
After 4 500 s the gradual dryout of the core is present, caused by the boiling into the primary system.
At 7 300 s, in the upper part of the fuel pins, start the fusion of the clad; after, the central ring is overheated and the fuel assemblies collapse on the lower grid. As cosequence, at 10 100 s the debris of the fuel rings 1, 2, 3 and 4 are on the lower grid. The lower grid collapses at 12 200 s and at 15 500 s all the debris is on the lower head. After 20 000 s, all the fuel is deposited on the lower head and the molten pool is formed in the upper part of the debris. 21 300 s after the SOT, the corium begins to leak from vessel lower head.
After 27 000 s all the fuel is ejected from the vessel to the cavity. In total, the mass ejected is 135 000 kg.
Figure 3.7: LFW Core degradation sequence. FU CL PD MP1 MP2 Void SH FM PB MB1 MB2 SS NS OS HS H2O
4. BWR FUKUSHIMA DAIICHI UNIT 1 SEVERE ACCIDENT MODEL
4.1
Boiling Water Reactors NPP Description
4.1.1
The BWR MARK 1 containment description
The containment of a BWR is a pressure suppression containment. In general it is composed by a “wet well”, a “drywell” and a “vent system”.
In particular the Mark I containment includes a building (drywell), where the Reactor Pressure Vessel (RPV) and primary system are located. They are connected to the water-filled suppression chamber (wet well) that can be cooled over long periods of time in order to maintain lower pressures and temperatures, guaranteeing its integrity. If this cooling method is lost, the wet well can be vented under controlled conditions by operator action to the atmosphere, where the suppression water pool filters out radioactive material before the release of gases by the vent.
The MARK 1 containment main characteristics are reported in [20].
4.1.2
BWR safety systems
All BWRs have control rod drive systems that can be inserted to shut the reactor down. As a backup, there is also a standby liquid control system consisting of a neutron-absorbing water solution (borated) that can be injected to shut down the fission chain reaction.
In the event that the normal heat-removal pathway to the main turbine/condenser is lost, BWRs have, as the first backup, systems to provide core safety by either adding water to the RPV or by an alternate heat removal path, or by both.
BWR/3s have isolation condenser systems that both remove the decay heat by condensing the generated steam in the RPV through heat exchange with a water pool outside the drywell and return condensate to the reactor over a wide range of reactor pressures. No additional water is added, however, so if there are leaks in the primary pressure circuit, additional water is required from other sources.
BWR/4s and BWR/5s use an Reactor Core Isolation Cooling system (RCIC), which is a turbine-driven pump using reactor steam that can add water to the RPV over a wide range of reactor pressures. The RCIC system draws water from either a large pool inside the containment, the suppression pool, or from a tank located outside the containment, the condensate storage tank (CST). The RCIC system has the advantage that it can provide significantly more water than needed to make up for decay heat–generated steam, but it does not remove the heat. When the reactor becomes isolated from the main turbine/condenser, that heat is transported to the suppression pool via SRVs that open and close to maintain the primary system pressure within safety limits. There is sufficient heat capacity in the suppression pool for many hours of decay heat storage before the heat must be removed from the containment using pumps and heat exchangers requiring electrical power. If this does not occur, the pressure and temperature in the containment will rise as time progresses.
If these first backup systems are not sufficient, then ECCSs are provided to both add water to the RPV and to remove decay heat either from the RPV or from the containment. With one exception, all these systems require alternating-current (AC) power that is supplied either by the NPP normal AC distribution system or by emergency diesel generators (EDGs) if the
normal supply is lost. The exception is that as part of the ECCSs in BWR/3s and BWR/4s, there is a high-pressure coolant injection (HPCI) system that is a turbine-driven pump that uses reactor steam and that has about seven times the capacity of the RCIC system and can add water over a wide range of reactor pressures.
4.2
MELCOR 2.1 Model Developing
The model is an upgrade based on the previuos years report [18]. In order to develop the FUKUSHIMA unit 1 MELCOR Nodalization [17], following the SANDIA approach reported in the Fukushima Dai-ichi Accident Study (SAND2012-6173) [21], the nodalization has been based on the Peach Bottom reactor (different power but similar reactor). The references used to develop the BWR Peach Bottom nodalization are [22] and [23].
Starting from this model, the Fukushima Daiichi Unit 1 input was built with the data reported in [26] and applying resonables scaling factor for each component, as pointed out in Table 4.1, if the data are not available.
DATA UM Peach Bottom Fukushima Daiichi 1
BWR type - BWR4-MARK1 BWR3-MARK1
Thermal output MW 3514 1380
N. FAs - 764 400
N. CRs - 185 97
R inner vessel m 3.2 2.4
RPV wall thickness m 0.164 0.16
RPV lower head thickness m 0.21 0.2
Heigh vessel m 22.2 20
Radius lower head m 3.188 2.391
Length FAs m 4.35 4.35
Active length m 3.66 3.66
NS mass kg 33866 17730 2
UPPER PLATE mass kg 24144 12640
SS mass kg 46000
CORE PLATE mass kg 14998 7852 2
CR housing mass kg 12041 6304 2 CRGTs mass kg 30000 CRs mass kg 9722.205 5090 3 UO2 mass kg 168480 88280 Zircaloy mass kg 61700 32330
2 Evaluated on the basis of a scaling factors based on number of fuel assemblies. 3 Evaluated on the basis of a scaling factors based on number of control rods.
Steel mass kg 121180 63500
Poison mass kg 1785 935
Table 4.1: Principal data used for the MELCOR analysis.
4.2.1
Thermal hydraulic model
The MELCOR nodalization was designed to have a reasonable computational time and a realistic prediction of the phenomena involved during the transient assuring a reliable and accurate transient simulation.
The RPV MELCOR nodalization, made by using SNAP and shown in Figure 4.1, comprises the lower plenum, the core, the core bypass, the upper core plenum, the standpipes, the steam separator, the steam dome, the upper downcomer, the middle downcomer, the lower downcomer and the steam line. The 2 external recirculation loops are modelled separately, while the jet pumps are modeled with two equivalent jet pumps.
The number of the CVH is limited and this permits to obtain a reasonable computational time and a realistic prediction of the phenomena involved during the transient assuring a reliable and accurate transient simulation.
The FL are critical for simulating severe accidents. Several studies, have found that the most likely channels of the radioactive material from the core output are three:
1) the first follows the rupture of the upper part of the Wet-well caused by an over-pressure. Therefore it was created a FL that, once it reaches a pressure of 1.2 MPa in the WW, varies its outflow area from 0 (closed junction) to 0.1 m2, permitting a positive net flow towards the Torus Room.
2) The second output channel carries material from the upper part of the Dry-well to CVH Refueling bay. The mechanism responsible for this transport of matter is brought back to the damage to the seals, due to the combined action of high temperature and high pressure. Exceeded a threshold temperature, equal to 644 K, the FL becomes activated, simulating a permanent damage to the seals. At that point, the area value of efflux depends on the internal-external pressure differential. Up to 0.565 MPa, the air outflow remains equal to zero, then increasing progressively and reaching to 0.04 m2 to 1,378 MPa.
3) A third mechanism of escape of material from the core is considered the damage of the Dry-well liner. It can take place by melting of the liner or creep due to high temperature. It occurs at the base of the DW, next to the cavity. This failure mode has not been implemented for the large uncertainties on the physical process.
Figure 4.1: Fukushima 1 TH nodalization.
4.2.1.1
Main TH data [26]
Each of the two recirculation pump elaborates a flow rate of 1 555 kg/s with an head of 103.6 m, discharging water in 20 internal jet pumps. Jet pumps particular shape drags other water from the annular region between core shroud and RPV inner surface (Downcomer), providing the necessary total coolant flow rate of 6 056 kg/s. Steam generated in the active core region passes through static phase separators, steam separators first and steam dryers then, guaranteeing a steam quality of about 100%. Steam exits from RPV to main turbine through four steam lines with a nominal mass flow rate of 689 kg/s.
4.2.2
Safety valves
The SRVs, located on a steam header attached to the main steam lines leaving the reactor vessel, vent steam from the reactor vessel into the wetwell. The SRVs have different opening and closing pressures; they open automatically when the opening pressure is reached. They also close automatically when the closing pressure in the vessel is reached. The SRVs are distributed into three bank of four, and three SRVs each, respectively. The two remaining spring safety valves have an automatic opening pressure of 7.73 MPa. Consequently, the spring safety valves will only open at high pressures after all the SRVs are already open. The spring safety valves close at a low pressure of 7.260 MPa.
The SRVs can also be opened manually at a pressure below the automatic set point. ADS actuation automatically opens five SRVs that discharge symmetrically into and around the torus below the suppression pool water level [21].
The operation of SRVs can be modeled with an Hysteric Function, here follows an extract from the CF package guide:
Figure 4.2: SRV Hysteresis [7].
Unit 1 Unit 2 Unit 3 Unit 4 Unit 5 Unit 6
No. of valves 4 8 8 11 11 18 Total capacity (t/h) 1.057 2.938 2.913 4.147 4.149 Relief: 6.532 Safety: 7.284 Relief function (MPa(g)) 7.27 (1) 7.44 (1) 7.44 (1) 7.44 (1) 7.44 (1) 7.37 (2) 7.34 (2) 7.51 (3) 7.51 (3) 7.51 (3) 7.51 (3) 7.44 (4) 7.41 (1) 7.58 (4) 7.58 (4) 7.58 (4) 7.58 (4) 7.51 (4) 7.58 (4) 7.64 (4) Safety function (MPa(g)) 7.64 (2) 7.64 (2) 7.64 (2) 7.64 (2) 7.64 (2) 7.78 (2) 7.71 (2) 7.71 (3) 7.71 (3) 7.71 (3) 7.71 (3) 8.10 (4) 7.78 (3) 7.78 (3) 7.78 (3) 7.78 (3) 8.16 (4) 8.55 (3) 8.55 (3) 8.23 (4) 8.30 (4) Discharge place Suppression pool Suppression pool Suppression pool Suppression pool Suppressio n pool Suppression pool
Table 4.2: Fukushima Daiichi SRVs set point [30]
4.2.2.1
Drywell leaks
The logic hypothesized for the simulation of the drywell leakage area is based on the following table. The DW bolt strain dependence respect the DW pressure is considered in this mode.
DW pressure [Pa] Leak area [m2] 2.00E+05 0 6.00E+05 1.50E-06 9.00E+05 6.00E-04 1.38E+06 0.02
Table 4.3: Drywell leak area.
Considering the presence of a step in the DW pressure, probably a successive rupture occurs. An upgrade of the logic is needed for this.
4.2.2.2
Pump leakage
For each recirculation pump a 1.E-4 m2 leakage area has been added starting from Tsunami arrival time.
4.2.3
Isolation condenser model
The Unit 1 of Fukushima NPP have two ICs for removing the decay heat when the main isolation valve (MSIV) is closed and the main condenser is isolated. This passive system were originally designed to prevent over pressure in the RPV without activation of the SRV.
When the pressure is higher than 7.13 MPa the IC goes in operation and continues more than 15 seconds, while the SRV activation pressure is about 7.27 MPa.
Considering the heat removal capacity of the two ICs after the reactor scram, in order to avoid thermal stress due to cold water inflow in the RPV, the line valves opening is adjusted in order to have a temperature change of the RPV less than 55 °C/hr (operator manual states) [17].
For time a short step problem, a detailed nodalization (Figure 4.1) was implemented with five volumes and five junctions for each side, instead the one volume per side initial nodalization.
With this nodalization, a time step of about 0.1 s is possible without any problem.
4.2.4
Water injection through fire engines
During the transient, for the mitigation of the accident several injection of fresh water and seawater were carried out through dedicated fire engines.
The injections mass flow rate trend versus time is reported in ref. [30] Attachment 1-5.
Figure 4.4: Water Injection through fire engines. Source: [30].
If the entire flow rate shown in the previous figure was effectively discharged by fire engines into the Unit 1 reactor, the RPV would have been filled with water and the severe accident might be avoided. Consequently it seems unlikely that the entire volume of water discharged was sent to the reactor. There is the possibility that part of the discharged water was instead sent to other systems and equipment. Therefore TEPCO in a MAAP analysis of
Fukushima Daiichi Unit 1 severe accident [30] assumed a smaller amount of water injected into the RPV than the discharged one.
Similar trend was assumed in this calculation; the values are reported in Table 4.4.
Time Mass flow rate
s kg/s 47640 0 47640 0.5 47760 0.5 47760 0 54000 0 54000 0.2 86820 0.2 86820 0 1.02E+05 0 1.02E+05 3 1.12E+05 3 1.12E+05 0 1.19E+05 0 1.19E+05 3 2.10E+05 3 2.10E+05 0 2.78E+05 0 2.78E+05 5.25
Table 4.4: Water Injection mass flow rate.
4.2.5
Containment model
The primary and the secondary containment are modeled with the following nodalization, as represented in Figure 4.5.
The primary containment of the Mark-I design is modeled with of six separate regions: - Drywell-In-pedestal;
- Drywell-Ex-pedestal; - Drywell-Top;
- Drywell-Annulus; - Vent pipes;
- Wetwell.
The secondary containment is modeled with nine separate regions: - Torus room - South 135 level - North 135 level - South 165 level - Remain 165 level - South 195 level - Remain 195 level - Refueling Bay - Turbine Building.
Figure 4.5: Fukushima 1 Containment nodalization.
The containment passive heat structures are modeled, in particular for the evaluation of the aerosol deposition.
4.2.6
HS
This package defines the thermal structures. Since no data seems available, to estimate the thicknesses of the various thermal structures, they have been used the values and technical drawings of the generic GE BWR [20] and Peach Bottom reactor[23]. Based on the radius of the vessel of the reactor in question (reported in Table 4.1), and using the scaling factor seen previously, they were extrapolated and implemented the data entered on the input. More than 60 HS were defined, obtaining a detailed modeling of the thermal structure of the domain.
4.2.7
CORE model
The core of the COR package is modeled with 23 axial levels and 6 radial rings. A core nodalization is shown in Figure 4.6. The Lower Plenum is modeled with 14 axial cells, another cell represent the core plate region and the remaining cells represent the active core region. The mass considered as reference in the MELCOR model are reported in Table 4.1.
Figure 4.6: Fukushima 1 COR 2D (axial and radial) nodalization.
Number of FAs Total Area of FAs- Outer Radius Peaking Factor Radial Ring 1 100 2,884775 0.884 0.35 Radial Ring 2 100 6,046625 1.25 0.3 Radial Ring 3 100 9,395525 1.531 0.225 Radial Ring 4 100 12,74443 1.768 0.125 Radial Ring 5 0 0 1.972 0 Radial Ring 6 0 0 2.4 0
Axial level height (m) 23 0.51 22 0.4575 21 0.4575 20 0.4575 19 0.4575 18 0.4575 17 0.4575 16 0.4575 15 0.4575 14 0.2777 13 0.49015 12 0.49015 11 0.49015 10 0.49015 9 0.49015 8 0.49015 7 0.49015 6 0.49015 5 0.25908 4 0.25908 3 0.25908 2 0.25908 1 0.25908
Lower head bottom 0
Table 4.6: Axial level distribution.
Figure 4.7: Axial relative power factor.
It has been chosen, with respect to the radial subdivision, to dedicate an inner ring to the "Bypass", the outer part of the core, where the fuel rods are not present, but only refrigerant. In this portion of the core, being present exclusively water, it has a strong discontinuity with respect to the most inner rings, where there are the fuel, the coating material of the fingers and other structural materials.
For the first 5 rings (in order to simplify the insertion of the values of the volume fractions of the materials present) we are used a radial division such as to have 5 rings of the same area. Assuming an equal distribution of material in the active part, this choice has allowed the insertion of the volume fractions the same values in most of the cells of the first five rings.
The outer radius of the Fukushima reactor (known) has also been used to estimate the thickness of the cylindrical wall and the hemispherical shell of the vessel (data not reported in the references).
Starting from the thickness of the reference reactor, and using the correlation of Mariotte has been estimated, for example, a thickness value of the hemispherical shell of the vessel of 0.165 m instead of 0.22 m.
This parameter has a great importance both in terms of heat exchange (as the thickness increases, clearly increases the thermal resistance), both for the influence that would have on a possible resistance to breaking in incidental simulations.
0 0.02 0.04 0.06 0.08 0.1 0.12 0.14 0.16 0.18 0.2 4 5 6 7 8 9 Pow e r fac to r [-] z [m]
Figure 4.8: BWR-3 Lower Plenum [16].
The SS failure model selected is the “Stress Based”, inserting SS number and inner/outer diameter.
Particular attention was dedicated to the modeling of Lower Head of the core. The detailed nodalization of the lower part of the core, allowed to optimally simulate the spherical head profile behavior.
For the debris falling velocity a sensitivity analysis has been carried out:
TEST1: 1 m/s TEST2: 0.1 m/s TEST3: 0.01 m/s
TEST2 was the chosen one (0.1 m/s falling debris velocity), since, analyzing outputs, it represented the most conservative situation, carrying to a bigger amount of RPV ejected material than other inputs.
The sensitivity coefficients modified respect the default value in the CORE model are: - debris thermal conductivity: 2000 W/m2K [24]
4.2.8
RN package
One of the main things to be set was the initial inventory of COR Cells and / or Cavity. Obviously not being present initially Cavity was only set the inventory on the cells in the Core. The concept is to use the totality of the mass of radionuclides (Decay Heat present in the package, set default) and apply to it of normalized peak factors (radial and axial, in order to obtain an axial and radial distribution of such elements) dependent on Burn up of fuel and as a result of the formation of fission products. The normalized peak factors are obtained from [27].
The RN package is activated and the most important parameters inserted are: - Pool scrubbing data for the wetwell and the cavities;
- Surfaces deposition and the intervolume transfer for the aerosol coefficients calculation.
4.2.9
DCH
The Decay Heat Package (DCH) data inserted are based on TEPCO ORIGEN-2 calculation for Fukushima Daiichi unit 1, 2 and 3 [27].
The mass of single product was scaled down starting from Peach Bottom input, as showed in Table 4.7. Starting inventory of RN MELCOR Class Peach Bottom reference data Scaling factor Fukushima Daiichi unit 1 - kg - Kg Xe 1 429.36 0.52356 224.7958115 Kr 1 34.34 0.52356 17.97905759 Cs 2 236.15 0.52356 123.6387435 Rb 2 32.2 0.52356 16.85863874 Ba 3 121.65 0.52356 63.69109948 Sr 3 85.87 0.52356 44.95811518 I 4 20.93 0.52356 10.95811518 Te 5 40.78 0.52356 21.35078534 Ru 6 182.48 0.52356 95.53926702 Rh 6 35.06 0.52356 18.35602094 Pd 6 89.45 0.52356 46.83246073 Mo 7 279.09 0.52356 146.1204188 Tc 7 71.15 0.52356 37.2513089
Ce 8 243.3 0.52356 127.382199 Zr 8 311 0.52356 162.8272251 Np 8 39.35 0.52356 20.60209424 La 9 107.34 0.52356 56.19895288 Pr 9 93.02 0.52356 48.70157068 Nd 9 314.86 0.52356 164.8481675 Pm 9 12.88 0.52356 6.743455497 Y 9 42.93 0.52356 22.47643979 Uranium 10 132390 0.52356 69314.13613 Sb 11 1.41 0.52356 0.738219895 Sn 12 3.94 0.52356 2.062827225 Ag 12 4.65 0.52356 2.434554974 Boron 13 0 0 water 14 0 0 concrete 15 0 0 CsI 16 0 0
Table 4.7: Evaluated initial core inventory.
The value of the decay heat has been manually inserted by a tabular function with the values reported in the following table Table 4.8, based on [27].
Time after SCRAM (hour) Decay heat (MW) 2.78E-04 3.19 2.78E-03 2.60 1.67E-02 1.93 1.67E-01 1.23 1 0.78 2 0.62 3 0.57 4 0.53
5 0.48 6 0.47 7 0.43 8 0.44 9 0.42 10 0.40 12 0.39 14 0.37 16 0.35 18 0.36 20 0.34 24 0.31 30 0.31 36 0.27 42 0.28 48 0.26 60 0.22 72 0.23 84 0.21 96 0.19 120 0.19 144 0.17 168 0.16 192 0.15 216 0.14 240 0.13 264 0.15 288 0.14 312 0.13 336 0.13
The flag for the scaling of the decay heat inserted for each RN was activated.
In this case, all RN decay heats are multiplied by a common factor calculated by MELCOR so that the total decay heat inserted by the table was mantained.
4.2.10 Cavity
Referring to Figure 4.10, the In pedestal CVH represents the volume below the lower head, where molten core is ejected after RPV failure. In the nodalization, the Sump volume is considered into the “In pedestal” CVH. The Sump volume is the region where core debris accumulate. The MELCOR Cavity (CAV) package models the interactions on the basement concrete by hot (often molten) core materials. The package includes the effects of heat transfer, concrete ablation, sump shape change, and gas generation. The CAV package is coupled to the CVH one for thermal hydraulic boundary conditions, to COR package for the ejection of core debris from the RPV and to RN package for the fission product release models. Debris in the cavities are classified according to their composition and density; consequently they conglomerate in different layers, some of which are mixture of other two classes:
-LOX: Pure oxide, lower density than metallic phase;
-LMX: Mixed phases, lower density than the metallic phase; -MET: Pure metal;
-HMX: Mixed phases, more dense than MET; -HOX: Pure oxide.
Each layer is considered as a single volume which is characterized by an average temperature. The heating of the cavity is directly calculated by the RN and the DCH (decay heat) package considering also the heat flux from one layer to another. Gases, generated by the interaction of corium and concrete or released by debris, are treated, with their enthalpies, as sources in the relative control volume.
The MELCOR model is based on public cavities information about Unit 1.
Two different cavities are nodalized. The first represents the in pedestal Drywell representing the first in contact with the corium when it exits from the vessel. The second represents the ex pedestal Drywell, which could receive the corium from the first cavity.
CAV 1 (Sump cavity) is related to In pedestal CV. Cavity depth is 1.2 m while the inner radius is set equal to 0.18 m in order to have the same square surface area of 2.10 m2. The concrete external radius, relative to Sump 1 cavity, is assumed equal to the drywell cylindrical part external one (10 m) for a 4.28 m of concrete bottom thickness (pedestal floor thickness minus sumps length). These values are used by the code to define boundaries for concrete ablation.
The Main cavity is related to the pedestal CV. Its depth is equal to 0.6 m while the inner radius is set 3.24 m (which is the inner radius of pedestal wall, Figure 4.9). The concrete external radius is assumed equal to the pedestal wall external one 4.44 m, for a bottom thickness of 5.48 m, as the pedestal floor one.
During the simulation the code gives fatal error when the cavity is filled. The reason seems that the code allows water to enter the cavity even if it is full of corium. Consequently two flow paths between sump and pedestal CVs are introduced, “drain” and “overflow” FLs. When the cavity is filled, the “drain” FL closes and “overflow” FL opens. The second one is an “only forward flow” FL, in this way water can no longer enter the sump cavity but debris can overflow from sump CV to pedestal CV.
4.2.11 Burn
This package doesn’t need a lot of input values. The only thing to set is the CVH in which the Burn (deflagration or detonation) can occur. The code sees (as reality) all CVHs as possible burned, but in Fukushima Daiichi Unit 1 the Explosion took place in the Reactor Hall. Consequently it is important to set the explosion happening at that time in that CVH. Through the parameters is possible to set ignition criteria for CVH with and without igniter. CVHs with igniter have more easy ignition criteria to reach (CVH’s limit mole fraction for H and CO lower than without igniter) (remember that the ignition reactions are H+O2 and CO+O2), consequently the is to set an igniter inside the Reactor Hall CVH.
The ignition in the Reactor Hall has been setted at 89400 s, based on the real time of the explosion. All parameters for burn package are setted as default value.
4.3
Reference Accident Description
On March 11, 2011 at 14:46 (T0), an earthquake caused the loss of off-site power and the automatic reactor scram at Fukushima Daiichi Unit 1. After that, several events and actions have happened causing the well-known accidental sequence.
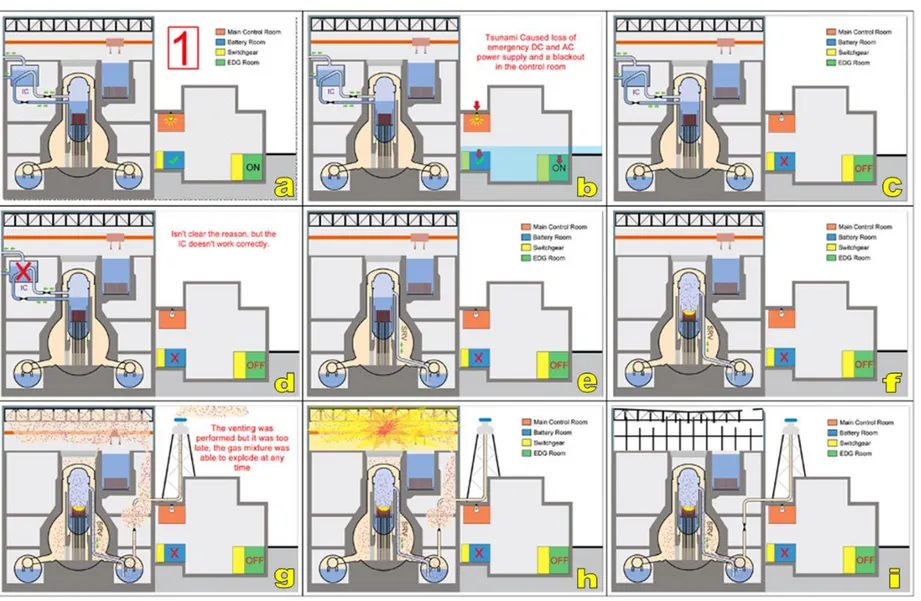
The accidental sequence can be schematically resumed following the 9 pictures of the Figure 4.10.
As per picture a of Figure 4.10, after the earthquake, the off-site power was lost and all the control rods were inserted into the core. As expected, because of the loss of off-site AC power, loss of feedwater and condensate and main steam isolation valve closures occurred. Moreover, as expected, the emergency diesel generators started to cover the loss of off-site
AC power; battery room and main control room were ok. Moreover, the IC automatically starts to operate at T0+6min causing a decrease in the reactor vessel pressure due to the heat removal through the ICs. The contemporary operation of the two ICs caused a higher cooldown rate that, for procedure limitations, cannot exceeded the 55°C/h. Because of this, operators cycled the ICs to maintain the correct pressure within the reactor vessel with an acceptable cooldown rate.
As per picture b of Figure 4.10, at T0+41min, the first tsunami reached the NPP. The subsequent tsunami caused flooding and damages at the intake structures. After that, the tsunami started to flood and submerge the emergency diesel generators and AC and DC distribution systems, causing the loss of AC and DC power. This also caused the loss of lights, indicators and controls in the main control room.
In the post tsunami condition (as per picture c of Figure 4.10), all AC and DC power systems were unavailable and the IC was the only system able to remove the decay heat from the reactor, without DC power the system had to be operated locally. Moreover, after 8 hours of functioning, the IC required a source of makeup water for the condenser. As a result, Unit 1 had no injection or core cooling in service.
Operators tried to place the isolation condenser in service without success. As a result, there was no cooling method aligned to remove decay heat from the reactor (as per picture d of Figure 4.10).
Without any decay heat removal system in operation, the reactor pressure increased causing the primary steam vent, through the SRV, to the suppression pool (as per picture e of Figure 4.10). This caused a water level reduction and hence the uncovering of the core. Core degradation occurred causing release of reaction products (e.g. H2 from Zr oxidation) in the suppression pool (as per picture f of Figure 4.10). These reaction products reached also the drywell region. Because of the higher pressure in the reactor system the suppression pool was vented out (as per picture g of Figure 4.10). The venting was started too late and the atmosphere within the containment reached a too high hydrogen gas concentration. This caused at 15:36 on March 12, the explosion of the reactor building allowing radioactive materials to be released into the environment (as per picture h of Figure 4.10). Less than an hour after the explosion, radiation dose along the site boundary had reached 1.015 μSv/hr. Later, on March 12, the operators started to inject seawater into the reactor through the core spray system in order to cool the reactor; boron was then added to the water to control the reactor criticality.
This situation continued over the next several days as site personnel attempted to restore electrical power to the unit (as per picture i of Figure 4.10). Off-site power was restored to Unit 1 on March 20, nine days after the event.
4.4
Model Results and Comparison With Experimental Data
The analysis carried out is comparised with the mesured data provided by TEPCO and in particular the water level into the RPV [31] and the pressures mesured (into the RPV and into the DW) [32]. Other parameters have been evaluated, but the mesured data are not available and then a comparison is not possible.
4.4.1
Water level into the RPV
The water level is referred to a reference quote selected for the MELCOR input (0 m is the Z of the inferior level of the RPV lower head).
Figure 4.11 show the comparison between water level in the RPV and some of somedata available from TEPCO.
The only values considered are the additional data reported in [31].
Figure 4.11: Calculated vs. measured RPV level.
4.4.2 RPV and DW Pressure
The pressure values obtained (Figure 4.12) are compared with the TEPCO data [32]. The RPV pressure trend is in general agreement with the mesured data, the only macroscopic difference is a delay in the pressure drop at about 40 000 s, then the delay in the rise of the D/W pressure, caused by a delayed vapor release from the RPV.
-6 -4 -2 0 2 4 6 8 0 5000 10000 15000 20000 25000 30000 35000 40000 45000 50000 Lev el fro m TAF [ m ] Time [s]
Figure 4.12: Calculated vs. measured pressures.
4.4.3
Core degradation
The core degradation phases, now, are not comparable vs. experimantal data. The phases of the severe accident core degradation calculated are represented in Figure 4.13.
The starting condition is the steady state; after about 16 500 s a total core dryout is present, mainly caused by the ejection of the primary water from the SRVs and not replaced by the safety injection systems.
At 18 000 s, in the upper part of the fuel pins, start the fusion of the clad; after, the lateral rings are overheated and the fuel assemblies gradually melt and is blocked on the lower grid. At 28 900 s the debris of the fuel ring 1 drains below the lower grid and, through the control rod guide tubes goes in the lower head. After few minutes, the radial rings 2 and 3 follows the same trend. The CR guide tubes of the ring 2 collapses at 29 300 s and then all the other rings collapse. After 63 000 s, practically all the fuel is deposited on the lower head and the molten pool begins at 69 000 s.
70 000 s after the SOT, the corium begins to leak from vessel lower head. After 76 000 s all the fuel is ejected from the vessel to the cavity.
In total, the mass ejected is 175 000 kg.
0 1 2 3 4 5 6 7 8 0 50000 100000 150000 200000 250000 A system/ reactor pressure (MPa) B system/ reactor pressure (MPa) D/W pressure (MPa abs) S/C pressure (MPa abs) MELCOR RPV MELCOR D/W
Figure 4.13: Fukushima Daiichi 1 Core degradation sequence calculated by MELCOR. FU CL PD MP1 MP2 Void SH FM PB MB1 MB2 SS NS OS HS H2O
5. LARGE BREAK LOCA ANALYSES
5.1
MELCOR Nodalization of the Plant
An independent MELCOR nodalization has been developed by ENEA [33, 34] entirely by using SNAP [11]. Figure 5-1 shows the visualization of the thermal-hydraulic MELCOR nodalization by using SNAP. The nodalization topology of some rector region have been analysed in order to reconsider the cell spatial discretization. For example, the three steam header (one for each loop) have been modelled separately, the inlet and outlet channels of the SGs have been modelled separately from the U tubes. The break modeling in CL and HL are shown in Figure 5.2 and Figure 5.3 respectively. It is in progress an evaluation of the necessity to renodalize some reactor region in order to have a more detailed code prediction of the phenomena taking place during the transient.
The containment heat structures [35] have been also developed taking account the different materials characterizing a generic PWR containment (Steel and Concrete and their distribution). A particular attention has been addressed to the modelling of the metallic structure inside the core and lower plenum regions [36] and their distribution in the COR package cells. The failure of the plates modelled inside the RPV is governed by an internal MELCOR model regarding thermal-mechanical stress failure. The SNAP visualization of the structures modelled inside the RPV is shown in Figure 5.4.
The pressure drops profile in steady state conditions [37] along the PCS have been also modelled, taking account the information’s available in literature. Particular attention has been considered for the k loss coefficient that should be implemeneted in the MELCOR nodaization to realistically simulate the pressure loss profile along the loop and the RPV.
A particular attention has been addressed to the definition of the boundary conditions. For example, the Main Feedwater Pump (MFW) have been modelled with specifics mass and enthalpy sources feeding the control volumes connected to the risers of the SGs.
A significant effort has been put into develop a complete generic characterization of the plant operational logics. All of the generic logics regulating the operation of the main components of the plant have been implemented in MELCOR nodalization.
Several core degradation parameters has been implemented, as indicated by the NUREG/CR-7008 [38], and are shown in Table 5-1.
5.2
MELCOR Steady State Calculation
The MELCOR steady state calculation of the generic PWR of 900 MWe has been analyzed via SNAP graphic interface. Table 5-2 shows the comparison between MELCOR output data and the reference data at the end of the steady state phase at full operational power.
In the following is shown the SNAP visualization of the main parameters, selected by the user, used in order to verify the steady state operation condition. In particular, Figure 5-5 shows selected parameters regarding the PCS and the containment while Figure 5-6 shows selected parameters regarding the SCS. Figure 5-7 shows the thermal power produced by the reactor and core temperatures.
Figure 5.2: CL Double-Ended rupture MELCOR nodalization.
Figure 5.4: SNAP visualization of the structures inside the core and lower plenum regions.
Lower core plate - SS PLATEG
Core supporting plate - SS PLATE Inactive base of fuel
assemblies- SS COLUMN
Support columns - SS COLUMN
Support columns and secondary support - SS COLUMN
Upper inactive portion of fuel assemblies - NS
PARAMETER FIELD VALUE Flow flashing model switch for the break flow paths KFLSH 1 Heat transfer coefficient from debris to penetration
structures
HDBPN 100 W/m2*K
Heat transfer coefficient from debris to lower head HDBLH 100 W/m2*K Character string MODEL, signifying that the heat transfer
coefficient from the oxidic molten pool to the lower head is to be calculated from the internal model
MDHMPO ‘MODEL’
Character string MODEL, signifying that the heat transfer coefficient from the metallic molten pool to the lower head is to be calculated from the internal model
MDHMPM ‘MODEL’
Failure temperature of the penetrations of the lower head TPFAIL 9999 K Discharge coefficient for ejection of debris through failed
penetration opening
CDISPN 1.0 Heat transfer coefficient from in-vessel falling debris to
pool
HDBH2O 2000 W/m2*K
Velocity of falling debris VFALL 0.01 m/s
Debris hydraulic diameter DHYPD Core - 0.01 m
LP - 0.002 m Temperature to which oxidized fuel rods can stand in the
absence of unoxidized Zr in the cladding
TRDFAI 2800 K Maximum melt flow rate per unit width after breakthrough GAMBRK 0.20 kg/m*s
ZrO2 and UO2 melting temperature MLT 2800 K
2800 K
Refreezing heat transfer coefficient for UO2 HFRZUO 7500 W/m2*K Refreezing heat transfer coefficient for Zircaloy HFRZZR 7500 W/m2*K Refreezing heat transfer coefficient for Steel HFRZSS 2500 W/m2*K Refreezing heat transfer coefficient for ZrO2 HFRZZX 7500 W/m2*K Refreezing heat transfer coefficient for Steel Oxide HFRZSX 2500 W/m2*K Refreezing heat transfer coefficient for Poison Poison 2500 W/m2*K Radiative exchange factor for radiation radially outward
from the cell boundary to the next adjacent cell
FCELR 0.1
Radiative exchange factor for radiation axially upward from the cell boundary to the next adjacent cell
FCELA 0.1
Table 5.1: Core degradation parameters implemented in the PWR MELCOR nodalization [11, 38,39,40].
Parameter MELCOR 2.1 Reference Data [33]
Relative Error
Reactor thermal power 2775 MWth 2775 MWth 0 %
PCS pressure 15.51 MPa 15.51 MPa 0 %
Total mass flow rate 13968.9 kg/s 13734 kg/s ̴ 1.7 %
Core inlet temperature 564.49 K 564.85 K ̴ 0.06 %
Core outlet temperature 598.53 K 601.75 K ̴ 0.53 %
Table 5.2: Main steady state parameters obtained with MELCOR 2.1.
Figure 5.6: SNAP visualization of selected SCS parameters.
Figure 5.7: SNAP visualization of the reactor thermal power and of the core temperatures.
6. ANALYSIS OF TWO UNMITIGATED LBLOCA TRANSIENTS
A Loss Of Coolant Accident (LOCA) in a nuclear power plant consists in a loss of coolant from the PCS due to a rupture in the hydraulic circuit. The phenomenology and the timings characterizing this kind of transient depend strongly on the size of the rupture and on its position in the PCS. Specifically, the transients selected for the analysis are initiated respectively by:
- Double-ended rupture of CL 1 in LOOP 1; - Double-ended rupture of HL 1 in LOOP 1.
The study of the accidents caused by these particular events are very important, since they cause a drastic or even total degradation of core cooling capabilities, especially when the Emergency Core Cooling Systems (ECCS) are not available. This last condition is set as hypothesis for the analysis, causing the transients to be “unmitigated” and thus evolving as a BDBA. The unmitigation of the accidents eventually causes the degradation of the core and the transients to become severe accidents.
The double-ended ruptures have been modeled subdividing respectively the CL 1 and the HL 1 into two equal parts and connecting both of them to the containment with specific flow paths.
In the calculations performed in order to study the transients, the rupture is set to occur at t = 0 and the plant is set to operate in full power operational condition during the steady state phase before that instant.
The boundary conditions regarding the initiator event and the plant conditions implemented in MELCOR nodalization are the same for both of the accidents analyzed. In particular, these conditions are:
- The reactor operates in steady state before the rupture occurence; - Break occurence at t = 0;
- ECCS unavailable except for accumulators injections (passive system);
6.1
Analysis of the Severe Accident Caused by the Unmitigated
Double-Ended Rupture of CL 1
The main time events for the scenario, caused by the unmitigated double-ended rupture of CL 1, are presented in Table 6-1.
The break opening causes a significant blowdown to the containment of coolant through the rupture and the drastic depressurizzation of the PCS, thus starting the so called “blowdown” phase. The sudden change of plant operative conditions causes the reactor SCRAM, which in turn induces the turbine trip and the stop of the MCPs.
Figure 6.1 shows the coolant mass flow rate through the break as a function of time. The mass flow rate that characterizes the first instants of this scenario is extremely high since the rupture is modeled right after the MCP 1.
Figure 6.2 shows the PCS and the containment pressure as a function of time. The evolution of the pressure in the PCS shows that MELCOR predicts, as expected, a first subcooled depressurization phase characterized by a high depressurization rate. Subsequently, the coolant reaches the local saturation conditions, starting the two-phases depressurization, which is characterized by a lower depressurization rate. The equalization between the PCS and the containment pressure is predicted by the MELCOR code at ̴ 20 s after the Start Of the Transient (SOT).
Event Time
Steady state reactor operation < 0 s
Break opening 0 s
Reactor SCRAM ̴ 100 ms
Turbine isolation ̴ 1 s
Stop of primary pumps ̴ 2 s
Start of accumulators discharge ̴ 2 s
First total core uncovery ̴ 8 s
First gap activity release ̴ 10 s
Isolation of accumulators ̴ 34 s
Oxidation onset ̴ 875 s
First fuel rod failure ̴ 2003 s
First material slump in lower plenum ̴ 5339 s
Lower head failure ̴ 6223 s
Table 6.1: Chronology of the main events subsequent to the CL 1 rupture.
Figure 6.2: PCS and containment pressure (CL 1 break).
Figure 6.3 shows the evolution of the collapsed coolant level inside the RPV as a function of time. At the beginning of the transient the blowdown phase induces a drastic drop of the coolant level causing the total uncovery of the core active region. Subsequently the collapsed coolant level is partially restored (reflooding) through the coolant injected by the accumulators, which start operating when the pressure setpoint for their injection valves is reached. During the accumulator injection period the pressure in the injection point is still very high, thus a significant amount of the injected emergency coolant is lost through the break becoming unavailable for the core cooling purpose. Successively MELCOR predicts the complete uncovery of the active core region due to the unmitigation of the transient, starting the core heat-up process. This second collapsed coolant level decrease is slower due to the lower pressure characterizing the PCS. This situation starts the core heat-up process since core cooling degradation capabilities. This process, which will be discussed with more details later on, induces the oxidation of the metallic materials inside the core region, especially of the Zircaloy cladding enveloping the fuel rod, with the steam produced inside the RPV. The fuel will eventually fail and collapse, relocating itself onto the lower core plate. Successively MELCOR predicts the failure of the lower core plate due to yielding stress about 4426 s after the SOT. The corium thus relocates onto the core supporting plate which eventually fails as well, causing the slumping of the corium in the lower plenum ̴ 5339 s after the SOT. The failure of this plates causes the decrease of the collapsed coolant level inside the lower plenum region, as shown in Figure 6.3. Finally the interaction between the relocated corium and the residual water inside the lower plenum lead to the complete debris dry out.


![Table 4.2: Fukushima Daiichi SRVs set point [30]](https://thumb-eu.123doks.com/thumbv2/123dokorg/5607080.67986/21.892.116.790.486.961/table-fukushima-daiichi-srvs-set-point.webp)
![Figure 4.4: Water Injection through fire engines. Source: [30].](https://thumb-eu.123doks.com/thumbv2/123dokorg/5607080.67986/23.892.132.792.509.979/figure-water-injection-engines-source.webp)