A criterion for optimal management of
water distribution networks
P. Bertola
1, G. Silvagni
2, M. Nicolini
3& F. Volpi
2 1Department of Civil and Environmental Engineering, University of Trento, Italy2Department of Civil Engineering and Computer Science Engineering, University of Rome Tor Vergata, Italy
3Department of Chemistry, Physics and Environmental, University of Udine, Italy
Abstract
The management of water supply systems is based on fundamental principles, set by international and national legislations; the general target for water utilities is to offer a reliable and effective service following efficiency criteria. In this context, losses in distribution networks are one of the main problems to tackle: their reduction implies a general decrease in operational costs and in the need for a limited resource such as water. Numerous solutions have been proposed to reduce non revenue water, from simple leak detection to structural interventions on distribution systems, based on new design criteria which favour district-based networks over redundant ones. The present work proposes a new procedure to restructure a water supply network starting from its hydraulic model, comparing different types of intervention and evaluating their feasibility, limits and effectiveness in terms of the global system efficiency, as measured by the infrastructure leakage index (ILI). The possibility to use excessive pressure in specific parts of a network for the production of electricity is also examined, as it offers an additional resource to improve the system performance. The procedure has been tested for the water network in the municipalities of Tarcento and Magnano in Riviera, near Udine in Italy. Thanks to a specific hydraulic model, simulations were performed to identify the optimal interventions on the system aimed at reducing water losses and improving performances and efficiency. Keywords: distribution networks, efficiency, leakage analysis, optimisation, pressure management.
1 Introduction
The Italian law no. 36 of 5th January 1994 established that the primary objective
for the management of an efficient, optimal water distribution network is to identify technical interventions necessary to minimise costs while maximising the product-service.
The principles that the law raises as the fundamental aspects of any sound, enlightened public utility management (efficiency, effectiveness and economy) lead the operator to adopt policies that are increasingly rigorous with respect to product usage; this in turn forces the substantial reduction of water losses and improves profitability recovery in the management of distribution networks. In most cases, the attainment of these objectives implies an improvement in current service levels [1].
On the one hand it is necessary to ensure that users receive better services in quantitative and qualitative terms (for drinking water supply and wastewater collection and treatment), on the other hand network operations need to be carried out according to management practices that both value undertaken investments and optimise the available resources.
Attention should be focused on resource losses that result in economic damage. Structural deficiencies in a network due to either insufficient system rehabilitation (required, for example, as a consequence of new operational conditions that the system must guarantee), greater water demand or lack of maintenance on the system’s mechanical/electronic components not only create inefficiency but can also mean a loss of income for the same water utilities (water volumes effectively required but not delivered or billed) [2, 3].
A survey conducted in 2008 by the Italian Institute for Statistics (ISTAT) estimated that the average national volume of non revenue water (NRW) is 44 m3/capita. In particular, the survey highlighted that the Italian water utilities
abstract from the sources an additional volume which corresponds to 65% of the effectively distributed water [4].
Drinking water is a fundamental asset for the well-being and vitality of present and future generations; therefore, it is necessary that a process be put into place to minimise leakage.
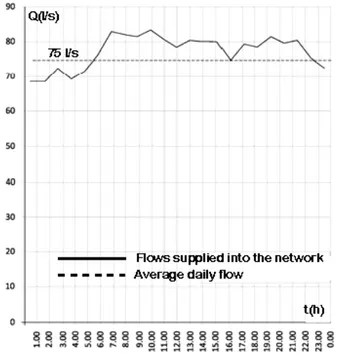
The analysis of daily consumption patterns conducted for the municipalities of Tarcento and Magnano in Riviera (province of Udine, Italy) clearly shows (figure 1) that the water flow distributed at night is not significantly different from the average daily flow.
Similar results have been observed in five municipalities in the Campania region and five municipalities in the Basilicata region [5, 6].
As local night-time activities are limited, and there are no fountains or monuments to justify the high flow rates during night hours, it is evident how significantly high water leakage levels affect the analysed distribution networks. Hence a specific study has been developed with CAFC S.p.A. (Consorzio per l’Acquedotto del Friuli Centrale S.p.A.) Water Utility to optimise the networks of Tarcento and Magnano in Riviera.
Figure 1: Municipalities of Tarcento and Magnano in Riviera – measurements of flow supplied to the network.
2 The Tarcento and Magnano network
The distribution network of Tarcento and Magnano in Riviera (figure 2) is located in the foothills downstream of the River Torre’s mountain basin, approximately 20 km north of Udine. The network extends over an area of 127 square kilometres and has an average elevation of approximately 230 m a.s.l. (with a minimum of 187.7 m at the “Collalto” pumping station and a maximum of 436.5 m at the “Sedilis” water tank); it serves approximately 12,140 inhabitants, as well as an industrial zone (Collalto) and a commercial area (Pontebbana state road), for a total of 5,347 connected properties. The hydraulics of the network can be easily defined.
The industrial zone and the artisanal area are fed by two points along the supply network: the Collerumiz tank to the west and the Collalto-Casacco node
to the south. In 2004, overall water consumption was 932.293 m3, corresponding
to 210 l/capita/day.
The distribution network’s functioning is quite complex; the permanent supply points are the Lucchin tank and the Coia reservoir.
The Coia reservoir supplies water for the western portion of the system (via the “Vergon” and “Bocon di Magnano in Riviera” storage tanks) and for its southern portion (the upper Tarcento area, by means of the Noglareda and Frangipane tanks), while the remainder of the network is served by the Lucchin
Figure 2: Schematic plan of the aqueduct system of Tarcento and Magnano in Riviera.
node, via the Segnacco tank; the pipe between the two tanks of Lucchin and Segnacco also supplies water to users.
As the Lucchin tank capacity would not be sufficient to meet the daily peak demand, the Segnacco water tank also receives pumped water from Collalto (Cassacco tank).
The network is made of pipes with diameters between 25.4 mm and 300 mm; the pipe materials are mainly steel (approximately 65%) and cast iron (approximately 25%). A smaller portion of the network is made up of plastic pipes and cement materials, typically from subsequent maintenance interventions (10%).
A hydraulic model for the distribution network was implemented in Epanent 2.0, with information gathered from site visits and from CAFC S.p.A. Water Utility.
Model calibration was performed after obtaining inflow time data for the days 9–10 July 2008 from the Lucchin tank, the Coia tank and the pumping station in Cassacco, recorded by the telemetry system of CAFC S.p.A. at the Molino del Bosso station (Table 1).
Pressure data was also used, measured on-site in the same days at six points along the network, considered strategic by the Water Utility technicians (figure 3).
Based on inflow measurements at the various storage tanks and on the variation of their water levels, the outflow from the Lucchin tank into the network is estimated in figure 1.
Table 1: Flow and water level measurements at the Lucchin tank, Coia
splitter and Cassacco pumping station (year 2008) – data collected by the Molino Del Bosso telemetry station.
Hour
LUCCHIN COIA CASSACCO
July 9 July 10 July 9 July 10 July 9 July 10
Q (l/s) (m) H (l/s) Q (m)H (l/s) Q (m) H (l/s) Q (m) H (l/s) Q (m)H (l/s) Q (m) H 23 – 1.62 – 1.38 – 1.32 – 1.32 – 4.42 – 4.5 1 58.26 1.68 59.55 1.46 15.40 1.32 15.35 1.32 37.50 4.56 0.28 4.3 2 59.90 1.78 59.35 1.56 14.55 1.32 14.98 1.32 0.28 4.33 0.28 4.1 3 60.89 1.89 59.20 1.65 14.46 1.32 14.45 1.32 0.28 4.13 33.61 4.5 4 59.26 1.96 60.95 1.76 14.52 1.32 14.40 1.32 30.28 4.60 0.28 4.3 5 60.45 2.05 60.61 1.86 14.20 1.32 14.37 1.32 0.28 4.41 0.28 4.1 6 59.93 2.12 59.91 1.93 14.72 1.32 13.32 1.32 0.28 4.18 26.11 4.3 7 56.99 2.13 56.88 1.95 16.95 1.32 16.84 1.32 39.17 4.58 23.33 4.5 8 53.17 2.04 53.67 1.87 19.88 1.31 20.21 1.31 5.83 4.99 10.83 4.0 9 53.55 1.95 53.48 1.79 20.41 1.31 20.80 1.31 60.83 4.80 58.89 4.7 10 55.65 1.88 52.63 1.71 20.89 1.31 20.79 1.31 0.28 4.12 0.28 4.1 11 53.78 1.82 53.50 1.65 20.15 1.31 21.14 1.31 58.06 4.67 57.22 4.7 12 53.62 1.76 52.49 1.58 19.56 1.31 20.54 1.31 1.67 4.30 8.06 4.2 13 54.22 1.72 53.52 1.53 20.25 1.31 20.82 1.32 33.33 4.37 41.67 4.5 14 54.96 1.67 53.75 1.49 19.68 1.31 20.27 1.32 30.56 4.51 11.94 4.1 15 54.26 1.63 56.54 1.50 19.82 1.31 19.29 1.32 10.28 4.03 29.17 4.3 16 53.11 1.58 55.10 1.49 19.24 1.31 18.67 1.32 65.00 4.80 33.06 4.4 17 56.01 1.58 56.45 1.50 18.82 1.31 18.22 1.32 2.22 4.41 23.33 4.4 18 54.78 1.55 54.53 1.47 18.52 1.31 19.22 1.32 18.89 4.18 16.11 4.1 19 53.77 1.51 55.42 1.44 20.18 1.31 19.71 1.32 43.06 4.60 48.89 4.6 20 52.91 1.44 53.40 1.38 20.07 1.32 20.05 1.31 7.50 4.00 11.39 4.0 21 54.05 1.38 53.56 1.31 20.35 1.32 20.63 1.31 46.11 4.43 65.00 4.8 22 53.23 1.33 55.02 1.27 20.00 1.32 20.16 1.31 30.00 4.37 0.28 4.1 23 54.91 1.33 54.75 1.26 19.19 1.32 19.96 1.31 12.78 4.29 59.44 4.7 24 57.00 1.38 55.19 1.28 17.20 1.32 19.78 1.31 34.17 4.59 0.28 4.4
In particular, approximately 6,278 m /d are supplied to the network by gravity, 3
corresponding to an average of 517 l/capita/d; 1814 m3/d derive from the
pumping station for an average of 150 l/capita/d. Assuming an average flow rate of 70 l/s for each pump, the pumping station is considered to run for approximately 8 hours a day.
Online pressure measurements showed modest head losses along the network; pipes located at lower altitudes are therefore subject to pressures which are far higher than the optimal service values (with pressure heads above 80–90 m).
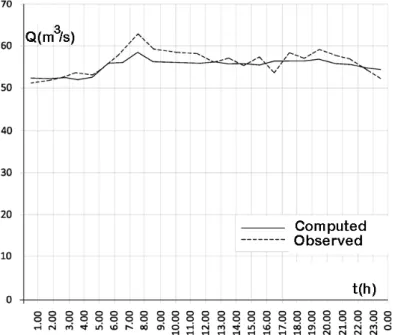
The following graphs (figures 4, 5 and 6) compare observed and simulated pressure/flow values at the main nodes of the network, showing an excellence correspondence.
(a) (b)
Figure 3: Pressure measurements July 9, 2008: Cignini (a) and Collalto (b).
Figure 5: Results of the simulations – pressure comparison July 9, 2008.
Figure 6: Results of the simulations – comparison of the outflow Lucchin
The simulation results shown in the graphs highlight important aspects in terms of water distribution efficiency. As already evident in figure 1, the comparison between day- and night-time total supplied flow drawn in figure 6 shows very little variations, suggesting again high levels of leakage. Specifically, the estimated daily water supply is 640 litres per capita, while the Water Utility only bills 180 l/capita/day; considering that approximately 10% of the water supply can be assumed to result from apparent losses, the remaining volume of 440 l/capita/day has to be considered the effect of leakage.
The Infrastructure Leakage Index (ILI) of the network, which can be calculated [7] from the network’s average pressure (58 m pressure head), the total number of connections (5,347) and the total length (127 km), equals 12.7. Such value for the ILI confirms the inefficient use of water resources and thus the urgent need for the Water Utility to intervene and reduce water leakage [1].
3 Optimisation criteria
Ideally, the aim is to eliminate leakage in the distribution networks. With unlimited resources, this could be realised by locating all leakage points and rehabilitating or replacing pipes and hydraulic equipment.
However, this scenario does not respect one of the law’s main objectives by omitting any constraints on the investment costs.
As not all levels of improvement in the system performance justify the interventions needed, a cost-benefit analysis is necessary in order to determine the optimal short- and long-term solutions.
In this context, referring to the Tarcento and Magnano in Riviera network, an optimisation criterion has been developed based on the following two stages:
o Leak detection campaigns aimed at finding leakages and subsequent rehabilitation of the main pipes (diameter ≥ 150 mm, length = 34 km); o Districtualisation of the distribution network and pressure management
in two configurations:
a) Installation of five pressure-reducing valves (PRVs); b) Installation of five micro-turbines or inverse pumps (PATs). Leakage detection and repair of primary mains involves relatively lower maintenance costs, as they are generally situated in peripheral urban areas, characterised by a lower density of population and human activities.
Table 2: Estimated water recovery for the leakage research campaign.
Vplaced (l/pp/d) Vdelivered (l/pp/d) Vphysical leakage (l/pp/d) Vrecovered (l/ab/d) Reduction leakage (%) Reduction Vplaced (%) Current state 640.00 200.06 439.94 – – – After the intervention 436.00 200.06 235.94 204 46.37 31.88
The simulated effects of hypothetically rehabilitating 180 pipes from the network, as shown in the following table, can be summarised in a reduction of the total supplied water volume of about 32% (table 2).
In these conditions, the water pumped towards the Segnacco storage tank would not be necessary and the pumping station could be eliminated.
The choice of regulating the service pressure through PRVs and PATs (figure 7) is based on the widely recognised notion that pressure management methods are among the most effective forms of leakage reduction [8–11]; in particular, some studies proved the reduction in mains failure frequency and leakage to progress exponentially with the service pressure reduction.
Figure 7: Networks of Tarcento and Magnano in Riviera – districtualisation
and localisation of the PRV/PAT.
Table 3 shows the 5 scenarios characterised by the contemporary operation of more than one PRV; specifically, the table shows the daily volume entering the network, the daily volume supplied and the daily volume lost through leakage. In particular, the insertion of 5 pressure reducing valves recovers 23.5% of real loss while holding the amount of billed water constant. The distribution network’s ILI for this scenario would decrease to only 8.2, showing how leakage detection and pressure management through the use of PRVs significantly improved the efficiency of the distribution network.
PRV/PAT Xotti PRV/PAT Collerumiz PRV/PAT Loneraccio PRV/PAT Collalto PRV/PAT Centro PAT Vergon
Table 3: Estimated water recovery as an effect of districtualisation and insertion of regulation valves.
N. of valves
in operation (l/pp/d) Vplaced (l/pp/d)Vdelivered Vphysical leakage(l/pp/d V(l/ab/d)recovered leakage (%) Reduction VReduction placed (%)
1 409.43 200.06 209.37 26.57 11.26 6.09
2 397.60 200.06 197.54 38.40 16.28 8.80
3 391.66 200.06 191.60 44.34 18.79 10.17
4 388.92 200.06 188.86 47.08 19.95 10.80
5 380.55 200.06 180.49 55.45 23.50 12.72
The use of PATs instead of PRVs would lead to the same network performance, offering an added value connected to energy production [12]. Their use would therefore create a synergy between pressure control and the valorisation of renewable power.
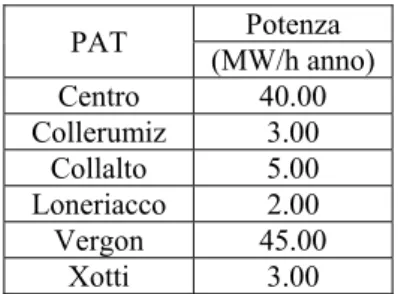
Table 4 shows the estimates of the annual energy production values for the six installed PATs. The results show an overall energy production of approximately 100 MWh/year, of which the “Centro” and “Vergon” PATs produce approximately 85%.
Table 4: Estimated annual production. PAT (MW/h anno) Potenza Centro 40.00 Collerumiz 3.00 Collalto 5.00 Loneriacco 2.00 Vergon 45.00 Xotti 3.00
4 Performance index of the electricity networks
The added value related to the electrical energy production for the Water Utility can be evaluated both in monetary terms (because the energy produced can be sold) and in terms of an overall increase in network efficiency, using the ILI. The ILI is, by definition, the ratio between CARL (Current Annual Real Losses) and UARL (Unavoidable Annual Real Losses), shown in the following equation [13]: ] [ ] [m 33 m UARL CARL ILI (1)
Leakage detection, structural modifications of the water supply network, districtualisation and pressure control are all interventions which improve the performance index because they tackle real losses. The installation of turbines
adds a direct economic benefit (as a consequence of energy production) to the performance-related benefit.
Revenues connected to the sale of the renewable energy produced (Gyear),
given the unit cost of water as a resource (Cwater), can be computed as equivalent
water volume recovered.
Defining the parameter Ep as the water equivalent of the power produced by
the generators and reintroduced in the energy market, it is possible to modify the ILI expressed by eqn. (1) as follows:
3 water m C G Ep year (2) ] [ ] [m 3 3 m UARL Ep CARL ILI (3)Applying this criterion to the Tarcento and Magnano in Riviera network shows even further reductions in the ILI (considering all the proposed measures in the context of a general network optimisation).
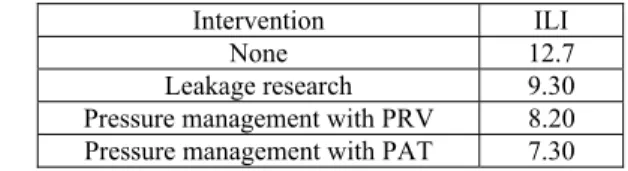
Table 5 shows the ILI after each of the proposed measures. When all the proposed measures are taken into account, the initial value of 12.7 drops to 7.30, considering the correction based on the energy production.
Table 5: Estimated variation in the ILI network performance.
Intervention ILI None 12.7 Leakage research 9.30
Pressure management with PRV 8.20 Pressure management with PAT 7.30
The revenue generated by the production of renewable energy, once the investment costs have been recovered, could represent an alternative to water tariff adjustments aimed at the coverage of operational costs and at the improvement of system performances.
References
[1] Bertola, P. & Nicolini, M., Evaluating reliability and efficiency of water distribution networks. Efficient Management of Water Networks. Design and Rehabilitation tecnique, ed. Bertola, P., Franchini, M.: Franco Angeli, Milano, pp. 7-23, 2007.
[2] Bizzarri, A., Di Federico, I., Di Federico, V. & Mazzacane, S., (eds). Reti di distribuzione idrica urbana. Indagine di affidabilità. Edilizia – Edilizia Ricerche, 1st edition: FrancoAngeli, Milano, Italy, 2000.
[3] De Marinis, G., Gargano, R. & Tricarico, C., Un modello per la riabilitazione delle reti di distribuzione idrica. Proc. of the 3rd Conf. On La
ricerca delle perdite e la gestione delle reti di acquedotto, Perugia, Italy, September, 2007.
[4] ISTAT, Census water for civil use – Year 2008. Report of the National Institute of Statistics (ISTAT), Italy, 2009.
[5] Silvagni, G., Fortucci, C., Volpi, F. La domanda idropotabile giornaliera. La Gestione e l’Affidabilità dei Sistemi Acquedottistici, ed. Bertola, P., Franchini, M.: Editoriale BIOS sas, Cosenza, pp. 75-86, 2004.
[6] Silvagni, G., Sileo, C., Claps, P. Un modello per la valutazione dell’affidabilità di un sistema di adduzione potabile. Gazzetta Ambiente, 3, pp. 9-20, 2002.
[7] Alegre, H., Baptista, M., Cabrera, E. Jr., Cubillo, F., Duarte, P., Himer, W., Merkel, W. & Parena R., Performance Indicators for Water Supply Services, second edition. IWA Publishing, 2006.
[8] Thornton, J., Water Loss Control Manual. McGraw-Hill, New York, 2002. [9] Farley, M., & Trow, S., Losses in Water Distribution Networks: A
practitioner’s guide to Assessment, Monitoring and Control. IWA Publishing, 2003.
[10] Van Zyl, J.E., Clayton, C.R.I. The effect of pressure on leakage in water distribution systems, CCWI2005 Water Management for the 21st Century, eds Savic, D.A., Walters, G.A, Khu, S.T. & King, R.: Centre for Water Systems, University of Exeter, UK, Vol. 2, pp. 131-136, 2005.
[11] Bertola, P., Nicolini, M., Gestione ottimale delle perdite in sistemi di distribuzione idrica tramite valvole riduttrici di pressione. Proc. of the Conf. On La ricerca delle perdite e la gestione delle reti di acquedotto, Perugia, Italy, 2006.
[12] Bertola, P., Silvagni, G., Nicolini, M. & Volpi, F., La producibilità mini idroelettrica nelle reti di distribuzione idrica: aspetti tecnici e normativi. La Gestione delle Reti Idriche, ed. Bertola, P., Franchini, M.: Franco Angeli, Milano, pp. 9-25, 2011.
[13] Lambert, A., Brown, T.G., Takizawa, M. & Weimer D., A Review of Performance Indicators for Real Losses from Water Supply Systems. AQUA, Journal of Water Services Research and Technology 48(2), pp. 227-237, 1999.