ALMA MATER STUDIORUM - UNIVERSITÀ DI BOLOGNA
DOTTORATO DI RICERCA IN: Computer Science and Engineering
Ciclo XXXII
Settore Concorsuale: 09/H1
Settore Scientifico Disciplinare: ING-INF/05
SEMANTICS DRIVEN
AGENT PROGRAMMING
Presentata da: Francesco Antoniazzi
Coordinatore Dottorato Prof. Davide Sangiorgi
Supervisore
Prof. Tullio Salmon Cinotti
Co-Supervisore Prof. Luciano Bononi
This work is licensed under a Creative Commons “Attribution-NonCommercial-NoDerivatives 4.0 International” license.
francesco.antoniazziunibo.it francesco.antoniazzioutlook.com
Contents
Abstract in English 5 Abstract in Italiano 7 Abstract en Français 9 Introduction 11 1 Background Research 15 1.1 Internet of Things . . . 151.2 The Semantic Web . . . 19
1.2.1 Visualizing the Semantic Web . . . 21
1.2.2 AudioCommons Project . . . 34
1.3 SPARQL Event Processing Architecture . . . 37
1.3.1 Origins . . . 37
1.3.2 Architecture . . . 38
1.3.3 Future . . . 40
2 Semantic Internet of Things 43 2.1 Semantic Interoperability . . . 43
2.2 Internet of Musical Things . . . 45
2.2.1 Methodology, audience, and scope . . . 47
2.2.2 Related ontologies and data models . . . 48
2.2.3 Specification . . . 49
2.2.4 Ontology description . . . 51
2.2.5 Implementation and maintenance . . . 58
2.2.6 Evaluation . . . 59
3 Semantic Web of Things 67 3.1 W3C Web of Things vision . . . 67
3.2 A Dynamic Ontology for the Semantic Web of Things . . . 69
3.2.1 Related Work . . . 70
3.2.3 Interaction Patterns: the PAE paradigm . . . 76
3.2.4 DataSchema and FieldSchema . . . 82
4 Semantic Driven Agent Programming 91 4.1 Related Works . . . 91
4.2 SWOT agents framework and Evaluation . . . 93
4.2.1 Cocktail framework . . . 93
4.2.2 Cocktail: in-use analysis . . . 94
4.2.3 Evaluation . . . 97
4.3 Next Steps . . . 100
4.3.1 Cocktail example . . . 101
4.3.2 Habitat project example . . . 104
4.3.3 Future directions . . . 105
Conclusion 109
List of Ontologies & Prefixes 113
List of Figures 115
List of Tables 118
Abstract in English
I
n the last two decades the Information Technology changed substantially the life ofpeople all around the World. Just a few years ago, for instance, paper support was needed to exchange all kind of data, while now electronics is indeed the main instrument of communication. This mutation was originally due mostly to the efficiency, while now it is, hopefully, also due to an increased attention towards environmental issues.Information and data have proved over the time the importance of their role, con-tributing to a plethora of applications that allow the physical world to interact with mankind by the means of services dispatched pervasively and freely accessible. The Internet is the kernel of such complex setup that is called Internet of Things (IoT).
The IoT inherited from the Internet a chaotic interface. Protocols, conventions, mechanisms are different from an application to the other, and it is difficult and expensive to discover and make applications compatible with one another. From this consideration two exceptional ideas were born, namely the Semantic Web and the Web of Things (WoT). The latter would unify the IoT on an application level shared view, enabling standard discovery mechanisms and definitions. The former, on the other hand, intents to provide the tools to formalize the knowledge contents of the World Wide Web in a simultaneously human and machine understandable way.
This Thesis aims to explore both these two concepts and merge them into the Se-mantic Web of Things using the best of each. Therefore we hereby propose, describe, evaluate and use two ontologies: the Internet of Musical Things ontology, aiming to outline a semantic description of IoT; and a Semantic WoT ontology, aiming to push further the state of the art of IoT unification and standardization through a dynamic semantic approach.
Abstract in Italiano
N
egli ultimi due decenni le nuove Tecnologie dell’Informazione hanno cambiatoradicalmente la vita delle persone in tutto il mondo. Soltanto qualche anno fa, per esempio, lo scambio di informazione era necessariamente effettuato sotto forma cartacea in quasi ogni ambito. Oggi, invece, il mezzo elettronico viene privilegiato sempre più per questioni di efficienza nonché, recentemente, si spera anche per motivi legati alla sostenibilità ambientale.L’informazione ha dato prova, nel corso del tempo, della sua importanza. Ha contri-buito a rendere possibili numerosissime applicazioni in grado di far interagire l’umanità con il mondo fisico attraverso un’astrazione composta da servizi facilmente accessibili e distribuiti ovunque. Internet è il cuore di questo grande sistema chiamato Internet of Things (IoT).
L’IoT ha in comune con Internet la sua interfaccia caotica e la mancanza di ordine. I protocolli, le convenzioni, i meccanismi cambiano da una applicazione all’altra, rendendo difficile e costoso scoprire e creare sistemi compatibili. Da queste considerazioni ormai accettate dalla comunità traggono origine due concetti eccezionali: il Semantic Web e il Web of Things (WoT). Quest’ultimo ha come fine quello di unificare l’IoT ad un livello applicativo condiviso rendendo disponibili definizioni e meccanismi standard per la scoperta dei dispositivi. Il primo, invece, fornisce degli strumenti per formalizzare la conoscenza distribuita nel World Wide Web in modo che sia contemporanemante fruibile all’uomo e alle macchine.
Questa Tesi si accinge ad esplorare i due concetti appena descritti, ed a riunirli usan-do il meglio di entrambi nel Semantic Web Of Things. Per fare ciò si proporranno, descriveranno, valuteranno ed useranno due ontologie: l’ontologia dell’Internet of Mu-sical Things, che servirà per mostrare una definizione semantica dell’IoT; e l’ontologia del Semantic WoT, il cui scopo è di spingere oltre lo Stato dell’Arte nell’unificazione dell’IoT e nella sua standardizzazione attraverso un approccio semantico e dinamico.
Abstract en Français
L
es deux dernières décennies ont vu les nouvelles Technologies de l’Informationchanger de manière radicale la vie des gens partout dans le monde. Il n’y a que quelques années, par exemple, des supports en papier étaient nécessaires pour l’échange des données, alors qu’à présent l’instrument principal est l’électronique. Ce changement était dû à l’ origine à l’efficacité de la communication. Maintenant, on l’espère, la raison est aussi liée à la tutelle de l’environnement.Il a été largement démontré que l’information joue un rôle essentiel : innombrables applications ont été développées pour connecter le monde physique et l’humanité à tra-vers des services distribués partout et librement accessibles. Internet est au centre de toute cette infrastructure, qui n’est autre que l’Internet des Objets (IoT).
L’IoT et Internet ont en commun leur organisation chaotique. Les protocoles, les conventions, les fonctionnements internes peuvent être très différents d’une application à l’autre : il est souvent difficile et coûteux de découvrir et créer des applications com-patibles avec le reste des systèmes qui sont à disposition. Ce concept est à l’origine de deux idées exceptionnelles : le Web Sémantique, et le Web des Objets (WoT). Celui-ci a pour but d’unifier l’IoT à un niveau applicatif commun avec des mécanismes de dé-couverte et un vocabulaire standard. Le premier, d’autre part, propose les instruments pour mettre de l’ordre dans la connaissance du World Wide Web, de façon à la rendre à la fois compréhensible à l’être humain, et aux machines.
Cette Thèse explore donc les deux idées à peine présentées, et additionne leurs meilleures qualités pour obtenir le Web des Objets Sémantiques. Ainsi sont proposées, décrites, évaluées et utilisées deux ontologies : celle de l’Internet des Objets Musicaux, pour produire une description sémantique de l’IoT ; et celle du WoT Sémantique, qui voudrait avancer l’état de l’art de la recherche sur l’unification de l’IoT de manière sémantique et dynamique.
Introduction
S
emantic Driven Agent Programming idea joins together concepts that are relatively well-known in literature. Agent programming, as it will be discussed, dates back to the early 90’s [1], while the Semantic Web was introduced by Tim Berners Lee in 2001 [2]. The innovation proposed by this Thesis, therefore, is not given by those concepts taken on their own, but is rather the outcome of their integration into several ideas and projects, which are going to be explored in the following Chapters.The effort made to define such collaboration targets the third pole of interest of the Thesis, namely the Internet of Things (IoT) [3]. As a matter of fact, the IoT represents one of the most outstanding global creativity sources of the last century. With the advent of affordable computing, pervasive electronics and the Internet, technology started to follow a quick and exponential growth trend that today incredibly changed our society [4]. Moreover, technology became part of the life of almost everyone as a service provider. Alongside with this revolution, the growth trend involved also an easier access to the tools needed to create new things and to put into practice new ideas, giving birth to maker movement [5, 6]. Anyone, with some know-how in electronics and informatics, can try to implement his/her own projects, share it to the community and, eventually, also make money with it [7, 8].
All this, with a continuous feedback process to and from the industry and the academy, resulted in a worldwide productivity that still benefits almost every tech-nological field.
Over the time, however, it became clear that this race to innovation was extremely chaotic [9]. In fact, projects were designed in a vertical way from the beginning to the end, and the problem of joining any two of them was often the same as restarting both of them from scratch in a single one performing both tasks [10].
The present work tries to fight with this verticality enabling the IoT to use the tools of the Semantic Web. Ontologies, in the semantic interpretation of the term, represent a great opportunity to provide a common discussion pattern among vertical projects [11]. In particular, two ontologies will be provided here in the following Chapters.
The former, in Section 2.2, is the Internet of Musical Things (IoMusT) [iomust] ontology. The discussion over this ontology will allow us to introduce a full set of concepts and ideas related to an horizontal approach to IoT. Besides, the musical IoT application represents an innovative application in the whole research field.
Such ontology is located at a higher level compared to the previous one. As a matter of fact, in this case we target a newer approach to IoT that treats the pervasive electronics resources as web resources and renames IoT as Web of Things (WoT) [12, 13]. The innovation proposed here is the addition of semantics to further prevent the formation of fragmented entities.
Applying the Semantic Web technologies to the IoT and the WoT by the means of an ontology will give a predefined shared way to set up projects at information and organization level. For instance, in IoT systems there is often a lack of coherence about the definition of the thing, which is a core concept that guarantees interoperability. A standardized approach for concept interpretation would definitely help in building or in-tegrating software and data architecture. In their interesting survey, Liu et al. [14] listed a number of different possible definitions for the thing. The two most relevant among them, for this Thesis, are W3C’s and IEEE’s hereby reported for reader’s convenience.
IEEE [The thing] is any physical object relevant from a user or application perspective. W3C [The things] can be virtual representations of a physical or abstract entities. They can be connected or not connected. Each thing can have one or more virtual rep-resentations. Things can have histories, and have identities, rich descriptions, services, access control and data handling policies. They have URIs.
Both those definitions make clear reference to the fact that the things are not static elements in an application, but instead are interactive factors of change. They are either active or passive in their environment, and consequently contribute to modify the appli-cation context. For this reason, as the term thing is rather confusing and yet not far from a philosophical concept, in this Thesis we will refer to it with a different word, i.e. agent, unless otherwise stated. Such lexical change is derived from the comparison between the two definitions above and the aforementioned paper by Shoham [1]. Some other works, like Mzahm et al. [15] and Savaglio et al. [16] also go in that same direction. In particu-lar, we refer to the agent as an entity that has access to context information, which the Semantic Web is able to realize through its concept interconnection expressivity.
We will discuss how those agents moving and interacting in the semantic architec-ture can be programmed and, even better, how they can provide us as much services as possible, with the lesser effort. Globally, as a result, this work contains a set of proposi-tions that target an integration of the Semantic Web in the IoT towards new working, plug-and-play and fully integrated solutions.
Consequently, the outcome of this study is a complete description of why and how we should put some order in the IoT as it is known today, as well as decide a shared approach to perform this task. It is worth noticing, moreover, that a common way to think about and use the IoT like the one suggested here may enable new opportunities also in other related fields of ICT, like the one connected to the Big Data revolution [17]. The Thesis is organized as follows. In Chapter 1 the research background of the whole work will be explained over its complete state-of-the-art. For instance, the IoT evolution is there summarized, along with a view on the protocols and the challenges that originated from it. Then the Semantic Web will be introduced and, eventually,
the hardware-software architectures that have been developed to use it overcoming its limitations. A research on how to visualize semantic graphs is also included, which we performed with didactic purposes.
Chapter 2, then, will provide a semantic layered view of the IoT by means of the ideas outlined in Chapter 1. The Internet of Musical Things ontology is there fully explained, leveraging general concepts that may be useful to grant horizontal interoperability among various IoT systems within different environments and backgrounds.
Chapter 3, instead, includes the basic concepts needed to start talking about semantic IoT, and extends the discussion to the WoT. It contains, therefore, the description of the Semantic Web of Things Ontology: it compares the approach with the pre-existent works made by W3C, and following this it proceeds with a semantic description of semantic Web Things dynamic semantic interaction.
Following the theoretical views, we provide in Chapter 4 a rather complete evaluation of the ontology. To do so, we show the functionality of a Python framework to use the classes and the relationships previously introduced on a simple example, yet rich in interesting insights. Then, the ontology itself is considered as a whole for evaluation, leading us to ideas for future works to achieve additional results.
Eventually, we make a synthesis and conclude the Thesis.
The work discussed in this Thesis was carried in collaboration with:
• Industrial Research Center on ICT (CIRI ICT) - University of Bologna;
• Advanced Research Center on Electronic Systems Ercole de Castro (ARCES)
-University of Bologna;
• National Institute of Nuclear Physics (INFN) - Section CNAF;
• Centre for Digital Music (C4DM) - Queen Mary University of London;
Additionally, the following research projects represent the background in which all the PhD and this Thesis work has been performed:
HABITAT: Home Assistance Based on the Internet of Things for the AuTonomy,
a POR-FESR 2014-2020 project related to home-caring Internet of Things; http://www.habitatproject.info/
OPEN-NEXT: Real-time and open-source software for embedded platforms of next generation, a POR-FESR 2014-2020 project aiming to develop a platform for
in-dustrial real-time applications working with different devices and technologies; http://www.open-next.it/en/homepage-en/
AUDIOCOMMONS, an Horizon 2020 project (research and innovation grant 688382)
https://www.audiocommons.org/
SWAMP: IoT based methods and approaches for smart water management in pre-cision irrigation domain, a project for smart agriculture development Horizon
2020-EUB-2017, n. 777112, funded by the European Commission under: H2020-EU.2.1.1. - INDUSTRIAL LEADERSHIP - Leadership in enabling and industrial technologies - Information and Communication Technologies (ICT);
Chapter 1
Background Research
A
s discussed in the Introduction Section, this Chapter provides a complete related work overview of the main relevant topics addressed in the Thesis. In particular, Section 1.1 contains a large reference on the IoT-related technologies that represented a source of inspiration or a basis for the Chapters that will follow. In Section 1.2, instead, the Semantic Web vision and its capabilities are outlined. Some applications will be described to exemplify.Then, in Section 1.3, the base of IoT semantic approach for interoperability developed at ARCES is explored. Almost all the work exposed in this Thesis lays on such approach, that enables dynamic responsiveness in semantic contexts.
1.1
Internet of Things
Electronics is everywhere: it is pervasive [18] both in the spatial and conceptual meaning of the term. That is, sensors are dispatched in almost every environment, and measure almost every physical entity available contributing with their data to countless applica-tions. Actuators, in a similar way, trigger changes within the environment, so that users can benefit from the effects.
The IoT revolution [4, 19] deeply impacted many sectors of everyday life: nowadays research and industry are proceeding towards the smartification of reality, including smart homes [20], smart cities [21, 22], smart health-care [23, 24, 25], smart agriculture [26, 27] and so forth.
Listing all possible architectures employed in IoT applications is a task that is almost impossible, due to the huge variety of the topics that over the time have been concerned by the smartification process. As a reference, anyway, here follows a description at high level of some of them, mentioning in particular the ones that are relevant for the next Chapters.
IoT, as we said, is a term that was coined by Kevin Ashton in 1999 [3]. The vision, indeed, has been since then modified to be coherent with the current available tech-nologies. Just consider that back at that time Internet access was possible, but not as
common as it is today, available in almost every home. This is an interesting indicator of how different might have been the perspective.
Devices, before being connected to the Internet, were directly communicating with one another and therefore we had short distance and small environments. To this ex-tent, a rich collection of protocols and standards were developed like the USB standard, dating back to 1996, and Bluetooth, whose first device was being sold in late 19991. The connectivity through the Internet, due to the limited bandwidth available for data transfer, was not yet ready to support online sensors and actuators and the exchange of their data.
During the following years silicon production processes and studies on computer architectures considerably evolved, revealing the bases of modern IoT. First of all, it was possible to have CPUs with more calculation power in less space; secondly, broadband connection to the Internet became a reality, together with new mobile communication systems (3, 4, and now 5G). In addition, various wireless protocols like Wi-Fi, ZigBee, 6LoWPAN, LoRa became easily available [28]. In some cases, e.g., LoRa and 6LoWPAN, they were designed with the explicit goal of enabling IoT technologies. As Mulligan states in [29], “The concept was born from the idea that the Internet Protocol could and should
be applied to even the smallest of devices”.
Researches like [30, 31] provide a complete discussion on the IoT background, cov-ering the various design layers from calculation units to communication protocols and global architecture.
Such availability of new computation and communication instruments revealed itself to be a powerful trigger for the spreading of IoT, which was then interpreted as the solution to many complex important problems. Moreover, the variety of approaches exponentially increased along with the number of questions that were answered through IoT techniques. So, as a result, defining and realizing an IoT project eventually produced others ideas, in a positive and creative feedback loop similar to the ones in Figg. 1.1 (a) and (b), that are a synthesis of the one exposed by Jacobson et al. [32]. As it can be seen there the problem definition derives from the evaluation of a previous project; a technical
analysis follows, where the state of the art is analyzed, and choices are made: which is
the best hardware platform, which are the most effective communication protocols for this application? How to, in general, design the IoT solution?
Although depicting a rather general approach to engineering problems, Fig. 1.1 fits in a very special way the IoT, hiding its main drawback. Every step in these two flow charts is developed independently from one project to the other. This, eventually, produces applications and systems that work on their own, that are connected to their network, but still are unable to interoperate. Such broken communication may happen at any level of ISO-OSI stack, that is the centre of IoT interoperability, as it is reported by Banerjee et al. [33] and by Rayes et al. [34]:
Physical and DataLink Layer: two IoT systems will not be able to interact prop-erly if it is not possible to share the physical communication mean and if there is no
Co-create Ideate Q & A Map to OSI Prototype Deploy (a) Ideas Problems Technical Analysis
IoT Solution Design
Usage & Evaluation
(b)
Figure 1.1 – Typical problem solving workflow for IoT projects, as exposed by Jacobson et al. [32] (1.1a), and in a higher level synthesis (1.1b).
match in the how they perform direct contact. This includes the usage of legacy and/or constrained networks or devices requiring specific setups [35]. Example: system A communicates with USB protocol, system B with Bluetooth.
When layers 1 and 2 are not matching, device and service local discovery is impos-sible, signifying that devices and systems cannot even be aware that other devices and systems are dispatched in the same environment.
Network and Transport Layer: given that two IoT systems share the same Physi-cal and DataLink layers, their remote connection is possible only if routing is also possible from one to the other, and if they agree on how to perform information exchange. For instance, a system exploiting UDP vs a system using TCP and targeting a very different audience.
Layer 3 and 4 match is necessary for remote discovery and complex data share mechanisms [36].
Upper layers: are necessary when the setup gets more complex than mere commu-nication of raw data. IoT systems exploiting upper layers share higher level in-formation, which has to be interpreted in the very same way: from the character sequence choice to the content scheme used to format the data.
A relevant example, here, may be the interaction of two different entities when one produces JSON-formatted data, and the other expects XML. Or, similarly, when they both interact through JSON, but the former uses the tag book to identify an instance of literary creation, and the latter as the action of making a reservation for a flight.
A sequence of choices is made for every IoT system within this stack. This builds up the concept of vertical silos, which means that once that two developed applications are up and running, either the design choices are the same, either at some point information will get stuck and collaboration will not be possible. Studies on how to overcome this fragmented vertical reality were performed since the very beginning of IoT era, and resulted in an extremely rich literature [37, 38]. Among the results, research provided over the years also
• New protocols like AMQP, MQTT, CoAP [39, 40]. In such context, devices are
supposed to be able to use application layer protocols (i.e., they have enough memory and computational power to implement all the stack), and use a topic-based logic to exchange information. That is, interoperability is defined as an agreement on a topic taxonomy, and data is exchanged through a middleware that is able to implement communication on top of topic channels.
• Translators from a protocol to the other, like presented in [41, 42], or from one
hub to the other [43]. This means, in particular, that the communication between entities is mediated by a third entity designed to act as a gateway [44, 45]. This approach, in some cases, generated heavy critics because of gateways development complexity, and privacy issues [46];
• Information level interoperability, which may be considered as a mixture of the
two previous points, in addition with semantic techniques [47, 48, 49, 50]. This ap-proach will be largely explored in this Thesis: it requires applications and systems to organize their data according to standardized schemas (i.e., ontologies).
Globally, anyway, what is clear is that there must be a level shared by all IoT projects and systems to make environments communicate to each other and to assure that, for the future, service update will not imply a complete and expensive redesign.
It is worth saying also that the concepts of Cloud Computing before [51], and Fog Computing later [52], were in the end pursuing that same idea of achieving full connection of information. In fact, Big Data [53] has been largely feeding from both of them but still, among its known drawbacks [54, 55], the disorder and incoherence of information are probably the mostly well known.
The three points previously listed besides show that information interoperability is the key for breaking the silos, even more than protocol aspects (whose lifecycle brings them to evolve continuously following technological trends). As a matter of fact, even the new facet of IoT, i.e. the Web of Things (WoT) [12, 56], whilst calling for the uniform usage of the protocols of the web in the IoT, must face the problem of interpretation of resources.
In this Thesis, to achieve this shared access to information we exploit the capabilities of the Semantic Web to describe data generated by machines in a machine understand-able way [2, 11]. The next Section will provide some general examples of it, while Section 1.3 will explain some tools necessary for an application of the Semantic Web to the Internet of Things world: the SPARQL Event Processing Architecture.
1.2
The Semantic Web
The possibility to freely interlink any piece of information and any service with all the others is to be considered over the time one of the reasons of the great success of the Internet. However, the idea that Web resources could be better organized is also quite old. Internet chaotic approach was heavily criticized as the Web reached its status of information and service provider.
How to discover resources, how to perform requests, if no agreement is made on how contents are placed?
A first architectural answer to these questions was given in the research that intro-duced the REpresentational State Transfer (REST) pattern [57] conducted in 2000 by Roy Fielding. The suggested approach provides a set of rules on how to organize systems whose information and services are web-based. Nowadays this is de facto a standard, and contributed heavily to the development of actual standards like HTTP 1.1 [58] and URI [59]. Moreover, the IoT and the WoT were also influenced, and several architectures were proposed in litterature [60, 61, 12].
Nevertheless, RESTful architecture and principles (and its constrained version, called CoRE2) do not provide a logical taxonomy to describe the reciprocal relationship be-tween resources, excepted the request of a tree setup. Such logical meta-information is demanded to the standards introduced in the Semantic Web [2, 11], namely OWL3, RDF4, RDFS5 and SPARQL Language6. Briefly, this can be summarized as it is ex-plained in Fig. 1.2: the Semantic Web allows to organize resources, given as URIs, blank nodes, literals, in the form of triples subject-predicate-object. The subject can be a URI or a blank node; the predicate must be a URI; and the object can be a URI or a blank node or a literal.
This network of triples, that can be extremely complex, results in a resource graph, which is also known as Knowledge Graph or Knowledge Base (KB). To make an example of Knowledge Graph it is worth citing DBpedia7, which is a crowd-sourced community
effort to extract structured content from the information created in various Wikimedia projects, and is therefore open to all. It can be explored by using the SPARQL language,
which we will largely use in the remaining of the Thesis.
2 https://datatracker.ietf.org/wg/core/about/ 3 https://www.w3.org/TR/owl2-overview/ 4 https://www.w3.org/TR/rdf11-mt/ 5 https://www.w3.org/TR/rdf-schema/ 6 https://www.w3.org/TR/sparql11-overview/ 7 https://wiki.dbpedia.org
subject object
dbpo:Jack_Nicholson foaf:Person
predicate
rdf:type
Figure 1.2 – An example of semantic triple storing the information that the resource URI related to Jack Nicholson makes reference to an entity of type Person, as it is defined in [foaf] ontology.
To get an idea of how powerful is the setup provided by DBpedia, let us consider the following request:
Design a software that, by querying the Internet, will list an “actor genealogy”.
Starting from two actors, an “actor genealogy” is a sequence of triples (actor1, actor2, film) that allows in the minimum number n of steps to connect the two actors through their films. For instance, trying to connect Jack Nicholson to Matt Damon should give, as possible result, a single triple connecting them through the well known 2006 film The Departed. Instead, trying to connect Jack Nicholson and Julia Roberts results in two triples with George Clooney respectively in Batman_1989_series and Ocean’s Eleven.
To address a problem like this, it is possible to avoid using DBpedia. Various services, on the web, provide APIs to list films, actors and their respective awards. However, here we will show that the semantic approach is definitely less expensive and more simple. For a non semantic approach, since we are interested in the shortest path from one actor to the other, a breadth first search is probably the easiest solution. Therefore, we expect to perform a sequence of requests to the web service, and list the films in which an actor starred, the other actors that were involved, iterating until there is a match for every actor in the sequence.
Instead, a semantic approach would simply search for patterns increasing in depth by 1 at each loop, as shown in the pattern in Listing 1.1. Consequently, by using the semantic KB contained in DBpedia we will perform exactly n requests for a n-step match, and we will not have to implement a breadth first search over a tree result.
Listing 1.1 – SPARQL pattern example to solve the actor genealogy problem. Consider Table 4.4 for expanded prefixes. # D i r e c t m a t c h S E L E C T ? f i l m 1 W H E R E { ? f i l m 1 d b p o : s t a r r i n g < a c t o r _ i n > , < a c t o r _ o u t >. } # One s t e p m a t c h S E L E C T ? f i l m 1 ? a c t o r _ 1 ? f i l m 2 W H E R E { ? f i l m 1 d b p o : s t a r r i n g < a c t o r _ i n > , ? a c t o r _ 1 . ? f i l m 2 d b p o : s t a r r i n g ? actor_1 , < a c t o r _ o u t >. }
This example gives just a simple overview of how the Semantic Web can help. In general, however, we have that the graph in the KB is formatted according to specific ontologies, that represent a pattern for triple organization [62]. In the List of Ontologies Section it is possible to have a quick look on the ontologies that will be used in this Thesis.
The ontology pattern is often considered as a bottleneck for the usage of Semantic Web. Ontologies, in many cases, are quite difficult to be understood and used: this creates a steep learning curve of the concepts and relationships expressed that, especially in a learning environment, can hinder the realization of applications. To address these obstacles, in the next Section some visualization techniques for the Semantic Web will be studied.
1.2.1 Visualizing the Semantic Web
This survey Section is based on a research work made at ARCES, aiming to create a better teaching-learning support for the students of the course Interoperability of
Em-bedded Systems held at the School of Engineering, University of Bologna. The following
paragraphs are therefore inspired from the works8 that were issued as a result of the
research.
Accessing and understanding the content of a database is hardly ever a negligible task for programmers. When data is stored in a relational database, the views are obtained by transforming into a table the output of a query written in one of the various flavors of the SQL language. Smart-written queries on equally smart-built databases can efficiently perform a lot of calculations over data, as well as outline special and complex relationships even between apparently distant entries. Therefore the know-your-data principle, typical of Data Mining and Big Data theory, is in fact a more general and solid base from which to start any data-related implementation, though implying sometimes great study effort from the developer in the initial phase of software creation [63]. It is, as a matter of fact, common knowledge that frequently programmers have to spend more time in organizing and reformatting their data more than in the actual programming logic.
The appearance of the Semantic Web in the panorama of information technology gave ways more than a simple new tool to explore the Web, but a new interpretation of the resources available on the Internet. Through the SPARQL language and the Resource Description Framework, the Internet network is considered as a whole a special database whose resources are interconnected in a labeled directed graph. The main idea of the Semantic Web, therefore, is to exploit the concepts of URI to bind resources through triple-based statements (i.e., the already mentioned subject-predicate-object triple). Any connection is in that fashion not a simple reference as hypertext linking is, but contains in addition the information given by the inner content of the resources. Then, according to W3C recommendations (see footnotes of Section 1.2), the Semantic Web in the end
8 2018 IEEE. Reprinted, with permission, from Antoniazzi, F., & Viola, F. (2018, November).
RDF Graph Visualization Tools: a Survey. In 2018 23rd Conference of Open Innovations Association
takes the form of a graph, where both the contents and the statements contribute to the overall meaning.
A few considerations are needed, however, when we start discussing about the possi-bility to store information in a semantic graph. In fact, some critical points are present, and have to be highlighted. First of all, as it is depicted in [64], without regulations, the semantic graph is doomed to chaos, i.e. to an unpredictable information taxonomy. The solution to this issue is the ontological description of knowledge, that consists in the formal definition of all the classes, relationships and statements that can be present in the graph. Once the programmers agree on the ontology, there is no uncertainty on how the data is organized. All the information needed to query the graph is stored in an OWL file, standing for Web Ontology Language. OWL is, according to W3C, a
semantic markup language for publishing and sharing ontologies, and has been widely
used to define all sort of ontologies and vocabularies (which are smaller ontologies): an interesting repository, in this field of study, is the Linked Open Vocabularies website9
and, for the next Sections of this Thesis, the List of Ontologies.
A second critical point is connected to the dimension of the graph, which can be considerable not only when we are discussing about web-located knowledge bases like DBpedia [65], or the Internet itself, but also in smaller applications exploiting RDF and SPARQL. To make an example, let us perform the query of Listing 1.2 to DBpedia.
Listing 1.2 – SPARQL query to all classes parent of the resource dbpedia:The_Lord_of_the_Rings S E L E C T ( c o u n t (? o ) as ? c o u n t ) W H E R E { d b p e d i a : T h e _ L o r d _ o f _ t h e _ R i n g s rdf : t y p e ? o } Query execution: Last visited: 15/10/2019
Listing 1.3 – SPARQL query to every link (except rdf:type) with dpbedia:The_Lord_of_the_Rings as origin, and the destination’s class S E L E C T ? p ( c o u n t (? t ) as ? c o u n t ) W H E R E { d b p e d i a : T h e _ L o r d _ o f _ t h e _ R i n g s ? p ? o . ? o rdf : t y p e ? t F I L T E R (? p != rdf : t y p e ) } Query execution: Last visited: 15/10/2019
The output of the query, which is a simple request to count all the classes that “The Lord of the Rings” resource belongs to, is equal to 25. Clearly, far from a naive and optimistic expectation of a few outputs similar to :Book, :Novel and so on. Listing the actual values consequently results in a 25-rows table that outlines the evidence of the hidden complexity in the results analysis, even in simple situations. The complexity
grows considerably if we proceed querying on the following level (Listing 1.3).
The query available in Listing 1.3 with the variable ?count outputs the number of links of type ?p outgoing from the resource dbpedia:The_Lord_of_the_Rings, except from rdf:type links, that can be viewed by performing the query in Listing 1.2.
The direct outcome after running the queries in the Listings 1.2 and 1.3 is given by the possibility to observe the available variability of results and to look for their meanings. The output of those simple SPARQL queries highlights, for instance, that the “Lord of the Rings” resource is individual of at least 25 classes which we expect to have a specific meaning and a description of their own. Going further with the latter query, moreover, the number of elements connected to the resource is even more increasing, both as connectivity spread, and in diversity of ontological classes involved. In general the description of all those resources can be as pragmatic as an algorithm, or philosophical, or mathematical. However, it is clear that without the Semantic Web it would be hardly achievable to obtain such a multi-layered description of a resource, apart from using natural language. In fact, when it comes to exploit the tools of Semantic Web, a frequent feeling is that it is not possible to reuse previously available data, because it would imply to understand completely all the resources, all the classes, and all the ontologies that are standing behind. According to [66], expressiveness, in this situation, is a bottleneck for Semantic Web.
This is where visualization tools for the semantic graph come to help: they provide a step by step approach to the knowledge base that, together with filtering techniques, and the possibility to see the contents, are useful to go through the relevant concepts.
Possible visualizations
As we said previously, the most frequent way to produce a view of a database is the tabular representation. This is a possible solution also for queries made in SPARQL language to RDF triple stores like Blazegraph, Fuseki and Virtuoso. The view of a SPARQL SELECT is a direct consequence of the number of variables concerned by the inquire: i.e., the number of variables in the SELECT clause is the same as the number of columns contained in the results. To be more precise, to obtain the column number either (i) it is necessary to count the variables queued after the SELECT keyword, like in listings 1.2 and 1.3; or (ii), variables have to be obtained from the WHERE clause, as in the SELECT * WHERE {...} case.
The drawbacks with table views are, unfortunately, already quite visible when the number of rows reaches as little as few dozen entries. Aside from the fact that there is not a group view of the overall query result, the table often is required to contain more than one row for the same conceptual entity. This happens for instance when a resource is connected to another via more than one predicate, or when it is connected to different objects, through the same predicate.
In such situations, the result table can contain not only plenty of lines with the same meaning disturbing the overall understanding of the query output, but also, as already said, a high number of columns. Moreover, some entries in the table can also be empty, as an effect of OPTIONAL statements in the query. Detecting particular cases, in sparse
and large tables, becomes a time-consuming and error-prone task in those situations. On the other hand, a few workarounds are available in SPARQL language to crunch into a single line the occurrence of multiple table lines for a single concept, but they usually imply slowing down the performances, and have the effect to concatenate the values into strings. That is, we lose the possibility to check if they are represented as IRIs, literals, or blank nodes.
The multi-table approach is a graph visualization technique that tries to address the problem of having limited control over the complete data table. Let’s consider a query selecting all triples in the RDF store: SELECT * WHERE {?a ?b ?c}, and let’s suppose that in the store only 5 distinct resources might correspond to the ?b variable. With this background a full-table approach would return an n = 3 column table, where
n is the number of variables. Instead a multi-table approach would outcome with 5
smaller tables, one for each one of the ?b resources, each of them built up of n− 1 = 2 columns. An interesting work about the complexity of translation from SPARQL to other languages, included table view, was provided by Chebotko et al. in [67]: among all the contributions, this paper perfectly shows the complexity of a multi-table approach.
Finally, last but not least, the RDF knowledge base representation can be performed through a labeled graph visualization. Although the RDF concept is defined for directed graphs, in most of the cases the label is sufficient to get at view time the direction of the connection. This allows the usage of algorithms for undirected graphs. Nevertheless, the drawbacks of this approach are also related to the knowledge base dimension, as the understanding of contents is tightly bound to the possibility of identify paths and node types easily and effectively.
Graph drawing algorithms
There is a complex relationship between the domain of the semantic application, the tool that is being used, and the algorithm that is implemented to visualize the graph. To make an example, let’s consider a knowledge base in which information about some people is stored. If the application working on the knowledge base is not interested in literal terms, the sight of the graph would be effectively simplified and clearified by just removing all the links towards literal terms, e.g. names, surnames and birth dates.
In other RDF triple stores more than one unique ontology may have been used to define resources, exploiting for instance simultaneously the [foaf] ontology and the Dublin-Core ontology [dc]. If an application is interested only in the [foaf]-related connections, and in a small part of the DC’s, there would be no use in trying to represent everything.
A full description of all the algorithms available for graph drawing is out of the scope of this Thesis. In this Section, nevertheless, a brief overview of a few works available in literature is given, before proceeding in the next paragraph to the analysis of the tools. A complete theoretical overview of the main algorithm logic available to draw graphs is given by Kobourov in [68]. Spring algorithms and their variations for instance are explained: they usually aim to reproduce an aesthetically pleasant view, even if their best performance is obtained in most of the cases when the graph has less than 40
vertices. However, as it has been said, the semantic graph is definitely a large graph, or very large, and for this reason it demands particular approaches that imply multiple scale algorithms. Nodes organization is not necessarily done on a plane: possible alternatives are to dispose them on a sphere or other geometrical objects. In [69] more than one plane is used, which can be a technique also to represent the evolution of data over time. How to show in an effective way dynamic evolution of contents in a graph is also the topic of survey [70] by Beck et al.
Listing 1.4 – SPARQL CONSTRUCT that identifies in DBpedia the Fantasy-genre books written between 1900 and 2018 having more than 200 pages. C O N S T R U C T { ? b o o k rdf : t y p e d b p o : B o o k ; db p o : l i t e r a r y G e n r e : F a n t a s y _ n o v e l ; db p o : a u t h o r ? a u t h o r ; db p o : r e l e a s e D a t e ? d a t e ; rd f s : c o m m e n t ? c o m m e n t ; rd f s : l a b e l ? l a b e l ; db p o : n u m b e r O f P a g e s ? num ; fo a f : i s P r i m a r y T o p i c O f ? t o p i c . ? a u t h o r rdf : t y p e f o a f : P e r s o n } W H E R E { ? b o o k rdf : t y p e d b p o : B o o k ; db p o : l i t e r a r y G e n r e : F a n t a s y _ n o v e l ; db p o : a u t h o r ? a u t h o r . ? a u t h o r rdf : t y p e f o a f : P e r s o n . ? b o o k r d f s : c o m m e n t ? c o m m e n t ; rd f s : l a b e l ? l a b e l ; db p o : n u m b e r O f P a g e s ? num ; fo a f : i s P r i m a r y T o p i c O f ? t o p i c . F I L T E R l a n g M a t c h e s ( la n g (? l a b e l ) , " EN " ) F I L T E R l a n g M a t c h e s ( la n g (? c o m m e n t ) , " EN " ) F I L T E R ( i s I R I (? a u t h o r )) F I L T E R ( xsd : i n t e g e r (? num ) > 2 0 0 ) O P T I O N A L { ? b o o k d b p o : r e l e a s e D a t e ? d a t e . F I L T E R (? d a t e > 1 9 0 0 ) F I L T E R (? d a t e < 2 0 1 8 ) F I L T E R ( i s L i t e r a l (? d a t e )) F I L T E R ( d a t a t y p e (? d a t e ) = xsd : i n t e g e r ) } } Query execution: Last visited: 15/10/2019
Graph visualization tools
Hereby a detailed analysis of the main tools for the visualization of RDF knowledge bases and ontologies is proposed. We focus on the tools providing a graph visualization of RDF statements. The tools presented in this Section are reported in alphabetical order.
CytoScape is a tool for network data integration, analysis and visualization. Support
to Semantic Web technologies is provided by a set of extensions hosted on CytoScape’s App Store, such as General SPARQL, SemScape and Vital AI Graph Visualization [71]. General SPARQL allows to navigate semantic web KBs through an extensible set of pre-defined queries. The plugin is pre-configured to retrieve and visualize data from public endpoints (e.g., Reactome, Uniprot, HGNC, NCBI Taxonomy, Chembl). SemScape supports the interaction with remote SPARQL endpoints by means of SPARQL queries. In this way, CytoScape can be employed to visualize the results of a query. Vital AI Graph Visualization is not limited to semantic databases, but provides access also to SQL and NoSQL databases as well as Apache Hadoop instances. To the best of authors’ knowledge, this tool only allows the visualization of data compatible with the BioPAX format.
Fenfire was a tool for the visualization and editing of RDF graphs aimed at an
interac-tive exploration of the graph [72]. Authors face the problem of scalability by limiting the exploration of the graph to one thing at a time. The visualization in facts, diplays only one central node and its surroundings. The central node, at the beginning of the explo-ration is selected exploiting the foaf:primaryTopic property (if present), otherwise is selected by the user. The nodes surrounding the central one (named focus) are placed on the plane according to a simple strategy: on the left, all the nodes being subjects of the statements linking to the focus. On the right, those being objects of the statements. Development of Fenfire stopped in 2008.
Gephi is a very powerful tool designed to represent not only semantic graphs, but every
kind of graph or network [73]. Support to RDF graphs is provided by two external plu-gins, VirtuosoImporter and SemanticWebImport (this one developed by INRIA). Gephi is able to retrieve data from SPARQL endpoints (through REST calls) as well as to load RDF files. Gephi supports filtering the KB through SPARQL queries. The look of the graph visualized by Gephi is fully customizable, in terms of colors and layouts; moreover the tool supports grouping similar nodes and this helps achieving better results when dealing with very complex graphs. As regard exporting the graph, Gephi is the tool that supports the highest number of file formats for exporting the graph. Among these, it is worth mentioning csv, pdf and svg.
In Figure 1.3a we can see a view of the graph that Gephi is able to retrieve from DBpedia by using the SPARQL CONSTRUCT available in Listing 1.4. The tool performs the representation very quickly, and implements various possible algorithms to build the graph. Unfortunately, as it can be seen, it is quite difficult to get the overall idea of the composition. Although there is the possibility to add the labels of nodes and
(a) The Figure is the output of Gephi’s CONSTRUCT in Listing 1.4 to DBpedia. According to its logger, the triples represented in this graph are 6529.
(b) With Gephi some nodes can be highlighted, to help the user to go through the knowledge base. When the number of edges and nodes is high, however, it’s not easy to outline the information. The nodes in red are related to L. Alexander’s novel “The Black Cauldron”.
Figure 1.3 – Gephi [73] output example.
edges, the output is not reader-friendly, and the research in it is a rather impossible task. A practical example can be observed also in Figure 1.3b, where we highlighted the nodes related to the novel “The Black Cauldron” by L. Alexander. Eventually, a number of statistical functions can be applied to the network, like the Network Diameter, the
Density and the Average Path Lenght: the only problem is that they have, as for the
Authors’ knowledge, very limited use when applied to a Semantic Graph.
Glow is a visualization plugin for the ontology editor Protégé [74]. Force-directed,
GLOW. The items are arranged automatically with every layout, and cannot be moved. The tool is able to represent a set of ontologies and optionally their individuals. To the best of authors’ knowledge, this tool is not developed anymore. No information about the license could be found.
IsaViz is a 2.5D tool for the visualization of RDF graphs originally developed by
E. Pietriga (INRIA) in collaboration with Xerox Research Centre Europe [75]. IsaViz, as the name suggests, is based on GraphViz [76] and allows importing and exporting from/to RDF/XML, Notation 3 and N-Triple files. The result of the visualization can be also exported as a png or svg file. In the Graph view it is possible to select resources and access a textual list of properties (this view is named Property Browser ). A third view is named Radar and presents an overview of the graph, since the graph view may contain only a portion of it. Finally, it is worth mentioning the search tool provided by IsaViz, whose results are highlighted one by one in the graph view. Unfortunately, the last development version of this tool dates back to 2007.
Jambalaya is a Protégé plugin for the visualization of ontologies [77]. Jambalaya is
characterized by the integration of the SHriMP (Simple Hierarchical Multi-Perspec-tive) [78] visualization technique, designed to improve the user experience in browsing, exploring, modelling and interacting with complex information spaces. This technique, originally born to help programmers understanding software, was applied to Protégé to build a powerful visualization of classes and relationships. The tool proposes a nested graph view and the nested interchangeable views. Nesting is used to represent the sub-class relationships among sub-classes as well as the link between sub-classes and their instances (different colors allow to distinguish between classes and instances). Jambalaya also provides an easy way to search for items in the ontology. Despite being an interesting tool developed with support from the National Center for Biomedical Ontology (NCBO), Jambalaya is not developed anymore.
LOD Live is a web-based tool for the incremental navigation of Linked Data available
on a selected SPARQL Endpoint (e.g., DBpedia) [79]. Endpoints can be configured through a JSON map of their parameters, similarly to what happens in Tarsier [69]. The purpose of this tool is to demonstrate that the powerful Semantic Web standards are also easy to understand; the aim is to foster the spread of Big Data. Every resource drawn by LOD Live is surrounded by a set of symbols representing different kinds of relationship (e.g., direct relations, group of direct relations, inverse relations and group of inverse relations). The incremental navigation, joined to the ability of the tool to group properties allows to draw a very clean graph. No support for statistics or advanced filtering (e.g., based on SPARQL) is provided. To the best of our knowledge, directly exporting the graph is not possible. In Figure 1.4 it is shown how LOD Live performs a similar task as the one in Figure 1.3b: exploring data is easier, but there is no way to perform requests like the one in Listing 1.4.
Ontograf is one of the visualization tools provided by the famous ontology editor
Figure 1.4 – To use LOD Live [79] a resource must be fixed. Then, the knowledge related to the resource can be expanded as shown. Like in Figure 1.3b, the example here is based also on L. Alexander’s novel “The Black Cauldron”.
Protégé by iteratively enabling or disabling the desired classes. Ontograf proposes a grid layout (with classes sorted in alphabetical order), a spring layout and a (vertical or horizontal) tree layout. Individuals of a class can be visualized in its tooltip, but this is uncomfortable when dealing with a high number of assertional statements. Ontograf allows to export the visualized graph as a png, jpeg, gif or dot file. This tool exploits the layout library provided by Jambalaya. Fig. 1.5 shows a graph created with OntoGraf using the DBpedia ontology. Classes work and written work were initially selected. Then, a double click on the latter allowed to expand it and visualize all the subclasses (solid blue line), and all the classes linked to it by means of an object property (dashed lines). The last version of Ontograf dates back to April 2010, but is still included in the last stable version of Protégé10 (the 5.5.0, as of August 2019). The tool is useful to
select and visualize (a small number of) classes from the ontologies loaded in Protégé and the existing relationships.
OntoSphere is one of the two tools (the other is Tarsier [69]) that proposes a
three-dimensional visualization of the graph [81]. The rationale behind OntoSphere is that exploiting a 3D space it is possible to better arrange items. Moreover, the 3D visualiza-tion is quite natural for humans and the exploravisualiza-tion can then be more intuitive. Colors allow to easily convey information about the different nature of represented items. On-toSphere is aimed at representing both terminological and assertional statements. Four scene types are proposed to fulfill different requirements. The RootFocus scene shows all the concepts and their relationships on a sphere. The TreeFocus scene draws the tree
Figure 1.5 – A portion of the DBpedia ontology visualized in Ontograf [80].
originating from a concept, while the ConceptFocus scene proposes a view containing all the items linked to a concept. The tool is aimed at domain experts dealing with the development and review of ontologies, as well as novice users that wants to understand the represented data and the links among concepts. OntoSphere is a standalone appli-cations, but can also be run inside Protégé and Eclipse. The last version on the source code repository is dated 2008, so the development stopped ten years ago.
OWLViz is a plugin for Protégé that enables the incremental visualization of the classes
in the class hierarchy [82]. As the name suggests, this tool, like IsaViz, is based on the famous library GraphViz developed by the AT&T and allows exporting the visualized graph as png, jpeg and svg. Through OWLViz is easy to visualize classes and is-a relationships. OWLViz is not developed anymore, but is still included in the last version of Protégé (August 2019).
Paged Graph Visualization (PGV) is a Java software for the visualization of RDF
graphs [83]. It is based on [84], a high performance RDF storage. With PGV, the explo-ration starts from a point of interest and then incrementally includes more data. Such point of interest can be selected interactively from a list or using a complex SPARQL query. Then, it is drawn in the center of the graph using the color green, and its direct neighbors are shown as blue rectangles placed around it. Literals on the other hand, are represented with the white color. The user is able to explore nodes by double-clicking on them: explored nodes are then displayed in green, while edges connecting explored nodes are depicted in red. Deligiannidis et al. [83] declare that the tool’s strength relies in helping the user willing to explore data without knowing the exact information and graph patterns he is looking for, while in other situation a standard visualizer could be more appropriate. This tool seems to be not developed anymore.
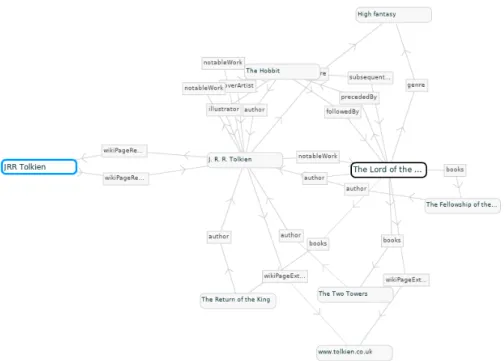
Figure 1.6 – RelFinder view of the paths from “JRR Tolkien” to “The Lord of the Rings”.
instance linked in the homepage of the project (configured to access DBpedia) [85]. RelFinder differs from the other tools proposed in this survey, since it is aimed at vi-sualizing all the paths connecting two resources. So, its purpose is to answer a very specific question, rather than providing a tool for the free exploration of the knowledge base. The tool supports filtering to increase or reduce the number of relationships shown simultaneously. It also implements a smart drawing algorithm to reduce overlapping and the user is allowed to move and pin items. To the best of authors’ knowledge, this tool is not actively developed but the online instance is still available for tests on the DBpedia endpoint. Fig. 1.6 reports an example of this application where all the paths between two DBpedia resources, i.e, “JRR Tolkien” and “The Lord of the Rings”, are shown.
Tarsier is a tool developed by ARCES research group. It is a software for the interactive
exploration of an RDF graph in a three-dimensional space, aimed at the visualization of small and medium-sized knowledge bases. The main contribution of the tool is the introduction of the metaphor of semantic planes that group RDF terms sharing a com-mon concept. The purpose of the tool is threefold: 1) Tarsier can be used as a support for didactic (e.g., to help newcomers to deal with Semantic Web technologies); 2) It is useful to figure out the nature of a new KB for developers (i.e., activity known as “sensemaking” [86]) ; 3) It allows debugging of semantic knowledge bases.
Tarsier retrieves data from SPARQL endpoints. The initial knowledge base can be determined through a SPARQL Contruct query: this pre-filtering stage allows to efficiently interact also with very large knowledge bases (e.g., DBpedia, that contains more than 6.6M entities). Tarsier proposes a classification of all the RDF terms among
(a) Tarsier showing the graph of all the fantasy books published from 1900 to 2018 and their authors. This subgraph is retrieved from DBpedia.
(b) Tarsier showing two semantic planes over the main knowledge base: one showing books, the other (the topmost) showing the author Marion Zimmer Bradley.
Figure 1.7 – Tarsier [69] user interface.
classes, resources, blank nodes, literals, object and datatype properties. This grouping is exploited by Tarsier’s web interface to provide a set of controls for advanced filtering: through them, the user is allowed to toggle visibility of items or to move them across semantic planes.
An example of Tarsier is shown in Figg. 1.7a and 1.7b. Tarsier was set up to retrieve data from DBpedia, and in particular to extract all the fantasy books published between 1900 and 2018 and their authors. While Fig. 1.7a shows the unfiltered knowledge base, in Fig. 1.7b is shown one of the peculiarities of Tarsier: the semantic planes. Two semantic planes were created over the main knowledge base to extract respectively books and one of the authors, i.e., Marion Zimmer Bradley. In this way, it is easy to notice how this instance of the class foaf:Person is linked with the graph.
TGVizTab is yet another visualization plugin for the ontology editor Protégé [87].
It is designed to be lightweight and support both T-Boxes and A-Boxes visualization, and it relies on TouchGraph, an open source Java environment aimed at creating and navigating network graphs in an interactive way. The tool supports exporting the graph in an XML file, to be loaded in other TouchGraph applications. The graph is drawn using the spring layout: similar nodes are drawn close to each other. TGVizTab, like other tools (e.g., Fenfire), asks the user to select a focal node among classes and instances to generate the graph. Then, the user is able to further modify the graph by right-clicking on the represented nodes: in this way the so-called Node Menu is shown, containing four
options (i.e., expand, collapse, hide, view). Then TGVizTab allows to incrementally build the desired visualization.
VOWL (Visual OWL) is available as a web-based tool (WebVOWL [88, 89]), a plugin
for Protégé (ProtégéVOWL [90]), a tool able to directly interact with Linked Data endpoints (LD-VOWL [91]), and as a visual query language tool (QueryVOWL [92]). Here we will refer to the web based version, WebVOWL. As the name suggests, software in the VOWL toolkit are designed to graphically represent ontologies. They propose a force-directed graph layout. The basic representation rules adpoted by VOWL consists in:
• Classes are depicted using circles where the color depends on the type: light blue
for OWL classes, purple for RDFS classes, dark blue for those imported by other ontologies, gray for deprecated classes.
• OWL object and datatype properties are represented with black solid lines with,
respectively, light blue and green labels, while RDFS properties have purple labels.
• Relationships subClassOf are depicted with a dashed line.
The graph drawn by VOWL can be exported as an svg image or as a json file. A click on a node or edge allows visualizing the associated metadata and statistics. Statistics also report the number of individuals of the selected class, but unfortunately this is the only information about individual that is possible to obtain using VOWL. As regards filtering, VOWL provides a basic support to filters that allows to show/hide object/datatype properties, solitary classes, class disjointness and set operators.
VOWL is actively developed and an online instance is available. As the tool is designed for ontologies, importing the output of the CONSTRUCT in Listing 1.4 results in representing only the two rdf:type relationships. The other tools are still being developed and at the moment do not allow to perform a customized request to DBpedia.
Overall considerations on graph visualization
Table 1.1 summarizes the main features of the analyzed software. Columns of the table are:
• Software – reports the name of the software;
• T-Boxes – this column tells if the tool supports the visualization of terminological
statements;
• A-Boxes – this column shows if the tool supports the visualization of assertional
statements (and can then be used to explore a knowledge base, rather than just ontologies);
• Statistics – a boolean field showing if the tool provides or not statistics on the
• Filtering – filtering allows to show/hide elements in the visualization according to
a set of user-defined criteria. Filtering can be implemented in very different ways (e.g., SPARQL queries, or UI controls to select classes, just to name a few). This column indicates whether the related tool provides at least one filtering mechanism.
• Editing – This Thesis surveys visualization tools for semantic data, but some
of them also offer editing functionalities. This column states whether or not the related tool supports the manipulation of the ontology/knowledge base;
• Standalone – Many of the surveyed tools were born as plugins for the ontology
editor Protégé. Other can be run as standalone software. This column tells if the related software is embedded in other tools or is a standalone application.
• Plugin – Not all the presented tools were born to visualize semantic knowledge
bases. Then, some of them need additional plugins to achieve this task.
• Domain – This column contains the specific domain (if any) where the related
application can be applied.
• Reference – This column reports the reference number of the paper(s) describing
the tool.
Plus, additionally, other information about the entities that started the development of the tool, the license and the current status of the project.
1.2.2 AudioCommons Project
We will show in this Section an example of usage of the Semantic Web to foster infor-mation interoperability in an European Project called AudioCommons11(AC).
According to the project’s website, its goal is to bring Creative Commons audio
content to the creative industries. Therefore we will hereby discuss the development of a
tool (the AC Mediator) that promotes a synergy between web technologies and musical audio production and sharing services (i.e., the industry). While here such approach will support us in providing a common platform-methodology for audio sharing, enjoying and researching, in Section 2.2 the Semantic Web will be our starting point to implement from scratch a new concept of IoT connected to music.
Let us consider the following four online tools:
Jamendo12 Europeana13
Freesound14 Internet Archive15
11
The author was involved in the project in the context of a collaboration with the Centre for Digital Music at the Queen Mary University of London. Se also the Introduction for further references.
12 https://www.jamendo.com/
13 https://www.europeana.eu/portal/en 14 https://freesound.org/
With reference to AudioCommons, they are all interesting sources of audio (and a lot more!) material mostly stored with Creative Commons licenses16. The Internet Archive, for instance, is a non-profit library of millions of free books, movies, software, music,
websites, and more. Freesound, instead, targets only audio media into a collaborative
environment. Jamendo aims to bring together a worldwide community of independent
music, creating experience and value around it. Lastly, Europeana provides access to over 50 million digitized items - books, music, artworks and more.
By interacting with those services, consequently, end users are not only authorized, but also encouraged to search for contents and use them into their local projects. The Creative Commons license agreements regulate the rights of the users and the authors [93].
How to explore the databases? First of all, contents can be accessed in a very simple way from a regular web browser. Queries can be issued and their results can be examined and downloaded in a user-friendly interface requiring a manual approach. APIs are also available to perform this task.
While this is indeed a good result, it actually appears that a complete search implies a manual exploration of the query outputs coming from the four services separately. Ac-cording to [93], this required manual approach is one of the issues hindering the spread of freely accessible medias. In particular, it is possible to outline two main bottlenecks: (i)
incomplete and wrong metadata, as there is often a lack of proper annotation within
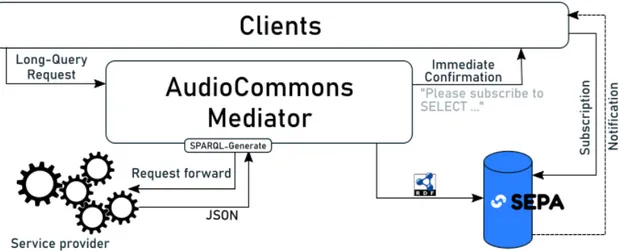
me-dias; (ii) incoherence among content providers data representation, e.g., it is not possible to access Jamendo’s database in the same way in which we access the Internet Archive. The former is due, for instance, to the author’s bad description of his own work (e.g., by choosing the wrong musical genre, by adding in the title unnecessary information, ...) [94]. The latter, instead, refers to the differences into specific implementation choices for every content provider, which are included into the APIs, authentication policies and output formats. As we said in Section 1.1, typically we have that query results may refer to the same type of content, but still are incompatible because they are presented in radically different ways: namely, the file format or tagging vocabulary inconsistencies. One of the main achievements of AudioCommons is the work on this specific vocab-ulary matching topic. The main question, therefore, would be: how to grant through a single query the access to the four services from a unique common endpoint, and still be able to compare results coherently? All this, clearly, looking to the future and creating a setup easily extendable with new features.
The first task to be addressed was the common interpretation of the results given by the content providers. This is a typical situation in which having a Semantic descrip-tion of the informadescrip-tion exchanged would have provided a direct soludescrip-tion. In this case, therefore, there is the need of aligning the vocabularies used by the four providers into a unique one which would then represent our real access point. This is the reason behind the AudioCommons Ontology [aco], developed by Ceriani et al. [95].
A complete and full description of the AC ontology is out of the scope of this Thesis. We focus, however, on the methodology to exploit it. Given that we have a shared

![Figure 1.2 – An example of semantic triple storing the information that the resource URI related to Jack Nicholson makes reference to an entity of type Person, as it is defined in [foaf] ontology.](https://thumb-eu.123doks.com/thumbv2/123dokorg/8080763.124402/21.892.290.666.156.232/example-semantic-information-resource-nicholson-reference-defined-ontology.webp)
![Figure 1.3 – Gephi [73] output example.](https://thumb-eu.123doks.com/thumbv2/123dokorg/8080763.124402/28.892.130.721.180.368/figure-gephi-output-example.webp)
![Figure 1.4 – To use LOD Live [79] a resource must be fixed. Then, the knowledge related to the resource can be expanded as shown](https://thumb-eu.123doks.com/thumbv2/123dokorg/8080763.124402/30.892.163.680.151.452/figure-live-resource-fixed-knowledge-related-resource-expanded.webp)
![Figure 1.5 – A portion of the DBpedia ontology visualized in Ontograf [80].](https://thumb-eu.123doks.com/thumbv2/123dokorg/8080763.124402/31.892.240.707.146.424/figure-portion-dbpedia-ontology-visualized-ontograf.webp)
![Figure 1.7 – Tarsier [69] user interface.](https://thumb-eu.123doks.com/thumbv2/123dokorg/8080763.124402/33.892.501.814.148.475/figure-tarsier-user-interface.webp)

![Figure 1.9 – SEPA internal setup, from [99].](https://thumb-eu.123doks.com/thumbv2/123dokorg/8080763.124402/40.892.111.719.156.554/figure-sepa-internal-setup-from.webp)