Does Fiscal Discipline towards Sub-national Governments
Affect Citizens’ Well-being? Evidence on Health
Abstract
This paper aims at assessing the impact on citizens’ well-being of fiscal discipline imposed by Central Government to sub-national governments. Since health care policies involve strategic interactions between different layers of governments in many different countries, we focus on a particular dimension of well-being, namely citizens’ health. We model fiscal discipline by considering sub-national governments expectations of future deficit bailouts from the Central Government. We then study how these bailout expectations affect the expenditure for health care policies carried out by decentralized governments. To investigate this issue, we separate efficient health spending from inefficiencies by estimating an input requirement frontier. This allow us to assess the effects of bailout expectations on both the structural component of health expenditure and its deviations from the ‘best practice’. The evidence from the 15 Italian Ordinary Statute Regions (observed from 1993 to 2006) points out that bailout expectations do not significantly influence the position of the frontier, thus do not affect citizens’ health. However, they appear to exert a remarkable impact on excess spending.
Keywords: Intergovernmental relationships, Soft budget constraint, Bailout expectations, Health care policy, Spending efficiency
1. Introduction
An important policy issue in decentralised settings is what the Central Government (CG) should do when lower level governments realise a deficit. In many instances, the CG bails out regional debts. Evidence on this point – sometimes referred to improperly as a sign of the softness of local budget constraints – is widespread. However, to avoid future deficits, a standard policy suggestion in this case is to adopt effective measures to harden the budget constraint of local governments. This is thought to increase accountability of local politicians, hence to increase social welfare by reducing future wastes. Hardening the budget constraint, however, is not always thought to be a good idea. For instance, Besfamille and Lockwood (2008) suggest that an hard budget constraint can induce local governments to avoid socially desirable investments. This reflects an usual claim by local governments: in their view, the occurrence of a deficit is the consequence of an inadequate amount of resources needed to finance the provision of public services, and not evidence of wastes. Restraining the budget constraint, will then imply a lower provision of public services, hence a lower level of social welfare.
The importance of this argument can be best understood when thinking to specific policies involving interactions between Central and local governments. One of these policies is surely health care. Assignment of health policy involve some actions by local governments almost everywhere (e.g., Saltman et al., 2007). In Federal countries (e.g., Canada, Australia) health policy is an exclusive responsibility of Regional Governments (RGs), although largely financed by federal government. In Regional countries (e.g., Italy, Spain) health policy is a joint responsibility of CG and RGs. In unitary countries (e.g., Nordic countries) there is a large role played by local governments in health policy. In all these cases, health expenditure stems from the interaction between different levels of government; and modern fiscal federalism theory suggests – in these cases – the likely presence of Soft Budget Constraint (SBC) problems: if CG cannot commit not to bail out over-expenditure at the local level, SBC problems might arise, and RGs have incentives to
inflate health expenditure, as they expect the residents of other jurisdictions to foot the bill (e.g., Kornai et al., 2003). Indeed, the presence of massive bailouts in the case of health care policy is recognised by a large literature (see, e.g., Kornai, 2009). There is also evidence – at least for Italy – that bailout expectations matter in inducing fiscal discipline. As Bordignon and Turati (2009) show, CG can influence regional health expenditure behaviour by adjusting health care funding, and RGs react by adjusting spending: RGs expectations of a tighter CG in terms of funding imply then a tighter control on health expenditure. But what is the effect of this effort by CG to harden the budget constraint of local governments? If the story about a welfare improvement in hardening the budget constraint is right, then – by imposing a tighter control on expenditure – CG is eliminating only inefficiencies, and this should produce any real effects in terms of services produced for citizens. If the story is incorrect, then hardening the budget constraint will imply a reduction of services produced and a deterioration of social welfare.
The aim of this paper is to provide an answer to this open question: does fiscal discipline affect structural (efficient) expenditure or simply inefficiency? In other words, does fiscal discipline towards sub-national governments has any real effects on citizens’ well-being, by influencing their health, e.g., via a reduction of the quantity or the quality of relevant health care services? Or it simply reduces the
waste of public resources, e.g., by rationalizing the existing hospital network1 or
improving service appropriateness? We assess inefficiency in public spending to produce citizens’ health, using several proxies for health status of regional populations in Italy, namely the average life expectancy at different ages and the infant mortality rate. We build on BordignonandTurati (2009,BT09fromnowon) to identify bailout expectations, and then test if only health expenditure inefficiencies, or also structuralexpenditure,are affected by fiscaldiscipline. In the
1 Capps et al. (2010) compare the impact on citizens’ welfare of hospitals closures versus hospitals
bailouts. Using U.S. data, they show that savings from closures of urban hospitals more than offset disutility for patients for increasing difficulties in accessing care services. As the authors point out, however, «the fact that reductions in hospital costs are shared between local and federal payers, while access issues are fully local, tilts the local community’s calculus in favor of bailout in several cases».
formercase, expectations affect waste; in the latter case, expectations affect citizens’
health. We find evidence supporting the idea that perceived fiscal discipline affects
only inefficiency, and does not have any real effects on citizens’ well-being.
Theremainderof the paper is structured as follows. Section2 brieflydescribes the intergovernmental relationships in the Italian National Health Service (NHS). Section 3 sketches a theoretical framework to guide the following empirical analysis, by borrowing results from the model developed by BT09. Section 4 describes the data, the empirical strategy, and the results, including a number of robustness checks. Section 5 provides concluding remarks.
2. Institutional framework: the Italian NHS
The Italian NHS – introduced by the Law 833 in 1978 – is a public universalistic scheme covering health care risks, and represents the central institution in the conduct of health care policy. Considering the time span covered by our sample, public health care spending in Italy reached 6.9% of GDP in 2006 from 6% at the beginning of the ‘90s, after touching a minimum of 5.2% in 1995, while per capita spending grew from about 870 euro in 1993 to 1700 euro in 2006. Even spending less than other comparable public systems2, the Italian NHS obtained good results in
terms of the (average) quality of services provided, and rank among the top positions according to international evaluations of the overall performance by the WHO (see, e.g., the World Health Report 2000).
The increase in spending has been paired with an improvement in the population health, one of the basic component of citizens’ well-being (e.g., Deaton, 2008). The average life expectancy at birth (ALE) and the infant mortality rate (IMR) are the proxy measures for public health commonly adopted in the literature (e.g., Turnock, 2007). ALE increased of about four additional years, from almost 80 (74) at the beginning of the ‘90s to more than 84 (78) in 2006, respectively for
2 For instance, in UK, Germany and France, public health care expenditure in 2006 was 7.3%, 8.1%
and 8.8% of GDP, respectively, while per capita values for the same countries were 2029, 2183 and 2317 euro, respectively.
females (males). IMR showed a steady decline, from 8.1‰ to 3.7‰. Figures 1 and 2 show the evolution of averages ALE and IMR in Italy over the years 1993-2006, which is the period considered in our analysis (see section 4.1). These figures compare with an increase in ALE of about two years, from 81 (75) in 1997 to 83 (77) in 2006 for females (males) in the EU16 countries, and a decrease in IMR from 6.8‰ (5.2‰) in 1997 to 4.7‰ (3.8‰) in 2006 in the EU27 (EU16) countries.3 Similar trends
characterize average life expectancy at different ages (see, e.g., Baltagi et al., 2012, who report trends of average life expectancy at age 65 for OECD countries over the period 1969-2007), and there is evidence suggesting that reduction in mortality following cardiovascular diseases or cancers (mainly driven by improvements in medical treatments) is crucial in explaining these numbers (e.g., Cutler et al., 2006).
[INSERT FIGURES 1-2 HERE]
Health policy in Italy stems from a complex network of institutional and political rules. The Constitutional mandate on health care (which dates back to 1948, and has been reformed in 2001) attributes to CG: 1) the definition and the guarantee of Essential Levels of Care (the so-called LEA, i.e., basically, national mandatory standards for health services); 2) the responsibility for framework legislation; 3) the ultimate responsibility for health care financing. Since its foundation in 1978, the funding of the Italian NHS followed (and still follows, at least to some extent) a sort of 3-stage process4. The first step is the ordinary funding:
the CG define in December, with the Budget Law for the following year, the ‘topping up’ on Regional revenues (a blend of earmarked taxes and tariffs). The second step is the redistribution among the Regions of these resources according to an ‘appropriation formula’, that involves also some bargaining between CG and RGs. Finally, the third step may be called extra-ordinary funding: the CG discretionally bails out RGs deficits, by deciding how much of the deficit cover and
3 Statistics for EU are included in EC Health indicators and are available at:
http://ec.europa.eu/health-eu/health_in_the_eu/ec_health_indicators/index_en.htm.
4 We consider here the funding of the 15 Ordinary Statute Regions only. Rules for the 5 Special
Statute Regions are largely different (see footnote 7 below). This is why these Regions are not included in the following empirical analysis.
when to intervene. Since RGs are uncertain on CG intervention when they take their decision on spending, expectations of future deficit bailouts influence present expenditure decisions, either affecting only inefficiencies or hitting also structural expenditure.
Indeed, according to Constitution, RGs are in charge of the expenditure task in the Italian NHS. In particular, they are entitled of: 1) the organisation and the provision of health services (e.g., the management of hospitals and Local Health Units); 2) the provision of additional services with respect to the mandatory national standards (LEA). As there are 15 Ordinary Statute Regions (plus 5 Special Statute Regions), even in the presence of these national mandatory standards, it is not surprising that there are territorial differences among RGs along several dimensions: per-capita spending, the organisation of health services provision (and associated inefficiencies), population health. Evidence on inefficiencies in the provision of health care services (which sometimes degenerate in genuine cases of corruption) are widespread in all RGs. If we take citizens’ satisfaction for medical assistance in hospitals as an indirect proof of inefficiencies, we obtain the situation depicted in Figure 3. With some exceptions, there seems to be a clear gradient in satisfaction from the North to the South of the country.
[INSERT FIGURE 3 HERE]
How expectations of future bailout can impact on this situation? As we will discuss in more details below, the recent Italian history suggests that CG has done its best to influence bailout expectations in the direction of hardening the budget constraint; and this action was effective during the ‘90s (BT09). What we study in this paper is whether hardening the budget constraint has had any real effects on citizens’ welfare, by worsening the provision of health care services, or it simply cut down the inefficiencies in health care services provision by RGs. To do so, we need both to ‘measure’ expectations in some ways, and to separate efficient from inefficient spending. We approach these two problems in turn.
3. Identifying bailout expectations
3.1. The ‘intergovernmental game’
In order to ‘measure’ expectations, in this section we briefly sketch a theoretical framework useful for the following empirical analysis. We borrow from BT09, that provide some fundamental predictions for our test on the effects of bailout expectations on citizens’ well-being. The authors consider a dynamic game with incomplete information; there are two players (here levels of government), a CG and a RG. The timing of the game strictly mirrors the relationships in the Italian NHS: at the first stage, CG finances RG, by choosing between two levels of funding (F), low or high, F= {FL, FH}, where FH>FL>0. At the second stage of the game, having
observed F, RG can then decide between two levels of expenditure (E), low or high,
E = {EL, EH}, where EH>EL>0. Notice that, if RG replies with the corresponding
level of expenditure to the funding decision of the CG, the regional budget is in equilibrium: (FH – EH) = (FL – EL) = 0, and the game ends here. In fact, assuming
RG cannot cash the difference between expenditure and funding implies that, if CG sets FH at the beginning of the game, then RG can only respond by setting EH. On
the contrary, when CG sets FL at the first stage of the game, RG can either react by
setting EL (and the game is again over), or by choosing EH and running a deficit. In
this case, it is again CG’s turn to move in the third stage of the game. It can either refuse to accommodate the deficit; or it can accommodate, partly or fully, this increased regional expenditure by giving more money to the region.
BT09 assume that: i) CG prefers low financing and low expenditure, both when the bailing out occurs and when it does not; ii) RG prefers high expenditure and high financing (and the sooner the better), but if it had to finance itself the deficit in the case of low financing, it would prefer to cut expenditure immediately;
iii) itisPareto-efficient toconstrain fundingandexpenditure at the lowlevel – hence
EL is the structural expenditure, i.e., the level of spending necessary to guarantee
citizens’ well-being, while [EH – EL] identifies spending inefficiency; iv) there are two
fiscal discipline towards sub-national governments, and will not bail out RG deficit. On the contrary, the ‘weak’ CG will easily indulge in bailouts. The type is a private information of CG, hence RG needs to form some expectations on CG type: RG expects to face a ‘tough’ CG with a positive probability p.
As shown by BT09, the Perfect Bayesian Equilibria of this game imply that: «a ‘weak’ CG can take advantage of RG uncertainty by mimicking the ‘tough’ type, since
– if it can convince RG that it is ‘tough’ – it might reach the Pareto-efficient outcome, i.e., a low level of funding coupled with a low level of expenditure, hence a situation without any deficits».5
From this result, the following testable implications can be derived:
(a) ceteris paribus, it should be more likely to observe a low level of ex-ante CG funding
FL when p is high than when p is low;
(b) having observed a low level of ex-ante funding FL, RG is more likely to react with a low level of health expenditure EL, when p is high than when p is low.
In other words, when the probability p to face a ‘tough’ CG is high, a low level of ex-ante funding is perceived as a more reliable signal that CG is indeed ‘tough’; therefore, RG reacts by choosing a low level of spending. Jointly considered, these two theoretical predictions suggest to investigate the effects of bailout expectations on RGs spending performance by testing the impact of ‘expected’ funding, i.e., ex-ante CG funding conditional to RGs expectations on p. The crucial empirical problem – to be discussed next – is how to find proper proxies for changes in p.
3.2. From the theory to the data
Changes in p mean a shift in bailout expectations, due to a strengthening of CG’s commitment technology: when it is more costly for CG itself to run deficits (due for instance to external constraints) and when there are new tools for RGs to respect their budget (for instance, because of larger tax bases, or an electoral system that increase the accountability of local politicians), then the probability to face a ‘tough’ CG increases. The problem is how to model this shift.
We follow here BT09 and exploit a ‘quasi-natural experiment’ in Italy. In particular, the link between theoretical model and observable variables is based on the consideration of key events in the Italian economic history starting from the ‘90s, and their potential impact on p. The list includes the following events:
• 1992: a severe financial crisis, determined by an unsustainable level of both public deficit and public debt, which lead the country close to default and opened the door to a season of reforms;
• 1993: a structural reform of the NHS, which introduced more autonomy for Local Health Units in charge of providing services to citizens, and separated the third party payer from hospitals (the providers of services), to create a quasi-market competition similar to the one experienced in the English NHS;
• 1994: a reform of the National voting system, with the aim of strengthening CG and its ability to implement reform and manage the public budget (notice that duration of government during the ‘80s was less than one year);
• 1995: a reform of the Regional voting system, with the aim of increasing the accountability of Regional Governors in charge of managing resources for health care (notice that approximately 80% on average of regional expenditures are for health care services);
• 1997: the ‘Maastricht test’, that is the provision of the Maastricht Treaty – ratified at the end of 1993 – to examine EU countries in order to define the first group of participants to the European monetary union (EMU) and the adoption of the Euro. The test was mainly based on two parameters of public finances sustainability, specifically the debt-to-GDP ratio < 60% and the deficit-to-GDP ratio < 3%;
• 1997: the introduction of a new regional tax (IRAP), aimed at reducing vertical imbalance, and at increasing regional accountability;
• 1998: the provisions of the Amsterdam Treaty (better known as the Stability and Growth Pact, SGP from now on), which define conditions for remaining in the EMU.
In particular, a close-to-zero deficit was required in the medium run; in any case, public deficit-to-GDP ratio cannot be more than 3%.6
Starting from the above list of key events, we define a set of proxies for changes in p, i.e. the probability to observe a ‘tough’ CG, defining a list of variables that should have had an impact on the commitment technology of CG. The proxies we use in the following empirical analysis are:
a) an index of Public Budget Tightness (PBT), defined as the ratio between the Italian deficit and the average EU deficit, to capture potential variations in the way external constraints are imposed. For instance, if all EU countries share the same fiscal difficulties, a political decision could be made to soften financial rules. Indeed, this is exactly what happened at the beginning of the new century with the rules imposed by the SGP;
b) a dummy to capture the effects of external constraints imposed by the Maastricht Treaty (DMAAS = 1 from 1994 to 1997);
c) a dummy for the 1997 EMU exam (DEUR = 1 in 1997), to capture the differential
impact of the ‘exam year’ with respect to the rules imposed by the Maastricht Treaty;
d) a dummy to capture the effects of external constraints imposed by the SGP (or Amsterdam Treaty, DAMST = 1 for the periods 1998-2003 and 2005-2006; notice that
we excluded 2004, because provisions by the SGP were suspended in that year); e) a proxy for the per capita tax base of regional taxes (TAXBASE), to capture the impact due to an increase in regional own resources registered during the sample period;
6 Differently from the Maastricht Treaty, the Stability and Growth Pact (SGP) has experienced
several difficulties: provisions have been suspended for some years, after fiscal crises affecting Germany and France. After this suspension, European Governments struggled to reach a new agreement. The newly reformed Pact contains provisions conditional on the public finance of each country and taking into account cyclical considerations, all of which suggest more politically oriented judgements than technical rules. Difficulties of the SGP came back again recently in the case of the Greek financial crisis and the European sovereign debts crisis. More on this point will be discussed below.
f) a dummy to control for ‘political alignment’ effects (DGOV = 1 if RG and CG
coalitions in power are the same), to capture the potential impact of friendly governments in terms of a more generous funding (when monies are available) or a more effective control on expenditure (when fiscal discipline is required).
Notice that proxies (a) to (d) show time variability only, while proxies (e) and (f) show both time and cross-section variability. This means that proxies (a) to (d), basically the rules imposed by the EU, affect all Regions contemporaneously and in the same way; on the contrary, proxies (e) and (f) affect different Regions in different ways. Hence, expectations are different for different Regions.
4. Empirical analysis
4.1. Data and empirical strategy
The empirical analysis is based on a balanced panel of the 15 Italian Ordinary Statute Regions over the years 1993-2006.7 The main source of data is the official
database Health for All managed by the Italian National Institute of Statistics (ISTAT), integrated with information extracted from the Supplements to the
Statistical Bulletin by the Bank of Italy, and the General Report on the Economic Situation of the Country (Relazione Generale sulla Situazione Economica del Paese)
by the Italian Ministry of the Economy. All financial variables are expressed in 2006 € per capita by using a CPI index.8
As for the empirical strategy, we consider the ‘substitution method’ suggested by BT09. The main objectives of the paper are: to test theoretical claim (b) that, after having observed a low level of ex-ante CG funding, RGs should be more
7 As already mentioned, we excluded from the analysis the five Special Statute Regions (Valle
d’Aosta, Trentino Alto Adige, Friuli Venezia Giulia, Sardegna, Sicilia), because the way they are financed and they can organise the provision of health services follows different rules. In particular, «they enjoy wider autonomy [in the choice to allocate CG funds], and also receive a higher than average share of government funding. In addition, their self-government rights extend to an additional number of policy areas, such as primary and secondary education, culture and arts and subsidies to industry, commerce and agriculture» (Rico and Cetani, 2001: p. 5).
8 A sector specific retail price index is unavailable. However, the use of a general CPI index seems
more appropriate, since most of the health care services are provided free of charge to citizens and the biggest expenditure share (personnel costs) varies according to the CPI index.
likely to react with a low spending level the higher is p; and, more importantly, to verify whether changes in p (i.e., in bailout expectations) impact the efficient component and/or the waste component of overall spending. Since CG funding is not exogenously given, but – according to the theoretical framework sketched above – depends itself on the commitment technology available for CG, we need to go along the following steps:
• we first check the effects of changes in p on ex-ante CG funding (FUNDST), by
estimating a model of funding which includes among the regressors the proxies for bailout expectations discussed above;
• we then get the ‘expected’ funding (i.e., the predicted ex-ante CG funding given changes in p) from first step estimates and insert this variable (EXPFUNDST) in a
properhealth production function/frontier;
• we finally check whether EXPFUNDST affects structural expenditure (hence,
citizens’ health) and/or inefficiency (hence, excess spending given a certain health output).
4.2. Modelling ex-ante central government funding
We define –differently from BT09–the variable FUNDST as the difference between total funding and regional funding. This is a measure of the ex-ante CG transfers per
capita to each Region, i.e. the topping up on regional own resources which constitutes the first step in regional health care funding. We then estimate the following CG funding model [1]:
FUNDSTit = a0 + a1TAXBASEit + a2PBTt + a3DGOVit + a4DEURt
+ a5DMAASt + a6DAMSTt + a7TRENDt +
∑
= 14 1 i i α REGi + εit [1] i = 1, ..., 15; t = 1993, ..., 2006where REG are individual fixed effects, to take into account structural differences in health spending needs across RGs, and TREND is a linear trend that captures the evolution of ex-ante CG funding linked to the dynamics of expenditure reflecting
technical progress in healthcaredelivery (see section4.3). Table1 reports descriptive statistics for all the variables included in Eq. [1].
[INSERT TABLES 1 AND 2 HERE]
Table 2 shows Fixed Effects (FE) estimates of ex-ante CG funding model [1].9
All proxies for changes in bailout expectations – but DGOV10 – are strongly
statistically significant and show a sign consistent with our a priori and previous findings by BT09. An increase in the tax base given to regions should increase their ability to cope autonomously with their deficits, and this should make more credible the threat by CG not to bail them out (hence, the coefficient of TAXBASE< 0). As Maastricht requirements become more binding, CG should be perceived as tougher (hence, the coefficient of DMAAS < 0), and this effect should be more important the
higher the Italian deficit with respect to the EU average (hence, the coefficient of PBT < 0), and the closer the deadline for the admission test to be included in the first group of countries adopting the Euro (hence, the coefficient of DEUR < 0). On
the other hand, the positive impact exerted on CG funding by the introduction of the SGP (coefficient of DMAAS > 0) may be explained by the weaknesses of the
Amsterdam Treaty in itself compared to the provisions of the Maastricht Treaty. These fragilities led European governments to perceive the threat of exclusion from the EMU as an unlikely event, and – in turn – brought RGs to increase their expectations of future bailouts by CG.11 Notice that our conclusions on the role
9 One may argue that also the stock of Regional governments debt influences bailout expectations.
The larger the debt (relative to regional resources), the higher the likelihood of default risk, and CG bailout. Regional debts data are only available for a shorter time span. Nevertheless, we tested for this effect but found no significant evidence, presumably because of the inclusion in the model of the time trend and the regional fixed effects. More importantly, almost all the results presented in this section are unaffected. Results from this additional specification are not reported here for brevity, but are available upon request from the authors.
10 Perhaps a ‘help out’ action by friendly Regions – aimed at cooperating with CG in controlling
public expenditure and deficit – was in place up to 1997, before the ‘Maastricht test’ (like in BT09), whilst an opposite effect prevailed from 1998, due to RGs expectations of a more ‘benevolent’ treatment in terms of ex-post funding by a friendly CG than by an adversary one. See Arulampalan et
al. (2009) for further discussion on this issue.
11 Notice that the possibility that some member states might in the future obtain back their monetary
played by our proxies for bailout expectations do not change considering robust standard errors to account for the presence of autocorrelation, which has been detected by the Wooldridge (2002) test. Most of the standard errors were indeed underestimated, but coefficients are so precisely identified that their statistical significance is unaffected (see MODEL B in table 2). All these results are robust also to
a different specification of the time trend. In particular, considering a more general cubic functional form as an alternative, the correlation of fitted values (the ‘expected’ funding EXPFUNDST) obtained from the two models with the different
trend is 0.99. Unsurprisingly, also results from the following spending frontier model are unaffected by the specification of the time trend. Hence, we decided not to include these estimates in the paper.12
[INSERT TABLE 3 HERE]
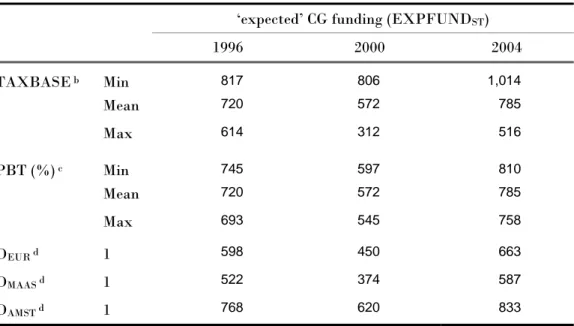
Overall, as it is suggested by theoretical prediction (a), we effectively observe a lower level of ex-ante CG funding when p is high than when p is low. This is true also on a different and longer time span with respect to the one considered by BT09, that was limited to the ‘90s only. Table 3 provides some insights on the quantitative impact of bailout expectations on ex-ante CG funding, by computing EXPFUNDST
at different values of our proxies for p and in different years: one can notice, in particular, the relatively modest effect exerted by PBT compared to TAXBASE (e.g., EXPFUNDST in 2004 ranges between 758 and 810 € per capita considering the
former variable, against 516–1,014 using the latter one), which highlights the importance of strengthening the fiscal autonomy of sub-national governments in order to reduce bailout expectations and CG transfers. Furthermore, the positive time dynamics (coefficient of TREND > 0), combined with a rise in bailout the absence of explicit provisions can be seen as a commitment device to increase stability. However, the increased stability can probably lower the expectations that penalties and automatic sanctions will be effectively applied in the case of fiscal crisis; and – in turn – soften the countries budget constraints. The example of Greece seems to provide evidence for this effect to be effectively at work.
12 Nonetheless, this set of results obtained substituting the linear trend with a cubic specification in
both the funding model [1] and the health spending frontier [2] are available upon request from the authors.
expectations due to weakened external constraints imposed by the Amsterdam Treaty, help explain the marked increase of EXPFUNDST observed starting from
the end of 90’s, compared to the previous years, when more severe fiscal rules for accessing EMU were in force (see Figure 6 below).
4.3. Modelling regional government spending 4.3.1. Model specification and estimation method
A crucial issue to understand whether bailout expectations affected structural health expenditure, or just impacted on inefficiencies and wastes, is the identification of the efficient and inefficient components of RGs spending for health care policies. To this aim, we assume that health care outcomes result from a standard microeconomic ‘production function’, where population health is the output, spending and other health-related variables are the inputs, and a process of optimization underlies the observed data.13
The bulk of previous studies assessing health systems’ performance assume maximization of health given a certain amount of expenditure as the objective to be pursued by the policy maker. However, considering the Italian context described above, the rapid growth in public health spending for all European countries in the last decades, the significantly higher health status compared to less developed contexts, and the role played by public finance constraints imposed by European rules, we assume here that the goal of RGs consists in minimizing the cost of providing a certain level of health output, given other inputs and a set of control variables. This issue can be addressed by modelling RGs spending behavior as an
input requirement function. This concept was first introduced by Diewert (1974), and
later extended by Kumbhakar and Hjalmarsson (1995) to incorporate inefficiency in
13 This is the approach commonly used to assess the performance of health care systems. Examples
from this strand of literature include, e.g., Grubaugh and Santerre (1994), Or (2000), Hollingsworth and Wildman (2002), Greene (2004), Retzlaff-Roberts et al. (2004), Afonso et al. (2005), Kumbhakar (2010).
the production process, i.e., the use of excess input compared to the optimal (minimum) need defined by a ‘best-practice’ frontier.14
The identification of a proper outcome for quantifying the impact of health care policies on well-being is a rather difficult issue, because the effectiveness of health services can be assessed by considering a variety of aspects (e.g., length and quality of life, equity in accessing the services, etc). According to most of the past studies on health systems’ efficiency and the literature on public health, we adopt two traditional measures of population health and proxy the output (Y) both as average life expectancy at birth (ALE) and infant mortality rate (IMR). Notice that in the following estimations, we use the inverse of the infant mortality rate (Y = 1/IMR), since this rescaling makes the output coefficient easier to interpret and compare with results for ALE. Moreover, we also experimented with average life expectancy at different ages, namely at 45 (ALE45) and at 75 (ALE75), to capture the
impact of public care on avoidable mortality due to illnesses typically affecting health around these lifetimes (e.g., cardiovascular diseases or cancers). 15
As for the basic inputs of health production process, per capita public and privatehealth care expenditure and average education level of the population have been typically used in the existing literature. Coherently, we define per capita RGs health spending (HPUB) as the dependent variable of the input requirement
14 For a comprehensive and critical review of the literature on production/cost frontier modelling and
efficiency measurement, see the handbooks by Kumbhakar and Lovell (2000) and Coelli et al. (2005).
15 The most recent contributions using ALE and/or IMR as measures of health outcomes include, e.g.,
Baltagi et al., 2012, Akkoyunlu et al., 2009, Hall and Jones, 2007, Papageorgiou et al., 2007, Crémieux
et al., 2005, Shaw et al., 2005. Life expectancy is the average number of years of life remaining at a
given age and, in the database Health for All, it is computed separately for men and women. Therefore, male and female life expectancies have been averaged by male and female populations, in order to obtain a single index. Infant mortality rate is given by the number of children who die during the first year of life per 1,000 newborns. It is worth noticing that other studies (e.g., Hollingsworth and Wildman, 2002; Gravelle et al., 2003; Greene, 2004; Kumbhakar, 2010) have measured health outcomes in terms of Disability Adjusted Life Expectancy (DALE), an indicator of healthy life expectancy which differs from ‘pure’ life expectancy or mortality indices in that it considers the quality of life besides its length. However, information on DALE disaggregated at regional level is just available for a couple of years.
function, and per capita private health spending (HPRIV) and the percentage of
people with higher education (EDUUNIV)16 as the other productive factors (INPUT).
In addition, we augment our specification with a set of control variables (CV) that are likely to generate possible shifts in the production relationship, both over time and across Regions.17 Specifically, we include: a time trend variable (TREND)
to take into account possible improvements in health care delivery over years due to technical change18; two demographic indicators, i.e., the share of males (MALE) and
of people older than 75 (OLD75), which are expected to exert a negative and positive impact, respectively, on the minimum level of HPUB required to attain a given level
of Y, ceteris paribus19; a variable accounting for the effect of bailout expectations,
i.e., EXPFUNDST obtained from estimates of Eq. [1] (the way we test whether this
factor is a shifter of the frontier or affects the inefficiency is discussed later); finally, given the wide variation in cultural and economic characteristics of our sample (especially between Northern and Southern Regions), which is likely to influence health policy outcomes, we incorporate individual fixed effects (REG) in our model, so as to control for unobserved heterogeneity across Regions. Table 4 shows summary statistics for all the variables included in the input requirement function. As will be clear below, both the dependent variable and the regressors show enough variation, both over time and across Regions, to allow identification of parameters even including regional fixed effects.20
16 This variable is computed as the share of persons with a university degree out of the total regional
population. We thank Anna Laura Mancini for kindly providing these data.
17 Or (2000), Gravelle et al. (2003) and Greene (2004) argued about the importance to enrich the basic
input-output relationship of the health production process, by adding further covariates able to account for some of the widespread heterogeneity that is usually present in this type of data.
18 As alreadyremarked in section 4.2, we also tried a moregeneral specification of the time trend. In
particular, we experimented with a cubic functional form – as in the first-stage funding equation – and the estimates of input requirement frontier, as well as the evidence about the role of bailout expectations, are substantially confirmed.
19 The importance of technological change and demographic factors such as age and gender is widely
debated in the empirical literature on health outcomes and spending determinants. See, e.g., Baltagi
et al. (2012), Hall and Jones (2007), Skinner and Staiger (2009), Chernichovsky and Markowitz (2004),
Moise (2003) and Jones (2002).
20 In particular, within variation is dominant for HPUB, ALE, 1/IMR, EDUUNIV and EXPFUNDST,
[INSERT TABLE 4 HERE]
Following Greene (2004, 2005b) and Or (2000), we adopt a simple Cobb-Douglas specification.21 The model (in logarithmic form) to be estimated is then:
lnHPUBit = b0 +b1lnYit +b2lnHPRIVit +b3lnEDUUNIVit + b7TRENDt
+b4lnMALEit+b5lnOLD75it + b6lnEXPFUNDSTit +
∑
= 14 1 i i β REGi +eit [2] i = 1, ..., 15; t = 1993, ..., 2006
which can be concisely rewritten as:
lnHPUBit = f(lnYit, lnINPUTit, lnCVit) + eit [3]
The residual term, eit, can be thought either 1) as pure random noise – like in a standard average function approach, not accounting for the presence of productive inefficiency in observed health spending – or 2) as a composed error term, resulting from the sum of idiosyncratic noise (vit) and a nonnegative inefficiency term (uit) –
like in a frontier function approach, where actual health spending is allowed to exceed theoptimal(minimum)requirement. Accordingto thelatter interpretation,a Region that is managing more efficiently the provision of health care will, ceteris
paribus, have a lower per capita expenditure, reflected in a lower value of uit. This
allows us to interpret exp(uit) = {HPUBit /exp[f(lnYit,lnINPUTit,lnCVit)+vit]} as the
percentage increase in health spending with respect to the stochastic ‘best-practice’ level, which is due to productive inefficiency. When uit = 0 for a particular Region i
in year t, all inefficiencies are eliminated and the ‘best-practice’ input requirement frontier is attained.22
21Inprinciple,theflexibletranslogform shouldbeusedtoapproximateatbestanarbitraryunderlying
function. However, due to the high multicollinearity among the regressors (which include interacted and squared terms) and the limited degrees of freedom, in past studies the translog specification often resulted in parameter estimates failing to satisfy some of the basic properties of production theory. Therefore, as remarked by Greene (2004, p. 968), a strictly orthodox interpretation of the relationship between the health outcomes and the inputs as perfectly conforming to a neoclassical production function is likely to be optimistic, and the use of looser approximations is then justified.
Starting from these premises, we proceed with the estimation of three different version of the input requirement model [2]:
• an average health spending function, where our key variable EXPFUNDST appears
as an explicative factor for the whole HPUB – without distinguishing the efficient (or
structural) component from the inefficient one – thus, closely mirroring BT09. In this case, the residual is assumed to be a symmetric normally distributed random variable, eit ~ N(0,σe2);
• two frontier health spending functions, in which eit = (vit + uit), with vit ~ N(0,σv2)
and uit ~ |N(μ,σu2)|, to indicate that inefficiency term is modelled as the absolute
value of a normally distributed random variable.23 In order to test whether or not
bailout expectations influences excess spending, we follow the standard Battese and Coelli (1995) specification and allow the mean of the inefficiency to depend on EXPFUNDST,by assuming that μ is free to vary both across RGs and over years
according to the expression:
it
μ = δ0 + δllnEXPFUNDSTit [4]
Moreover, to provide an answer to the key question of our study – i.e., whether bailout expectations affect only productive inefficiency or also the structural component of health spending (the location of the frontier) – we first include EXPFUNDST in the vector of control variables CV of Eq. [3] (FULL MODEL) and, in a
second frontier specification (RESTRICTED MODEL), we exclude it from CV (setting b6
= 0 in Eq.[2]). Then, we use a standard LR test for selecting the best specification. In both cases, Maximum Likelihood (ML) is employed for the simultaneous estimation of the stochastic frontier parameters [3] and the spending inefficiency equation [4]. The log-likelihood function is formulated in terms of σ2 ≡(σv2 + σu2)
23 This assumption means that uit arises from the truncation (at zero) of a normal distribution with
mean μ and variance σu2 and can also be expressed as u
it ~ N+(μ,σu2). On truncated normal
and γ ≡σu2/(σv2 + σu2).24 The parameter γ must lie between 0 and 1 and provides
useful information on the relative contribution of uit and vit to the global residual eit, hence on the importance of estimating a ‘best-practice’ frontier instead of an average input requirement function to separate inefficiencies from structural spending.25 It is
important to highlight that adding the full set of regional dummies REG in the vector CV corresponds to implementing the ‘true’ fixed effects ML frontier model proposed by Greene (2004, 2005a,b), which has the virtue to allow a distinction between the unobserved cross-regional heterogeneity, unrelated to inefficiency, and the inefficiency itself.26
4.3.2. Results from the ‘average’ health spending function
FE estimates of Eq. [3] are reported in table 5. The within-R2 indicates that our
model accounts for about 90% of the variability observed in public health care expenditure. The F statistic confirms the general goodness of fit. All the coefficients for output, inputs, time trend and demographic variables are found to be statistically significant and their magnitude is quite similar for the two model specifications using alternative output measures for health care policies (ALE, 1/IMR)27. Furthermore, a test for the joint significance of all regional dummies
supports the inclusion of individual effects in the model to control for any
24 The prediction of inefficiencies exp(uit) depends on all the parameters of the model and exploits the
BatteseandCoelli(1995) estimator. See also Kumbhakar and Lowell (2000), p. 78.
25 As γ →0, the symmetric noise component dominates the one-sided inefficiency term in determining
the variation of total residual eit, while the inverse occurs as γ →1. Notice that, in the former case, we
are back to a traditional average spending model with no stochastic inefficiency, whereas in the latter case we face a deterministic frontier spending model with no random noise.
26 A possible criticism against the use of fixed effects in nonlinear models is the incidental parameters
problem (Lancaster, 2000), a persistent bias that typically arises in short panels. However, existing evidence in support of this view is all based on binary choice models, whereas Greene (2005a,b), relying on Monte Carlo simulations applied to stochastic frontier models, found that the biases in coefficient estimates are small and, more importantly, there appear to be only minor biases transmitted to inefficiency estimates.
27 Results obtained proxying health with ALE45 and ALE75 are not reported here for brevity and are
available upon request from the authors. However, they are substantially close (also in terms of magnitudes) to those discussed in the text, both for the ‘average’ spending function and for the ‘frontier’ model.
unmeasured cross-regional heterogeneity.28 As expected, HPUB increases with the
targeted output, while it shows a certain degree of substitutability with private health spending and with higher education. The latter result can be explained by the fact that higher educated people do more prevention, demand more preventive care, using non-medical inputs and leading healthier lifestyles, so as to become more efficient users of care and producers of health; thus, ceteris paribus, the effect of rising EDUUNIV is to reduce the aggregate costs for health care.29
[INSERT TABLE 5 HERE]
The positive coefficient of TREND shows that RGs health spending increases at an annual rate of about 3-4%. To some extent, this growth over time of HPUB is
due to changes in medical technology, implying better and more costly treatments.30
As for the impact of demographic factors, the negative coefficient of MALE indicates that females are more likely to visit health providers than males31;
moreover, the positive effect of POP75 confirms that a rise in the share of the elderly out of total population tends to cause higher health costs, because of the increased incidence of chronic diseases, as well as the closer proximity to death.32
Turning now the attention to the impact of bailout expectations on spending performance of RGs health care policies, EXPFUNDST coefficient has the expected
positive sign and it is statistically significant and similar in magnitude using both output specifications: it suggests that, ceteris paribus, a 10% increase (decrease) in
28 Thestatisticalsignificance of thecoefficients still holds whencontrolling forpossible autocorrelation
in the residuals, by using robust standard errors. Notice, however, that we cannot perform a similar control in the frontier analysis presented in the next section, since an econometric model accounting for autocorrelation is not available.
29 For further discussion on this issue, see Chernichovsky and Markowitz (2004) and Kumbhakar
(2010).
30 A similar finding has been obtained in a recent study on Swiss health care system by Filippini et al.
(2006). In general, technical progress is considered an essential factor in rising health care costs (see Newhouse, 1992, and the studies quoted in the footnote 19).
31 In particular, Chernichovsky and Markowitz (2004) point to a remarkable increase in the number of
visits to doctors and specialists by females between 25 and 64 year old, and in the number of visits to nurses by females between 25 and 44 year old.
32 Evidence supporting this view is found, among others, in Giannoni and Hitiris (2002), Seshamani
and Gray (2004), and Filippini et al. (2006). See also Zweifel et al. (1999) for a discussion on the ‘death related costs’.
‘expected’ CG funding brings about roughly a 0.65% increase (decrease) in public health spending used by RGs to guarantee a certain outcome in terms of average life expectancy or infant mortality. For instance, looking at sample means of ‘expected’ CG funding and RGs health spending, when EXPFUNDST diminishes from 798 to
718 € per capita, HPUB reduces from 1,360 to 1,351 € per capita.33 Hence, relying on
a different modeling approach (i.e., the input requirement function) and a longer time span, we find again the result in BT09, which suggests that RGs react to expectations of a tighter CG in terms of funding with a tighter control on health care expenditure. What we do not know yet is whether this effort by the CG to harden the budget constraint of RGs affects the structural component of health spending – implying some real effects on citizens’ well-being – or it simply reduces the
inefficiencies in health spending.34 To answer this challenging question, we estimate
a frontier input requirement model, which allows us to disentangle the influence of bailout expectations from the two components of RGs health spending.
4.3.3. Results from the ‘frontier’ health spending function
ML estimates for parameters of the stochastic frontier model defined by Eq. [3]-[4] are given in tables 6 (FULL MODEL) and 7 (RESTRICTED MODEL). In particular, the
upper panel in each table shows the estimates of structural coefficients, which determine the location of the input requirement frontier, while the lower panel reports the estimates of the inefficiency-related coefficients (δ0 and δ1 in Eq. [4]) and
of the two variance parameters (γ and σ2).
[INSERT TABLES 6 AND 7 HERE]
33 Like in BT09, the effect of bailoutexpectations mayseemmodest.However, recall that we are
controlling here for regional fixed-effects.
34 It is worth noting that the output indicators we adopt do not allow to control for the ‘quality’ of
health outcomes. Therefore, an increase observed in public spending devoted to guarantee a given output level (ALE or 1/IMR) can be associated to an improvement of citizens’ well-being (e.g., by rising the quality of some relevant health services, with a real impact on the quality of life), as well as to a waste of resources (e.g., by providing inappropriate services, which clearly implies no real effects on well-being). However, data on DALE are not available for Italian regions. See footnote 15 above.
Looking first at the FULL MODEL specification – where EXPFUNDST is
includedboth as a shifter of the frontier (lnHPUB) and as a determinant of excess
spending (uit), the coefficients related to output, inputs, time trend and demographic
variables are all statistically significant, using both output measures, and their magnitude is very close to the estimates obtained for the average input requirement function. As before, regionaldummies (not reported in tables 6 and 7 for brevity) are jointly significant, confirming the importance of including individual effects. The null hypotheses that spending inefficiency effects are absent (i.e., γ = δ0 = δ1 = 0,
hence uit = 0) is tested using a generalized LR test, and it is rejected at the 1%
significance level (5% if Y = 1/IMR).35 We can also notice that the estimate for γ is
0.672 (0.570 if Y = 1/IMR): this result indicates that most of the residual variation is due to spending inefficiency and not to random noise, therefore supporting the argument that a traditional average function with the term uit equal to zero does not
adequately represent the observed performances of RGs health care policies.
The picture relative to the estimates of structural coefficients, as well as of the variance parameter γ, is substantially unchanged for the RESTRICTED MODEL
specification – where EXPFUNDST is omitted from the frontier (b6 = 0), while it is
still playing a role as an inefficiency determinant. As table 6 shows, EXPFUNDST
exerts a positive but not statistically significant impact on RGs health spending if included as a structural variable (the p-value for b6 is 0.49 if Y = ALE, 0.34 if Y =
1/IMR), whereas its associated coefficient δl appears always highly significant when
bailout expectations are assumed to influence excess spending (at 1% level if Y = ALE, 5% if Y = 1/IMR), both in the restricted and full specifications. Thus, as these are two nested models, we compare the full specification of the frontier input requirement function against the restricted model by means of a standard LR test:
35 Notice that difficulties arise in testing hypotheseswhereγ isequal to 0, asγ=0 lies ontheboundary
of the parameter space for γ, and it cannot take negative values. In all these cases, if the null hypothesis is true, the LR statistic has an asymptotic distribution which is a mixture of χ2
as we find no evidence to reject the RESTRICTED MODEL36, we are allowed to conclude
that bailout expectations do not significantly affect the position of the ‘best-practice’ frontier (hence, they should not influence citizens’ well-being), while they seem to have a remarkable impact on spending inefficiency. The following comments, which discuss more in depth inefficiency estimates and the roleplayedby EXPFUNDST, relythenontheresultsfromthe restrictedspecification (table 7).
[INSERT TABLES 8 AND 9 HERE]
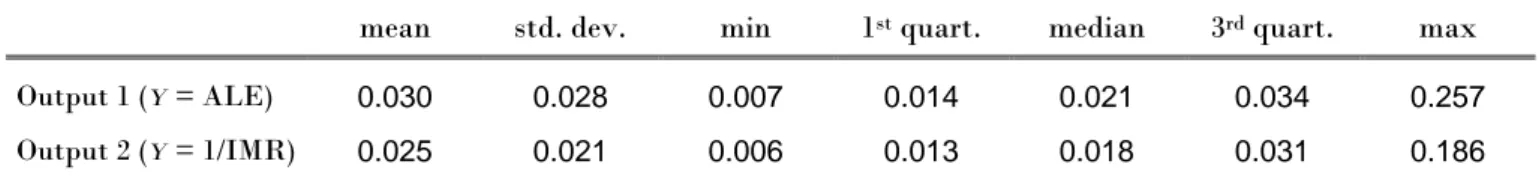
Table 8 provides summary statistics for estimated inefficiencies.37 Excess
spending ranges between 0.7% if Y = ALE (0.6% if Y = 1/IMR) and 25.7% (18.6%), and average cost inefficiency is found to be 3% (2.5%).38 Considering the sample
mean value of HPUB (1,360 €), this implies that RGs could reduce their health
spending by 40 € per capita (34 € if Y = 1/IMR) by taking care of all the wastes in health services delivery.39 Since our primary concern here are the effects of
expectations of deficit bailout by CG – assessed by looking at ‘expected’ CG funding – table 9 shows the values of average inefficiency computed within different classes ofEXPFUNDSTdefinedby thefollowingranges: min-1st quartile,1st quartile-median,
median-3rd quartile, 3rdquartile-max. The positive impact of bailout expectations on
excess spending is highlighted by the more-than-proportional increase of average cost inefficiency with the growth of EXPFUNDST: when EXPFUNDST raise from a low
(412 € per capita, on average) to a high level (1,194 € per capita, on average), we observe cost inefficiencies to augment from 1% to about 6% if Y = ALE (5% if Y =
36 The p-value for the LR statistic is 0.517 if Y = ALE and 0.273 if Y = 1/IMR.
37 Estimates of spending inefficiency for each RG in each year are reported in tables A1-A2 in the
working paper version of this work. Notice that (average) regional inefficiencies are negatively related with the perceived quality of care services, thus confirming our claim of citizens’ satisfaction as an indirect proof of wastes (Figure 3).
38 The quite low values of spending inefficency may be due to a second potential issue concerning the
use of the ‘true’ fixed effects model, i.e., the possibility that the inefficiency terms are underestimated. Indeed, if there is some region-specific persistent inefficiency, it is absorbed by the regional dummy included in the frontier, which is also capturing any time invariant heterogeneity. Unfortunately, as remarked by Greene (2004, p. 964), there is no simple solution to this problem, since the blending of inefficiency and unobserved heterogeneity is intrinsic to this modelling approach.
39 GiventhetotalItalianpopulationof60,045,068inhabitantsin 2008,thisaverageefficiencyrecovery
on per capita health spending would amount to an aggregate saving of about 2.5 billions € (2 billions € if Y = 1/IMR).
1/IMR). Figures 4-8 provide further evidence in support of increasing excess spending for increasing levels of ‘expected’ CG funding. In particular, the yearly trend of average cost inefficiency (computed using both output indicators) and EXPFUNDST suggests that fiscal discipline by CG towards RGs was effective in
containing wastes during the mid ‘90s, when more severe rules for accessing EMU were in force. Starting from the end of the ‘90s, however, ex-ante CG funding –
conditional to RGs expectations on p – began again to increase permanently, to some
extent because of the weaker external constraints imposed by the SGP; with this growth of ‘expected’ CG funding, also health spending inefficiency sharply augmented.
[INSERT FIGURES 4-8 HERE]
Taken together, these findings are strongly in favour of the idea that lower bailout expectations, due to a more severe fiscal discipline by CG, have an influence only on regional excess spending, and have no real effects on citizens’ well-being. Therefore, enforcing fiscal discipline towards sub-national governments is expected to result in welfare improvements.
4.3.4. Robustness checks: alternative specifications of the ‘frontier’ health spending function
How robust are the above results to alternative specifications of the ‘frontier’ health spending function? In this section we explore three different critical issues that might affect our conclusions. The first is the likely endogeneity of the private health spending (HPRIV). The bias in estimated coefficient could bring us to inaccurately
identify inefficient spending, hence the role played by bailout expectations. Fiscal discipline in richer regions can originate a reduction of public spending matched by a corresponding increase in private spending that might not be observed in poorer regions. This will have different consequences in terms of population health, that can be mistakenly attributed to inefficiency. To tackle this concern we define the variable Total Health Spending (THS) as the sum of both public and private health
spending, and re-estimate our frontier model [2] considering this new dependent variable and excluding HPRIV from the set of regressors. Summary statistics for this
and the other variables used in this section are shown in table 10. Results reported in tables 11 and 12 substantially confirms our story, both considering ALE and 1/IMR as outputs. In fact, according to LR tests (FULL vs. RESTRICTED MODEL), we find
again no evidence to reject the RESTRICTED MODEL.40Thus, also for this alternative
specification of the input requirement frontier, bailout expectations do not significantly affect the position of the ‘best-practice’ frontier, while they seem to have a remarkable impact on spending inefficiency, that is now about 3.7% on average with both output indicators.
[INSERT TABLES 10-11-12 HERE]
The second issue we consider here is the relationship between current spending and our measures of health. One may wonder whether life expectancy and the infant mortality rate really react to transitory changes in current expenditure. In particular, one may think that cutting funding today may not produce any effects until many years in the future (see, e.g., the results in Baltagi et al., 2012). Again, this dynamic relation between spending and health impacts on the correct identification of inefficiency, possibly biasing our conclusions. However, while changes in current spending might not affect contemporaneously population health, they have clear effects on ‘intermediate’ outputs produced by regional health care systems, like hospital services. Hence, fiscal discipline could affect population health via its impact on these ‘intermediate’ outputs in the production of health: regions might cut services to citizens instead of reducing inefficiencies, and this will eventually influence ALE and IMR. To check whether this is the case, we substitute our measures of population health with variables accounting for the services produced by regional health care systems (basically, ‘intermediate’ outputs in the production of health). To account for the largest possible share of health spending, again in order to avoid obtaining biased estimates of inefficiency, we consider in
particular: the total number of inpatient days (INDAYS) and outpatient visits (OUTDAYS), to proxy for the supply of hospital services; the total number of prescriptions for 100 inhabitants (DRUGS) to proxy for the supply of territorial services; in the attempt to account also for the quality of provided services, we include in the model a more quality-related variable measuring the percentage of individuals very satisfied with health care services (SATISF). These four variables are available only for the sub-period 1998-2006 in the latest release (December 2011) of the Health for All data, thus the panel used in the estimation reduces to 135 observations. Coefficient estimates of this model with ‘intermediate’ outputs are in table 13. Also in this case our claim is largely supported by the data. All coefficients for the ‘intermediate’ outputs (but for OUTDAYS) are positive and statistically significant at the usual confidence levels. More important, our proxy for bailout expectations significantly impacts on the inefficient spending only.41
[INSERT TABLE 13 HERE]
A final possible critique is that our baseline model includes fixed effects in the frontier, but some residual heterogeneity remains in the inefficiency term uit (see the
argument in the footnote 38 and figures 4 and 5, which reveal a pattern of spending inefficiency consistentwiththepresence of cross-regionalheterogeneity). Andbailout expectations might not be the only variable affecting inefficiency. In particular, a higher level of ex-ante funding in areas with poor outcomes could truly reflect a deliberate policy by the CG redistributing resources to those poor areas that have particularly intractable health outcomes. This possibility goes against the causal argument in our analysis which interprets the estimated effect of EXPFUNDST in
thecontext of astrongerfiscal discipline rather than unmet needs. One possibility to account for the potential role played by unmet needs is to include – besides EXPFUNDST – a measure of specific illnesses as an additional determinant of uit.
We then re-estimate our baseline input requirement frontier [2] adding the number of malignant tumors (per 1,000 inhabitants) in the specification of Eq. [4]. This new
variable(UNEED)isusedasaproxy ofunmetneeds, sincetumorsgainedimportance as determinants of mortality rates and are diseases particularly difficult and costly to treat in terms of resources absorbed. The estimates of input requirement frontier and the evidence on the role of bailout expectations in affecting structural spending and the inefficiency are substantially confirmed also in this case, using both ALE and 1/IMR as health outcomes (see tables 14 and 15).42 Interestingly, the increase in
needs is associated with a lower spending inefficiency (the sign of the coefficient for UNEED is negative and statistically significant in all estimated models), thus implying that the resources seem to be better allocated in those regions with health diseases particularly difficult to treat.
[INSERT TABLES 14 AND 15 HERE] 5. Concluding remarks
This paper investigates whether fiscal discipline towards sub-national governments, in order to harden their budget constraints, exerts any real effects on the well-being of the citizens or simply helps to reduce waste of public monies. We consider the provision of health care services by Italian Regions, a policy resulting from a complex net of intergovernmental relations and that can strongly influence citizens’ welfare. We propose here to separate the efficient (or structural) component of regional health spending from the inefficient one (the excess spending), by estimating a frontier input requirement function. This modelling approach allows us to check whether bailout expectations – used as an indicator of the effort put forward by Central Government to induce fiscal discipline in sub-national Regional Governments – influence only spending inefficiencies or they have any real effects on citizens’ health.
Our empirical analysis provides at least two interesting findings: first, there is evidence confirming that ex-ante Central Government funding is heavily affected by
42 The p-value for the LR statistic of the test FULL vs. RESTRICTED MODEL is 0.387 if Y = ALE and
0.320 if Y = 1/IMR.
bailout expectations, and this suggests that Central Government can enforce fiscal discipline towards sub-national governments by fixing the level of funding. Second, and more important, controlling for other relevant inputs in the production of health (private health expenditure and education) and for environmental factors (demographic structure of the population, technological change, and region-specific individualeffects), ‘expected’funding (i.e., CentralGovernmenttransfersconditional on expectations of deficit bailouts) influences only the inefficient component of Regional Governments spending. This result is robust to different perturbations of the empirical model, tackling the potential endogeneity of private health spending, as well as the role of ‘intermediate’ outputs (quantityandquality of provided health care services) in the production of final health status, and the likely presence of cross-regional heterogeneity in unmet needs which may affect spending inefficiency. Fiscal discipline appears then effective in reducing wastes, without having any real effect on citizens’ health, one of the main facets of individual well-being. Whether
this matters also for other welfare sectors (e.g., social assistance, education), and for other countries where these policies are decentralised towards sub-national
References
Akkoyunlu S., Lichtenberg F., Siliverstovs B., Zweifel P. (2009), “Spurious correlation in estimation of the health production function: a note”, Economics
Bulletin, 30(3), 2505–2514.
Afonso A., Schuknecht L. and Tanzi V. (2005), “Public sector efficiency: an international comparison”, Public Choice, 123(3), 321–347.
Arulampalan W., Dasgupta S., Dhillon A. and Dutta B. (2009), “Electoral goals and centre-state transfers: a theoretical model and empirical evidence from India”,
Journal of Development Economics, 88, 103–119.
Baltagi B., Moscone F. and Tosetti E. (2012), “Medical technology and the production of health care”, Empirical Economics, 42(2), 395-411.
Barankay I. and Lockwood B. (2007), “Decentralization and the productive efficiency of government: Evidence from Swiss cantons”, Journal of Public
Economics, 91 (5-6), 1197-1218.
Battese G.E. and Coelli T.J. (1995), “A model for technical inefficiency effects in a stochastic frontier production function for panel data”, Empirical Economics, 20, 325–232.
Besfamille M. and Lockwood B. (2008), “Bailouts in federations: is a hard budget constraint always best?”, International Economic Review, 49(2), 577–593.
Bordignon M. and Brusco S. (2001), “Optimal secession rules”, European Economic
Review, 45, 1811–1834.
Bordignon M. and Turati G. (2009), “Bailing out expectations and public health expenditure”, Journal of Health Economics, 28, 305–321.
Capps C., Dranove D. and Lindrooth R.C. (2010), “Hospital closure and economic efficiency”, Journal of Health Economics, 29, 87-109.
Chernichovsky D. and Markowitz S. (2004), “Ageing and aggregate costs of medical care: conceptual and policy issues”, Health Economics, 13, 543–562.
![Table 2. FE estimates of ex-ante CG funding model [1]](https://thumb-eu.123doks.com/thumbv2/123dokorg/8323806.132145/35.892.100.857.164.558/table-fe-estimates-ex-ante-cg-funding-model.webp)
![Table 5. FE estimates of average input requirement function [2]](https://thumb-eu.123doks.com/thumbv2/123dokorg/8323806.132145/38.892.136.772.155.505/table-fe-estimates-of-average-input-requirement-function.webp)
![Table 6. ML estimates of frontier input requirement function [2] – FULL MODEL Output 1 ( Y = ALE) Output 2 ( Y = 1/IMR)](https://thumb-eu.123doks.com/thumbv2/123dokorg/8323806.132145/39.892.137.776.151.648/table-estimates-frontier-requirement-function-model-output-output.webp)
![Table 7. ML estimates of frontier input requirement function [2] – RESTRICTED MODEL Output 1 ( Y = ALE) Output 2 ( Y = 1/IMR)](https://thumb-eu.123doks.com/thumbv2/123dokorg/8323806.132145/40.892.138.770.152.617/table-estimates-frontier-requirement-function-restricted-output-output.webp)
![Table 12. ML estimates of frontier input requirement function [2] with THS – RESTRICTED MODEL](https://thumb-eu.123doks.com/thumbv2/123dokorg/8323806.132145/44.892.137.772.173.609/table-estimates-frontier-input-requirement-function-restricted-model.webp)
![Table 13. ML estimates of frontier input requirement function [2] with THS and intermediate output indicators](https://thumb-eu.123doks.com/thumbv2/123dokorg/8323806.132145/45.892.132.767.179.740/table-estimates-frontier-requirement-function-intermediate-output-indicators.webp)
![Table 14. ML estimates of frontier input requirement function [2] with UNEED included among the inefficiency determinants – FULL MODEL](https://thumb-eu.123doks.com/thumbv2/123dokorg/8323806.132145/46.892.123.796.172.684/table-estimates-frontier-requirement-function-included-inefficiency-determinants.webp)
![Table 15. ML estimates of frontier input requirement function [2] with UNEED included among the inefficiency determinants – RESTRICTED MODEL](https://thumb-eu.123doks.com/thumbv2/123dokorg/8323806.132145/47.892.121.793.177.663/estimates-frontier-requirement-function-included-inefficiency-determinants-restricted.webp)
