OPERATIONS MANAGEMENT TECHNIQUES
FOR RESOURCE OPTIMIZATION
IN HEALTH CARE STRUCTURES
Stefania Tattoni, Diana Giannico, Massimiliano M. SchiraldiDepartment of Enterprise Engineering, University of Rome “Tor Vergata”, Rome, Italy (correspondence author: [email protected] )
Abstract: this paper focuses on the identification of improvement opportunities through process analysis inside sanitary services, and the case of the radiology department of a primary public hospital in Rome is reported. At first, an exhaustive study of the internal processes in the analysed department was performed in order to identify bottlenecks and service level loss causes. Secondly, in order to gain a better resource exploitation and to increase the department productivity, a method for optimizing resource management through patient scheduling and shift management was identified: patients have been divided among inpatients (already hospitalized) and outpatients (who are admitted to the hospital just for the exam and do not require an overnight stay) and a higher resource utilization has been reached leveraging on a flexible management of the formers preparation. Moreover, service lead times have been analysed with reference to patient characteristics and exam typology and, basing on the classification of exams, the patient scheduling is solved with a linear programming approach. The methodology does not include the application of state-of-art Operations Management techniques and, for an industrial context, it may appear extremely simple; however, as far as the optimization of sanitary services is concerned, the adoption of the described criteria has demonstrated that increases in service capacity and reductions of the overtime for physicians and nurses are easily reachable. This analysis has anyway required an appropriate statistical investigation on time variability per each exam typology in the radiology department on top of a deep understanding of the several complex processes inside the hospital system. The criteria can be straightforward extended to different departments, or applied in the radiology departments of other hospitals for a comparative analysis, as is already planned for the next step of the research.
Keywords: Hospital efficiency, health care service level, resource management
1. Introduction to Operations Management techniques potentialities in sanitary services
Over the last 20 years, the healthcare service management – in public hospitals in particular – has undergone a renewal process aiming at cost reduction and customer service quality improvement. Medical innovations, technologies development and patient increased expectations on top of reduced government subsidies are some of the elements which have to be taken into account whenever it is necessary to make decisions on how to provide the most effective health care services using limited resources available and on how to priorities them. Literature on this field is quite extensive and assorted; indeed it can be clustered into two main categories: health care planning/organizing and health care delivery category (Brandeau, Sainfort, & Pierskalla, 2004). Inside the healthcare planning/organizing category, all the high level problems regarding policy makers and the economics of health care systems (e.g. the strategic allocation of health care resources, determination of price limits and
funds for services, definition of public policies) are treated, whereas all the decisions on health care operations management and clinical practice belong to the healthcare delivery.
Generally speaking, the health care systems undertake the challenge of dealing with increased healthcare costs thus cutting expenses without allowing service level reductions to patients. In this context, also the Italian National healthcare system is facing several changes under institutional, structural and organizational point of view. Healthcare costs increase pushed modifications of the legislative framework, and the 90’s reforms (D.Lgs. 502/92 and D.Lgs. 229/99) forced all the public structures to set up juridical and managerial autonomy so that they started to enter a business logic with payments for services and budgetary control. In this sense, hospital care processes are becoming more complex than industrial processes or many other kind of business service organizations, due to the fact that the decision making does not follow a standard, logical process: the goals are unclear because it is difficult to determine priority among clinical mission, financial and
economical targets, social goals. The organization is complex because relationships are often ambiguous and bureaucracies originating from the public administration control system make difficult to take important decisions. Most of the costs of care are being driven by concentration on diseases and treatments in a specialized way, rather than in a integrative and comprehensive care approach (Porter and Teisberg, 2006). Hence, a practical experience with a case analysis may surely represent a fundamental point of reference in order to understand the potentialities or the limits that Operations Management (OM) approaches may express inside hospital care processes. On top of a persuasive leadership and a great commitment, in order to obtain the acceptance of the proposed changes, we assert that the competences on analytic methods and scientific frameworks can make the difference when an hospital manager’s priority becomes the search for efficiency or effectiveness.
In Europe, several projects have demonstrated the potentialities of the application of an industrial approach to sanitary services, obtaining results in the analysis of patient care process (Davies e Walley, 2000), efficiency improvement (Rotondi et al., 1997, Vissers et al., 2001, Karvonen et al., 2004) and scarce resources management (Helsinki University of Technology, 2008). Actually, in 1995 Roth and Van Dierdonck developed even an hospital resource planning tool based on MRP (Material Requirement Planning) logic and, later in 2001, Vissers, Bertrand, and de Vries elaborated a hierarchical planning framework for production planning and control in hospitals. In spite of these positive experiences, the adoption of operations management techniques in healthcare systems still suffer from the absence of standard reference models for the functioning of the different medical departments, except for two recent frameworks: the Patient Clinical Pathways and the Diagnosis Related Groups systems. As far as medical treatments are concerned, the Patient Clinical Pathways are nowadays candidate to represent a standard classification for the most important pathology therapies; these report which activities and how many resources are needed for each medical phase. The patient clinical pathway can be compared with the manufacturing technological cycle: the information linked to patient flow allows us to compute real needs in terms of resources, structures, materials, medicines, etc, to point out possible problems and to properly schedule patients on the waiting lists. Differently, the DRG system (Diagnosis Related Groups) is adopted as a classification based on homogeneous diagnosis groups for dismissed patients in order to identify, ex-post, the consumption of resources and the duration of stay in hospital, and to associate these to the clinical profile (Fatter and Freeman, 1986). This method is indeed used by some National Health Services as a tool to compute reimbursements for hospital activities.
One of the most critical aspect of hospital processes management is the difficulty to provide high service
level due to high volumes and variability of demand, as well as to poor coordination among the different departments through which patients flow and between the department and the secretary service that fix the appointments for outpatients (in Italy, “CUP”). Generally speaking, capacity planning and production programming aim to realize an equilibrium between the demand and the available resources, but the unavoidable uncertainty along with the related variability can create problems, which inside the hospital are translated into service delays, long waiting times for the patients, undesirable personnel overtimes and, eventually, up to cancellations of interventions (Bensa, et al., 2008). It is acknowledged that the fundamental starting point to set up some sort of production plan is a reliable measurement of the lead times, together with the informations on future demand and available capacity. Although physicians may be confident in estimating the time needed for each type of exam – mainly according to their experience and not thanks to historical data, which too often are not collected – this valuable information is hardly used for programming the daily workload. This is typically arranged simply counting a reasonable number of patient per each shift and relying on a standard duration of a generic (!) exam.
The optimization of resource utilization in this complex context should require a massive support by information technologies such as electronic medical records, computerized physician order entry, health enterprise resource planning, picture archival communication systems. However, even the quick application of scheduling principles and sandbagging techniques may help in rationalizing the daily workload program.
2. Analysis of the case of the DIIR department and description of proposed approach
In this study the department of Diagnostic Imaging and Interventional Radiology (henceforth, DIIR department) of an important Italian paediatric hospital is analysed. In this department different specialties centres are present (x-ray, echography, magnetic resonance, computed axial tomography etc. ) and specifically the echography exam class has been investigated: there are 83 different exam types inside the echography group and the analyzed sample is composed by the 19’591 exams (belonging to different 60 types) performed during 2008. In the 50% of the cases, overtime was required in order to complete the exams of the patients assigned to the shift by the CUP and, as it is shown in Figure 1 below, the productive capacity utilization was highly irregular, with peaks of 97 exams/day and several shifts below the average of 65 exams/day. As a result often physicians were forced to speed up their examinations (with the consequent risk of misdiagnosis probability increase) while frequently all the exams were concluded well in advance with respect to the shift end (which represents a waste of resources).
Figure 1 – number of exams/day in the analysed DIIR department in 2008 Moreover, the CUP gathers all the reservation requests and schedules outpatients appointments every 10 minutes without taking into account the following aspects:
- differences among the exams durations;
- difference among patients, in terms of the number of exams which they have to undergo;
- unpunctuality and uncertainty factors, such as no-shows probability.
The empiric approach adopted by the CUP leads to resource underutilization or, on the other side, patients scheduling overlap, congestion, queues and stress for workers. In 2001 the assurance claims of Italian radiologists over the 1993-2000 period were anonymously evaluated, and on a total number of 422 cases, misdiagnosis represented the first and most important claim category with more than the 60% of total (Fileni and Magnavita, 2001). Stress factor may play a decisive role in misleading physicians, thus organizational issues – e.g. frequent overtimes – should be firstly investigated in order to improve the quality of service (Achard et al., 2005).
The proposed approach starts from the analysis of the mean value and variance of the duration of the exams, and is based on four criteria:
a) divide the exams in classes and schedule them among the shifts with an optimization model; optimal solutions reached through the application of operations research algorithms tend to perform better with respect to artisanal methods applied on the basis of the experience or the feeling of the operators;
b) discriminate among inpatients and outpatients in the assignment to the shifts and in the scheduling, provided the differences of their exams duration and, moreover, of their no-show probability;
c) evaluate the opportunity of increasing the duration of the shifts; as it is well known in operations management, the larger is the bucket, the more effective is the compensation among the standard deviations of the activities, which facilitates the resource levelling; d) evaluate the opportunity of overbooking exams for inpatients, leveraging on their availability in the
hospital, which again facilitates the resource levelling increasing their utilization as well.
These criteria may not only be serially applied but even all adopted simultaneously, as it has been done in the analysed case. This approach, indeed, can be easily applied in every department which has to serve both outpatients and inpatients.
3. Validation of the criteria and reports of the results Many hospitals, as mentioned before, should have an information system in which process data are collected. Providentially, in the case of the analysed DIIR department and in particular the echography specialty, the medical equipments can record the exact time in which the patient picture is taken; thus, analysing these data together with the CUP reservation it was possible to calculate waiting times, average lead times and other peculiar performance indicators. To the aim of this study, the echography exams were divided in three classes:
class 1): exams with average duration below 13 min (20 exams typologies).
class 2): exams with average duration from 13 to 20 min (29 exams typologies).
class 3): exams with average duration over 20 min (11 exams typologies).
The following Table 1 reports the mean values, standard deviation and weekly demand per each of the three classes of exam, dividing inpatients and outpatients. It is possible to see that outpatients exams are generally quicker than inpatients ones, due to the fact that hospitalized patients typically suffer from more severe diseases. OUTPATIENTS INPATIENTS Class Mean value St. dev. value Weekly demand Mean value St. dev. value Weekly demand 1 9 10 58 14 11 17 2 13 10 68 15 11 177 3 21 15 1 19 14 1 TOTAL 11 10 126 15 11 196
Table 1: mean values, standard deviation and weekly demand per each of the three classes of exam
A discrimination criteria among inpatients and outpatients should not originate from the difference among their exam reservation process (the outpatients tend to arrive at the hospital just in time for the exam or little in advance): each exam can have different duration depending on the type, age and conditions of the patient, but some exams have relatively predictable durations while others suffer from significant uncertainty. As it has been shown, indeed outpatients exams generally last a little less and have smaller standard deviation. Moreover, the no-show probability is 15% for
0 20 40 60 80 100 120 gen -08 feb -08 mar -08 ap r-08 mag -08 gi u -08 lu g-08 ag o -08 set -08 o tt -08 n o v-08 d ic -08
outpatients and – clearly – zero for inpatients. The CUP used to separate the reservation per shifts and to completely dedicate some shifts to outpatients. Note that in the analysed department, one echography shift was scheduled in the afternoon (from 14.30 to 19.30) and two were scheduled every morning (from 08.30 to 13.30), thanks to the presence of two echography centres inside the same department though in different wings of the hospital building. As a result, in some cases the outpatients shifts ended more than one hour in advance with respect to the shift end, showing great opportunities to increase the number of served patient; meanwhile in the 59% of the cases, in order to complete the scheduled inpatients, the personnel was forced to overtime. Mixing inpatients and outpatients scheduling in each shift (indicatively scheduling one outpatient every two inpatients) may allow a better exploitation of the compensation effect among the standard deviations of the exam durations. Meanwhile, the opportunity of increasing the shift duration should be carefully evaluated: the potential benefits, in terms of resource management and, thus, in terms of service capacity, are evident. However it may lead to decrease service quality.
In order to be compared with the actual situation three 300 min. shifts per day, with only a kind of patients (inpatients or outpatients), the following two alternative cases were tested:
i) three 300 min. shifts per day, with both kind of patients (mixed inpatients and outpatients);
ii) one 900 min. shift per day, with both kind of patients (mixed inpatients and outpatients);
Scheduling on one entire shift of 900 minutes implies the acceptance of the possibility that:
- one or more patients may be relocated from the late morning to the early afternoon and viceversa; obviously this is not admittable dealing with outpatients appointments;
- one or more patients may be suddenly moved from one echography center to the other, from one wing of the building to the other. This is far more acceptable from the greatest part of both kind of patients, if it leads to the reduction of the waiting time.
In order to schedule the three classes of exams on the two alternative configurations for the shifts, an integer linear programming approach was selected. Keeping in mind the leading principle to adapt industrial operations management techniques to sanitary service optimization, the problem was modelled in order to use a classical cutting stock problem (Gilmore and Gomory, 1961), solved with a freeware LP software.
The algorithm gave back the best pattern in order to satisfy the demand. The pattern assignment resulting from the cutting stock problem solution (CSP) has been tested simulating the system with the 2008 input data and, per each shift, the mean value (𝜇𝑖) and the standard
deviation (𝜎𝑖) of the duration was calculated. In order to determine the performances of the approach in terms on probability to complete the shift i on time, i.e. the complementary probability of overtime (Pi), the
following indicator is defined:
𝑃𝑖 = 1 𝜎𝑖 2𝜋 𝑒 −(𝑥 −𝜇 𝑖) 2 2𝜎 𝑖2 𝑠 −∞ 𝑑𝑥 (1)
where S indicates the standard shift duration, that is 300 or 900 minutes. The exploitation of the normal distribution form is supported by the fact that, during a shift, several independent exams are serially performed (in 300 min. shifts, the total duration results as a sum of 20÷27 i.i.d. random variables).
Figure 2 shows an illustrative picture of the resulting patterns in case (i), that is in case of 15 separate shifts in the weeks, with a levelled scheduling.
Figure 2: CSP exams classes scheduling solution for case (i)
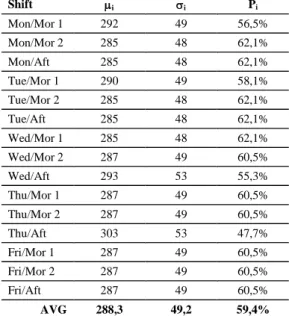
The results for case (i) are reported in Table 2 below:
Shift i i Pi Mon/Mor 1 292 49 56,5% Mon/Mor 2 285 48 62,1% Mon/Aft 285 48 62,1% Tue/Mor 1 290 49 58,1% Tue/Mor 2 285 48 62,1% Tue/Aft 285 48 62,1% Wed/Mor 1 285 48 62,1% Wed/Mor 2 287 49 60,5% Wed/Aft 293 53 55,3% Thu/Mor 1 287 49 60,5% Thu/Mor 2 287 49 60,5% Thu/Aft 303 53 47,7% Fri/Mor 1 287 49 60,5% Fri/Mor 2 287 49 60,5% Fri/Aft 287 49 60,5% AVG 288,3 49,2 59,4%
Table 2: mean value, standard deviation and performances for each shift in case (i)
The overall overtime probability in the DIIR department was actually 50,0%, with peak values of 59% for inpatient shifts. Considering that the average value of Pi
in Table 2 results to be 59,4%, it is possible to state that the application CSP pattern can reduce the overall overtime probability to 40,6%, serving the same number of patients.
The results of the application of a CSP solution on one 900 min. shift per day, that is case (ii), are reported in Table 3 below: Day i i Pi Mon 862 84 67,4% Tue 860 84 68,3% Wed 865 87 65,7% Thu 877 87 60,4% Fri 861 85 67,8% AVG 865,0 85,4 65,9%
Table 3: mean value, standard deviation and performances for each day in case (ii)
The overtime probability is further reduced from 40,6% to 34,1%, always serving the same number of patients. This demonstrates how the application of these simple rules may lead to levelling the daily workload.
In the end, the effectiveness of the application of the criteria d) was evaluated. The term “overbooking” is here used to describe the procedure by which, in each shift, more patients are scheduled with respect to those that can be averagely processed. This technique is used to saturate the shifts in case of the occurrence of outpatients no-shows or in case several exams have been quickly completed. Clearly, there is a high probability that the “overbooked” patients may be not processed and thus relocated to the next shift. Note that, in case (ii), the overbooking procedure may lead to shift one or more patient from one day to another. Clearly, this approach cannot be adopted for outpatients but, however, also schedule changes for inpatients should not be underestimated, because these may reflect on the workload of other departments or cause longer stays in hospital and thus higher costs. At the moment, the DIIR department confirms the reservation for an inpatient exam at least one day in advance; anyway, the physical transfer of the patient from the ward to the department is done little before the moment of the exam. Adopting the overbooking technique, the patient scheduled for Tuesday morning may be notified of the possibility of being examined on Monday afternoon; this requires to confirm the reservation to some patients at least two days in advance, in order to cope with operative constraints such as the need of being on an empty stomach, or having drunk enough water, etc.
In order to compute the overbooking effectiveness, the case (ii) is taken into consideration: being the average duration of the optimized shift equal to 865 minutes and
being the average duration of an inpatient exam equal to 15 minutes, as an average 2,3 inpatients more could theoretically be processed each day. Let’s now consider the spare time resulting from outpatients no-shows: expecting 15 outpatients per day, with an average exam duration of 11 minutes and a 15% probability of no-show, the expected value of wasted time is more than 24,7 minutes per day, which means other 1,65 inpatients potentially processed. Thus, relying on the overbooked inpatient availability, almost 4 exams could theoretically be added every day before the end of the 900 minutes. Averaging 61 exams/week, this may represent an increase of 6,5% of service capacity. Considering that is reasonable that little time intervals may result anyway unusable (e.g. if the last exam ends when there are still 5-7 minutes for the end of the shift, obviously not one patient is called for a new exam), on top of the previously reported theoretical results, in order to find a practical estimation of the effectiveness of this technique, the availability of 9 overbooked inpatients per each day has been simulated and it generated 847 extra exams per year, that is approximately an increase of the 4,3% of the service capacity. Clearly, admitting the possibility of scheduling 9 patients in overbooking every day require a precise organization and a careful management of the eventual patients transfers from the wards to the DIIG department. Anyway, we succeeded in demonstrating that the application of simple management techniques to sanitary services may reach not negligible results.
4. Conclusions and suggestions for further research This work aims at the optimization of the daily workload management for a public hospital department. Not any state-of-art technique or advanced mathematical approach has been used, but only the practical operations manager point-of-view which results to be so appreciated in industrial contexts. At first, an analysis of the service demand was carried out, classifying the several types of medical exams that could be performed on the basis of their average duration and standard deviation and dividing the patient typologies among inpatients and outpatient with reference to the differences among service times. Hence, some reasonable criteria were proposed, borrowed from the operations management culture, to reduce the overtime probability and levelling the resource utilization. Among these, the evaluation of the opportunity of scheduling the exams on a single time bucket instead of three different shifts; the opportunity of mixing inpatients and outpatients exams instead of dedicating each shift to one of these two types; the opportunity of overbooking inpatients exams, relying on their presence inside the hospital structure, in order to saturate the resources that can be wasted due to the natural exams duration variability and the less natural probability of outpatients no-shows. On top of this, the exams scheduling among the shift was computed
modeling the problem as a classical cutting stock problem model and solving it with a freeware linear programming software.
All of this may even resemble the well known kaizen approach, bringing back each solution to a straightforward application of simple statistical analysis with a consequent intuitable workaround. Anyway, the overall overtime probability in the analysed department was actually 50,0%, with peak values of 59% for inpatient shifts, and it has been reduced to 34,1% without loss of service capacity. Then, exploiting the time fringes saved from the resource levelling, the recovery of a 4,3% (theoretical 6,5%) of extra capacity was validated through numeric simulation.
In a Diagnostic Imaging and Interventional Radiology department, misdiagnosis represented the first and most important claim category with more than the 60% of total, and it is possible to correlate the misdiagnosis probability with physician stress and to the frequency of overtimes. The adoption of the suggested criteria may lead to stress reduction, improvement of working conditions and reduction of risk of adverse events, meanwhile almost 1’000 exams can be added, every year, to those normally performed by the analyzed echography specialty center.
These criteria can be easily applied in any other hospital context in which inpatients and outpatients are processed. This paper has presented a little but effective contribution which can be added to all of the successful optimization initiatives already experienced in the Italian hospitals; however, it should be mentioned that too often the dissemination activities had not been sufficiently effective in order to spread good practice standards among the several health-care structures in the various regions. For this reason, in 2008 in Italy an inter-University project (PRIN) was launched on the theme of innovation of health-care systems through Operations Management techniques, involving the Polytechnic of Turin, the University of Bari, the University of Brescia, the University of Salerno, the Second University of Naples. In support of the latter, the Operations Management research group inside the Department of Enterprise Engineering in “Tor Vergata” University of Rome is participating and this paper shows some results from the preliminary activities.
References
Bensa, Prenestini, Villa, (2008), La logistica del paziente in ospedale: aspetti concettuali, strumenti di analisi e leve di cambiamento. CERGAS. Rapporto Oasi 2008 vol. 11, p. 327-363.
Porter, Teisberg, (2006), Redefining Health Care: Creating Value-Based Competition on Results, Harvard Business School Press. p. 432 .
Achard, D’Aunno, Visentin, Nenni, Profili, Schiraldi, (2005). Public health assessment system with risk
management analysis: project description. Working paper, 15 April 2005.
Vissers, Beech (2005), Health operations management - patient flow logistics in health care. Routledge Health Management Series, London & New York, 344
Brandeau, Sainfort, Pierskalla, (2004). Operations Research and Health Care: A Handbook of Methods and Applications. Kluwer's International Series.
Karvonen, Rämö, Leijala, Holmström (2004), Productivity improvement in heart surgery – a case study on care process development, Production Planning & Control, 15/3, 238-246
Fileni, Magnavita (2001), Liability claims in radiology: an 8-year follow-up and future projections. La Radiologia medica. 102/4, 250-5.
Vissers, Van Der Bij, Kusters (2001), Towards Decision Support for Waiting Lists: An Operations Management View, Health Care Management Science, 4/2, 133-142 Davies, Walley (2000), Clinical governance and operations management methodologie. International Journal of Health Care Quality Assurance, 13/1, 21-26 Rotondi, Brindis, Cantees, DeRiso, Ilkin, Palmer, Gunnerson, Watkins (1997), “Benchmarking the Perioperative Process. I Patient Routing Systems: A Method for Continual Improvement of Patient Flow and Resource Utilization”, Journal of Clinical Anesthesia, 9/2, 159-169
Roth, Van Dierdonck (1995), Hospital resource planning: concepts, feasibility, and framework. Production and Operations Management, 4/1, 2-29. Fatter, Freeman (1986), Diagnosis related groups: product line management within hospitals. Academy of Management Review, 41-54.
Gilmore, Gomory (1961). A linear programming approach to the cutting-stock problem. Operations Research 9, 849-859