A
Allmmaa MMaatteerr SSttuuddiioorruumm –– UUnniivveerrssiittàà ddii BBoollooggnnaa
DOTTORATO DI RICERCA IN
Scienze Mediche Generali e Scienze dei Servizi Ciclo XXXII
Settore Concorsuale: 06/M1
Settore Scientifico Disciplinare: MED/42
TITOLO TESI
Behind HbA1c: the role of self-efficacy in diabetes care
Presentata da:
Dott.ssa Rossella Messina
Coordinatore Dottorato
Supervisore
Prof. Fabio Piscaglia
Prof.ssa Maria Pia Fantini
3
CONTENTS
Abstract 5
List of tables and figures 6
List of supplementary materials 7
Abbreviations 8
1. Introduction 9
2. Aims 14
3. Methods 15
3.1.1 Study I: Study design and population 15
3.1.2 Adaptation of the DMSES: face and content validity 16
3.1.3 Measures 17
3.1.4 Statistical analysis: Principal Component Analysis, Internal Consistency, Convergent/Discriminant validity
19
3.2.1 Study II: Study design and population 20
3.2.2 Statistical analysis: Network analysis 21
4. Results 23
4.1 Study I: Sample characteristics 23
4.1.1 Psychometric validation of the IT-DMSES 23
4.1.2 IT-DMSES scoring instructions 24
4.2 Study II: Sample characteristics 25
4.2.1 Network analysis: Comparison between type 1 and type 2 diabetes 26 4.2.2 Network analysis: Gender differences in type 2 diabetes 27 4.2.3 Network analysis: Gender differences in type 1 diabetes 27
5. Discussion 28 5.1 Study I 28 5.2 Study II 29 6. Conclusion 32 6.1 Study I 32 6.2 Study II 32 References 33
Tables and Figures 38
5
ABSTRACT
Purpose: This thesis aims to illustrate the Italian validation of a scale measuring self-efficacy in diabetes management (Diabetes Management Self-Efficacy Scale, DMSES) in adults with diabetes.
Methods: Two cross-sectional studies were conducted with patients attending the Diabetology Unit of San Marino and Bologna Hospitals. In study I, patients completed a socio-demographic and clinical data form, the Italian version of the DMSES (IT-DMSES) and 3 self-report questionnaires measuring diabetes distress (PAID-5), psychological well-being (WHO-5) and depression (PHQ-9). Psychometric testing included construct validity (Principal Component Analysis), internal consistency (Cronbach’s α coefficient) and convergent/discriminant validity (Spearman’s correlation coefficient). In study II, a network analysis of the IT-DMSES was conducted to investigate the differences in self-efficacy between type 1 and type 2 diabetes and between males and females.
Results: Overall, 105 patients with type 1 diabetes and 306 with type 2 diabetes were recruited at the two study sites. The IT-DMSES proved to consist of two factors, including disease management and lifestyle management. The second factor showed a good convergent validity with the well-being index. Results from network analysis showed that disease management and lifestyle management are two spatially distinct but related clusters of items, consistent across types of diabetes and genders. The pattern of correlations among items proved to be significantly different between type 1 and 2 diabetes.
Conclusions: IT-DMSES can be used in research and clinical practice in people living with diabetes to assess self-efficacy. In type 1 diabetes, educational interventions aimed at empowering patients in coping with their disease are likely to affect both disease management and lifestyle management. On the contrary, in type 2 diabetes, educational interventions targeted on disease management may have a limited effect on the adoption of healthy lifestyles and vice versa.
6
LIST OF TABLES AND FIGURES
Tables
Study I
Table 1. Comments to the items from pilot administration;
Table 2. Demographic, clinical characteristics and scales measuring self-efficacy, depression, diabetes distress and psychological well-being (N=165);
Table 3. Factor loadings of the two factors extracted using principal component analysis with promax rotation;
Table 4. Weights of the items.
Study II
Table 5. Socio-demographic and clinical characteristics of study participants (N=411); Table 6. Gender differences in type 1 and type 2 diabetes (n=411 patients).
Figures
Study I
Figure 1. IT-DMSES items scores.
Study II
Figure 2. Network of self-efficacy IT-DMSES items for type 1 (on the left) and type 2 diabetes (on the right) and centrality indices (panel C: red line= type 1 diabetes; blue line= type 2 diabetes);
Figure 3. Network of self-efficacy IT-DMSES items for males (on the left) and females (on the right) in type 2 diabetes and centrality indices (blue line=females; red line=males);
Supplementary Figure 1. Network of self-efficacy IT-DMSES items for females (on the left) and males (on the right) in type 1 diabetes and centrality indices (blue line=females; red line=males).
7
LIST OF SUPPLEMENTARY MATERIALS
Supplementary material 1. The English version of the Diabetes Management Self-Efficacy Scale (DMSES-UK);
Supplementary material 2. The Italian version of the Diabetes Management Self-Efficacy Scale (IT-DMSES);
Supplementary material 3. The Problem Areas In Diabetes Scale (PAID-5); Supplementary material 4. The Well-Being Index (WHO-5);
8
ABBREVIATIONS
AADE: The American Association of Diabetes Educators ADA: The American Diabetes Association
CRT: Classification and Regression Trees statistical method DMSES: Diabetes Management self-efficacy scale
DMSES UK: The Diabetes Management Self-Efficacy Scale of the United Kingdom HbA1c: Glycated Haemoglobin
ISS: Institute for Social Security of San Marino
IT-DMSES: The Italian version of the Diabetes Management Self-Efficacy Scale KMO: Kaiser-Meyer-Olkin measure
PAID-5: The Problem Areas In Diabetes-Short form PCA: Principal Component Analysis
PHQ-9: The Patient Health Questionnaire T2D: Type 2 diabetes
UK: United Kingdom
9
CHAPTER 1
1. Introduction
Diabetes mellitus is a chronic condition with a high prevalence. In 2017 the International Diabetes Federation estimated that about 425 million of people (8,8% of adults 20-79 years) have diabetes (87-91% type 2 and 7-12% type 1) and that 4 million people die from diabetes or its complications (IDF, 2017).
In fact, diabetes is a major cause of blindness, kidney failure, heart attacks, stroke and lower-limb amputation (WHO, 2016).
In 2016, in Italy over 3.2 million people have been diagnosed with diabetes (about 90% have type 2 and 9-10% type 1 diabetes), representing 5.3% of the Italian population (16.5% among people 65 years old and over) (Istituto Nazionale di Statistica, 2017). People with diabetes have to deal with multiple tasks in order to treat and regulate their disease, and especially to prevent chronic kidney disease, central nervous system complications, damage to the blood vessels of the eye. Blood sugar control, administration of insulin or taking oral hypoglycemic drugs and life styles concerning nutrition and physical exercise are examples of daily behaviors and activities that the patient needs to plan and carry out to manage their disease. Patients indicate that they consider managing self-care activities more difficult than the diagnosis of diabetes itself (Anderson, 1985).
In fact, once the diagnosis is established, patients with diabetes are expected to follow a complex set of self-care activities to manage their disease on a daily basis. The American Association of Diabetes Educators (AADE) specifies seven self-care behaviors to promote healthy outcomes, including healthy eating, physical activity, monitoring indicators of diabetes control (such as blood glucose and glycosylated haemoglobin),
10
taking medication, problem solving and healthy coping (Coyle, Francis, & Chapman, 2013). In order to support the person with diabetes in managing these self-care activities, the American Diabetes Association (ADA) and the AADE suggested to incorporate the diabetes self-management education and support in the healthcare models (Riddle et al., 2018). These interventions should facilitate the knowledge and ability necessary for diabetes self-care and support people with diabetes in implementing and sustaining the behaviors needed to manage their chronic condition (Beck et al., 2017).
On this regard, the ADA recommends to providers that they should consider the burden of treatment and patient levels of confidence/self-efficacy for management behaviors (Young-Hyman, 2016).
The concept of self-efficacy has been introduced in 1960 with Albert Bandura within the “social learning theory” and is defined as people’s beliefs in their capability to organize and execute the course of action required to deal with prospective situations (Bandura 1997; 1998).
It is concerned not only with the skills one has but with judgements of what one can do with whatever skills one possesses (Bandura & National Inst of Ment Health, 1986). According to the self-efficacy theory (Bandura, 1994; Bandura & National Inst of Ment Health, 1986), the expectations of personal mastery (efficacy expectations or self-efficacy) and success (outcome expectations) determine whether an individual will engage in one particular behavior.
Self-efficacy, or the belief that one can self-manage one’s own health, is an important goal of healthcare providers, particularly in chronic illness (Lenz, 2002).
Being highly efficacious is a key factor in successful chronic disease self-management (Devarajooh & Chinna, 2017).
11
For this reason, the ADA (Beck et al., 2017) recommends that self-efficacy should be measured to assess confidence in performing diabetes self-care activities. In fact, from a perspective of patient-centered psychosocial care in diabetes (Young-Hyman, 2016), targeting interventions according to patient’s self-efficacy has a key role to improve diabetes self-management (Beckerle & Lavin, 2013; Iannotti et al., 2006; King et al., 2010; Nouwen, Urquhart Law, Hussain, McGovern, & Napier, 2009; Sarkar, Fisher, & Schillinger, 2006).
A systematic review (Hamzah, 2013) identified 14 studies that conducted research in the context of measuring self-efficacy in type 2 diabetes management. The review concluded that the Diabetes Management Self-Efficacy Scale (DMSES) is the most widely used scale and also some countries such as Australia, UK and China had accepted the use of the scale as a best practiced model. The DMSES in comparison to the Diabetes Empowerment Scale (Anderson, 2000), which assesses psychosocial self-efficacy perceptions, is focused on functional diabetes management behaviours. Moreover, it is based on self-care activities the patients have to carry out in order to manage their diabetes and to prevent complications. For this reason, the main advantage of using the DMSES is the possibility to assess attitudes regarding lifestyle, foot care, weight control, medication adherence, ability to measure blood glucose levels when necessary and also the differences between managing higher and lower blood glucose levels.
The original version of the instrument was developed in Dutch (Van der Bijl, 1999) and consisted of 20 items. Currently it has been validated in Greek, Korean, Chinese, Iranian, Turkish, Thai (Fappa et al., 2016; Lee et al., 2015; Vivienne et al., 2008; Noroozi et al., 2014; Kara et al., 2006; Sangruangake et al., 2017) and in an Australian (McDowell et al., 2005) population, demonstrating acceptable reliability and validity. Factor analysis in Greek, Korean and Chinese versions yielded four factors, five in the Iranian version and three in the Turkish version. A UK validation study reduced the DMSES to 15 items
12
(Sturt et al., 2010). The DMSES UK (Sturt et al., 2010) was found to be negatively correlated with diabetes distress and glycated haemoglobin levels and one factor solution was found.
Given the aims of study I, my interest moved than to analyse potential differences between type 1 and type 2 in the perceived confidence on diabetes self-management.
In fact, it is unknown whether the self-efficacy constructs measured by this scale and the correlations between items differ between type 1 and type 2 diabetes or between genders. Understanding whether specific aspects of self-efficacy are more prominent or more strongly interlinked in different patient subgroups is relevant for the design of targeted psychoeducational interventions to promote effective self-care.
In order to examine the empirical relationships among self-efficacy items in deeper detail, we used network analysis. Network modeling is a novel way of representing psychological constructs as complex systems of interacting variables. The inspection of networks allows understanding the extent to which items belonging to the same construct are connected to each other and the strength of their mutual relationships. Although in the majority of applications the analysis was typically limited to investigating a network structure in a single population, recently the focus has shifted from single population studies to studies comparing network structures from different subpopulations (van Borkulo et al., 2015) and specific tests have been developed (van Borkulo et al., 2016) to examine whether the network structure is identical across subpopulations, whether specific correlations differ in strength between subpopulations and whether the overall connectivity is equal across subgroups.
13
It is well known that type 1 and type 2 diabetes have a different pathogenesis, age of onset, and require different therapeutic strategies for the glycemic control. Regarding gender, differences have been reported on disease management compliance with treatment and complications (Ballotari, Venturelli, Greci, Giorgi Rossi, & Manicardi, 2017; Maiorino et al., 2018; McCollum, Hansen, Lu, & Sullivan, 2005).
Given clinical knowledge and previous evidence, we hypothesized that patients with type 1 and type 2 diabetes as well as males and females would feel differently capable of managing some aspects of their disease and applied network analysis to investigate the structure of the self-efficacy network in type 1 and type 2 diabetes, and in males and females stratified by type of diabetes.
14
CHAPTER 2
2. Aims
The aim of this thesis was to validate the Italian version of the DMSES and to explore whether specific aspects of self-efficacy are more strongly interlinked in different patient subgroups in order to design targeted psychoeducational interventions to promote effective self-care.
Study I (Messina, Rucci et al. 2018)
- To translate and adapt the English version of the scale to Italian and to evaluate the psychometric properties of the Italian version of DMSES (IT-DMSES) in type 2 diabetes.
Study II (Rucci, Messina et al. 2018)
- To investigate the structure of IT-DMSES self-efficacy network in type 1 and type 2 diabetes, and in males and females stratified by type of diabetes.
15
CHAPTER 3
3. Methods
3.1.1 Study I: Study design and population
A cross-sectional study was conducted, 165 patients with type 2 diabetes attending the Endocrine-Metabolic Disease Unit Care of the Internal Medicine Department of San Marino State Hospital were recruited between October 2016 and February 2017.
Inclusion criteria were: age >18-80 years; diagnosis of type 2 diabetes more than 6 months.
Exclusion criteria were: dementia; type 1 diabetes; gestational diabetes.
The Ethics Committee of the Institute for Social Security (ISS) of San Marino approved the study procedures (registration number: 28/2016/CERS). All eligible patients provided a written informed consent after receiving an explanation of study procedures and aims and after having an opportunity to ask questions.
16
3.1.2 Adaptation of the DMSES: face and content validity
The DMSES UK (Sturt et al., 2010) was chosen as the most appropriate version to translate to Italian because it had addressed the item redundancy in the original Dutch version of the instrument by reducing the number of items from 20 to 15.
The DMSES was translated to Italian and then backtranslated to English by a bilingual English native speaker (Carlson, 2000; Erkut et al., 1999; De Vellis, 2003; Ahmed et al., 2009). In order to improve the comprehensibility of the questionnaire for patients, items were reviewed by the research team, which included a public health professor, a statistician, a diabetologist and a psychologist.
After language review (reported in deeper in the Papers section, study I) the version agreed with the team was administered to a pilot sample of 5 people with type 2 diabetes of the diabetes center using a cognitive interviewing methodology to assess the perception, usefulness and interpretation of each question of the measure (Erkut et al., 1999; De Vellis, 2003).
During completion, the 5 participants were asked to provide comments on items and the terminology, and comments were recorded in field notes. Results of the supervised pilot administration of the instrument indicated that patients had difficulties rating items 2, 3, 4, 7, 11 and 12 (see table 1).
The pilot group reported that the questionnaire was interesting and introduced all the issues related to diabetes; they stated also that completing the questionnaire in the presence of a doctor may prevent people from answering the questions honestly. Following this stage, items were revised by adding some examples and the Italian final version of DMSES (IT-DMSES) was agreed (see the additional file 1).
17
The 15 items of the Italian version of DMSES measure the individual’s efficacy expectations for engaging in diabetes self-management activities, for example, checking the blood sugar, following a healthy diet even when away from home. Items are scored on a 0–10 point numerical scale, with higher scores indicating higher self-efficacy levels (Fig. 1). The time of administration ranges from 10 to 20 minutes.
3.1.3 Measures
Patients completed a form including socio-demographic and information. Results from the scientific literature indicate that self-efficacy and diabetes self-management are associated with the psychological status of an individual (Sturt et al., 2015; Peyrot et al., 2005). Therefore the convergent/discriminant validity of the IT-DMSES, was investigated by administering 3 questionnaires evaluating: diabetes distress (the Problem Areas in Diabetes-short form, PAID-5), well-being (the World Health Organization-5 Well-Being Index, WHO-5) and depression (the Patient Health Questionnaire-9).
The Problem Areas In Diabetes- Short form (PAID-5)
This scale measures diabetes distress, patients’ specific worries and negative emotions related to their diabetes (McGuire et al., 2010; Polonksy et al., 1995). The instrument has been used in more than a hundred studies and in the DAWN MIND (monitoring individual needs in people with diabetes) (Snoek et al., 2011; Nicolucci et al., 2013) program across ten countries. The PAID-5 short form has been validated in Italian in the BENCH-D study (Nicolucci et al., 2014).
It includes five items with responses on a five-point Likert scale, with a total score ranging from 0 to 100. A score ≥40 indicates elevated diabetes-related distress.
18
The World Health Organization-5 Well-Being Index (WHO-5)
This scale, developed by the World Health Organization, assesses psychological well-being, a core component of quality of life (Bech et al., 1996). The use of WHO-5 is recommended in international and some national treatment guidelines for diabetes after its worldwide use in the DAWN (Wroe, 2006).
It includes five items with responses on a six-point Likert scale, and the total score is rescaled to range from 0 to 100. A score ≤50 indicates poor psychological well-being, while a score ≤28 indicates likely depression.
The Patient Health Questionnaire-9
This questionnaire is used to screen patients for a possible diagnosis of major depression. Scores range from 0 to 27, with cut-points of 5, 10, 15 and 20 indicating mild, moderate, moderately severe and severe levels of depressive symptoms (Kroenke et al., 2010; Mazzotti et al., 2003).
19
3.1.4 Statistical analysis: Principal Component Analysis, Internal Consistency,
Convergent/Discriminant validity
The sample size was set to a minimum of 150 in order to perform an exploratory principal component analysis, for which at least a ten-to-one ratio between patients and items is recommended (Nunnally, 1978).
After descriptive analysis, principal component analysis (PCA) was performed to investigate DMSES construct validity. For this analysis, the very few missing items were replaced with mean values (28 missing items overall in 22 patients, corresponding to 1%). The number of factors to be extracted was determined according to the scree-plot method (Cattell, 1983). Oblique rotation was performed using the promax method, to allow for the expected correlation between factors.
Kaiser–Meyer–Olkin measure of sampling adequacy (KMO) and Bartlett’s test were calculated to evaluate the sample size adequacy. A KMO >0.8 indicates that the sampling is adequate. The p value of Bartlett’s test of sphericity (which tests the null hypothesis that the original correlation matrix is an identity matrix) should be significant and lower than 0.05. Factor scores were calculated using the regression method.
Internal consistency was assessed using Cronbach’s α coefficient with cut-offs of .8 and .9 denoting good and excellent reliability.
The convergent/discriminant validity of IT-DMSES vs. the PAID-5, the WHO-5 and the PHQ-9 was analysed by using Spearman’s correlation coefficient, because of the asymmetrical frequency distribution of item responses. High levels of self-efficacy are expected to be associated with low diabetes distress, a good psychological well-being and no depressive symptoms (Sturt et al., 2010; Sturt et al., 2006; Thoolen et al., 2006).
20
Decision tree with CRT method was used to classify patients into homogeneous subgroups of self-efficacy based on demographic and clinical characteristics, including gender, age, years of education and duration of illness. All analyses were performed using IBM SPSS, version 20.
3.2.1 Study II: Study design and population
In study II, the sample derived from that of the previous study I plus another group of patients recruited at the Diabetology Unit of Sant’Orsola-Malpighi Hospital Bologna (between 1 May 2017 and 31 October 2017) during this second cross-sectional study. Differently from study I, the sample included also people with type 1 diabetes.
So that, inclusion criteria were: age between 18-80 years, clinical diagnosis of type 1 or 2 diabetes for at least 6 months and willingness to sign informed consent¸ exclusion criteria were: clinical diagnosis of mild cognitive impairment/dementia and clinical diagnosis of gestational or iatrogenic diabetes.
The study protocol was approved by the Ethics Committee of Sant’Orsola Hospital (currently Independent Ethics Committee of Center Emilia Area) (registration number: 31/2017/U/Oss).
All participants provided a written informed consent to participate after receiving a thorough explanation of the study procedures and having an opportunity to ask questions. Patients completed the validated version of the IT-DMSES.
21 3.2.2 Statistical analysis: Network analysis
The 15 IT-DMSES items were used for the network analyses. A network is a graphical representation of the correlations between items. In this representation items are depicted as nodes and correlations as edges. Thicker and more saturated edges denote stronger correlations. Positive correlations are represented as green edges and negative correlations as red edges. The network display is based on an algorithm (Fruchterman & Reingold, 1991) that places strongly associated nodes at the center of the network and weakly associated nodes at the periphery.
A network model including all possible correlations among items would require the estimation of a large number of parameters, including n threshold parameters for the nodes and n*(n-1)/2 parameters for the pairwise correlations between nodes. With 15 items, this would amount to estimating 120 parameters. To deal with the problem of a relatively small dataset compared to the number of parameters, we used the ‘least absolute shrinkage and selection operator (LASSO)’ technique (Tibshirani, 1996), that leads many edge estimates to shrink to exactly zero and to drop out of the model. The LASSO returns a sparse, i.e. conservative, network model in which only a relatively small number of edges are used to explain the relationships among items. Because of this sparsity, the estimated models become more interpretable. The LASSO utilizes a tuning parameter to control the degree to which the removal of small correlations is applied. We selected this tuning parameter by minimizing the Extended Bayesian Information Criterion (Chen & Chen, 2014). To take into account the skewed distribution of items, a nonparanormal transformation was applied to the data (Liu, Lafferty, & Wasserman, 2009).
Then, to quantify the importance of each node in the network, we used the betweenness, centrality and degree indices. The betweenness denotes the number of times a specific
22
node acts as a bridge along the shortest path between two nodes, the closeness measures the number of direct and indirect links between one node and the others and the degree is the strength of links with the other nodes. These indices are normalized (mean=0 and standard deviation=1), so that an index with a value >1 indicates that it is >1 SD from the mean.
The network analysis was conducted using the statistical software JASP version 0.8.6 (JASP Team University of Amsterdam, 2018).
The R-package NetworkComparisonTest was used to test (1) the invariant network structure, (2) the invariant edge strength, and (3) the invariant global strength between subgroups.
23
CHAPTER 4
4. Results
4.1 Study I: Sample characteristics
The study sample consists of 165 patients. Participants had a mean age of 65.2 (SD±9) years, 56.9% had been diagnosed for 1 to 15 years, 63% reported HbA1c levels >53mmol/mol, 66.7% were males, 79.7% were living with a spouse or partner and 71.5% were retired. Other clinical characteristics are reported in Table 2.
PHQ-9 scores indicated that 62.7 % of patients had no depressive symptoms, 25.2 % mild, 10.8% moderate and 1.3% moderate to severe depressive symptoms. PAID-5 scores showed that 51.2 % of patients had elevated diabetes distress. WHO-5 scores indicated that 74.2% of patients had good psychological well-being, 17.6% had poor psychological well-being and 8.2% likely depression.
4.1.1 Psychometric validation of the IT-DMSES
Patients who completed the IT-DMSES were included in all the analyses (N=159). The KMO index was 0.86, indicating that the sample was adequate for factor analysis and Bartlett’s test of sphericity was significant, indicating strong correlation between variables. The PCA extracted three factors that accounted for 66.8% of the total variance. However, one of the factors included only two items and its eigenvalue was marginally higher than unity. Thus, a two-factor solution was selected that was more interpretable, and accounted for 56.6% of item variance. Factor 1 (including items: 1, 2, 3, 6, 14, 15) was labeled as “disease management” and factor 2 (including items: 4, 5, 7, 8, 9, 10, 11, 12, 13) was labeled as “lifestyles management”. Table 3 shows the item loadings on the
24
two factors. Two items had a cross-loading (item n. 6, factor 1=.415 factor 2=.322; item n.7, factor 1=.359 factor 2= .444). Disease Management had a good reliability (α=.849) and Lifestyle Management had an excellent reliability (α=.900).
Patients who completed all scales were included in this analysis (N=151).
A negative and weak correlation was found between DMSES factor 2 (Lifestyle management), PAID-5 (r=-0.258, p=<0.01) and PHQ-9 (r=-0.274, p=<0.01) and a positive one with WHO-5 (r=0.325, p<0.01) supporting convergent validity. This suggests that patients with higher self-efficacy had a higher well-being, lower distress and fewer depressive symptoms.
DMSES factor 1 (Disease management) was uncorrelated with PAID-5 (r=-0.142, p=0.083), PHQ-9 (r=-0.145, p=0.076) and weekly correlated with WHO-5 (r=0.170, p=0.037) confirming discriminant validity.
4.1.2 IT-DMSES Scoring Instructions
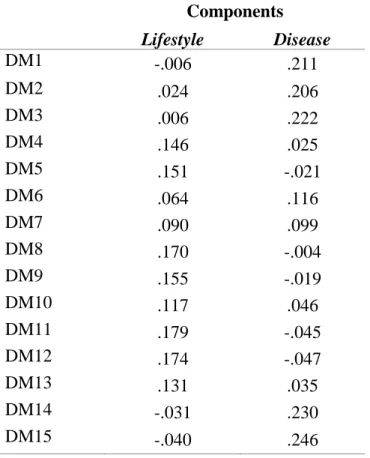
Since IT-DMSES consists of two factors, two scores are necessary. Score ‘Disease Management’ is the weighted mean of items 1, 2, 3, 6, 14, 15. Score ‘Lifestyle Management’ is the weighted mean of items 4, 5, 7, 8, 9, 10, 11, 12, 13. Both of them range from 0-10: 0-3 denotes low levels of efficacy, 4-6 intermediate levels of self-efficacy, 7-10 high levels of self-efficacy. Weights are provided in Table 4.
25 4.2 Study II: Sample characteristics
Overall 411 patients were recruited, 246 in Bologna and 165 in San Marino.
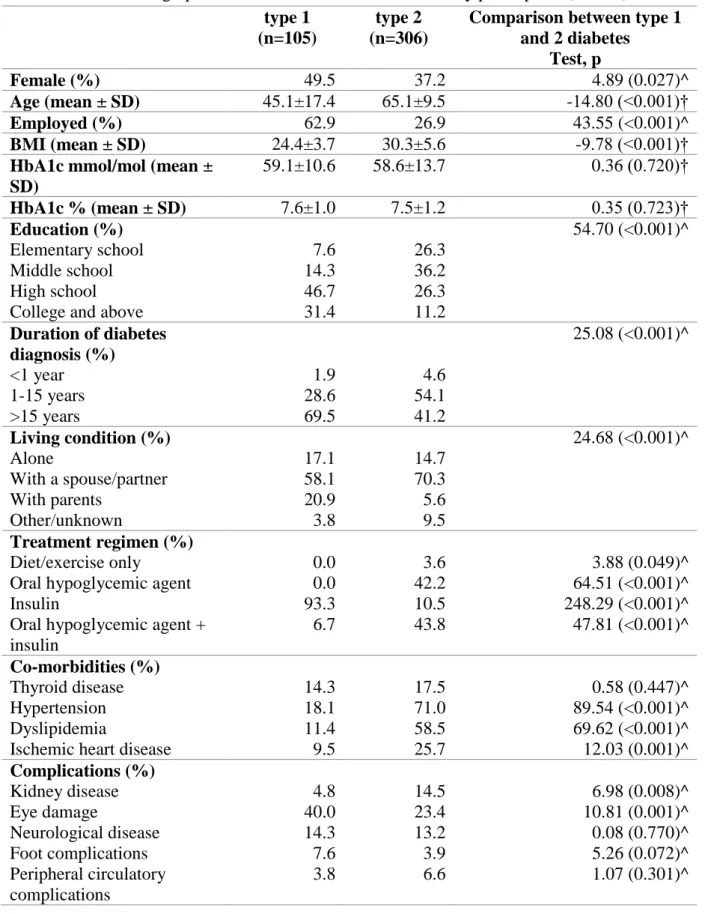
The Bologna sample included 105 patients with type 1 diabetes and 141 patients with type 2 diabetes, while the San Marino sample included 165 patients with type 2 diabetes. Patient characteristics by type of diabetes and by gender are reported in Tables 5 and 6. Patients with type 1 diabetes were younger, more frequently female, living with parents and employed than those with type 2 diabetes. They also had lower BMI, higher education and a longer history of disease. Hypertension, dyslipidemia, ischemic heart disease, kidney disease and eye damage were significantly more common in type 2 diabetes. The treatment regimen in type 2 diabetes was oral hypoglycemic mono or pluri-therapy in 42.2% of patients, combination of oral hypoglycemics and insulin in 43.8% and insulin alone in 10.5%. In type 1 diabetes, the large majority of patients were treated with insulin alone (93.3%) and 6.7% with insulin and oral hypoglycemics.
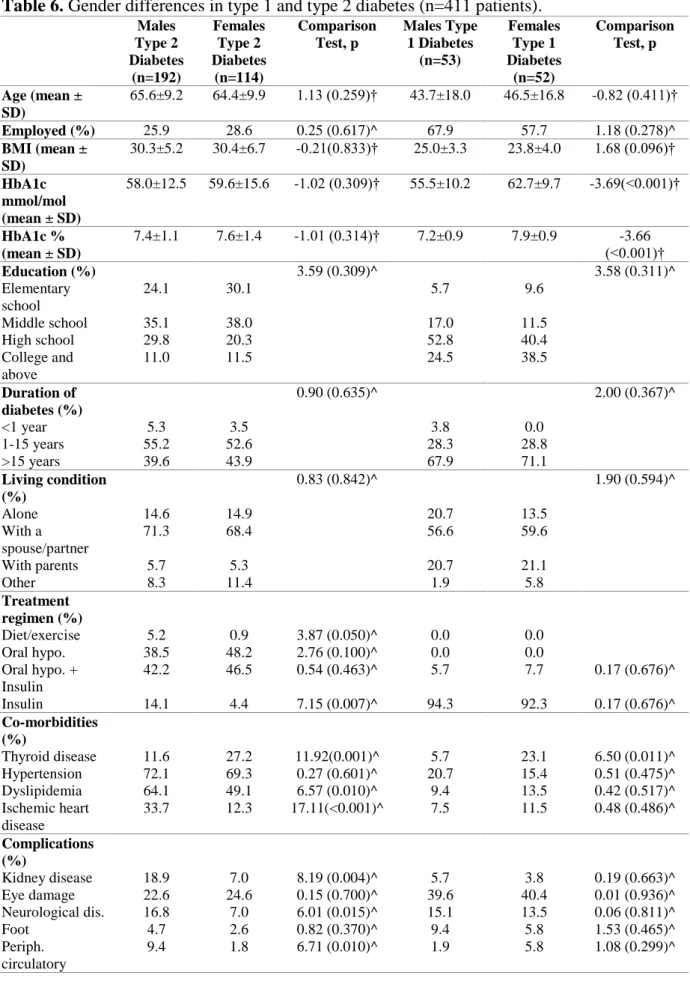
In type 2 diabetes, comparisons between genders revealed that males were more likely to have ischemic heart disease, dyslipidemia and kidney, neurological and peripheral circulatory complications. However, females had more frequently thyroid diseases as comorbidity. In type 1 diabetes, the only gender differences included a poorer glycemic control and a higher frequency of thyroid disease in females.
26
4.2.1 Network analysis: Comparison between type 1 and type 2 diabetes
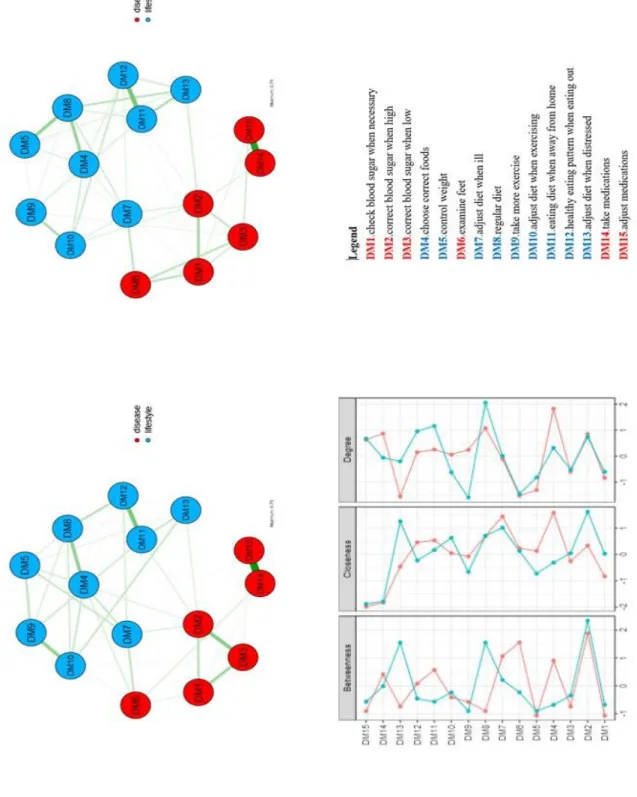
This analysis was carried out in the overall sample, including 306 patients with type 2 diabetes and 105 with type 1 diabetes. The network structure in type 2 and type 1 diabetes indicated that the IT-DMSES domains disease management and lifestyle management, colored respectively in red and blue, comprised two distinct clusters. However, the network structure, i.e. the pattern of correlations among items, proved to be significantly different between type 1 and 2 diabetes (M=0.66, p<0.001) (Fig. 2).
The global strength test revealed a significantly stronger interconnection in type 2 compared with type 1 diabetes (S=0.77, p=0.019). Notably, this result is accounted by the strong association in type 2 diabetes between items DM14 (take medications) and DM15
(adjust medications), that are peripheral and almost disconnected from the rest of the
network. Vice versa, in type 1 diabetes, self-efficacy in lifestyle management and disease management items are more densely but weakly interconnected with each other. As expected, tests of specific edge strengths confirmed a significant difference (p<0.001) between type 2 and type 1 diabetes for the item pair DM14 (take medications)-DM15
(adjust medications) (weight=0.790 in type 2, weight=0.280 in type 1) and identified
additional differences for the pairs DM7 (adjust the eating plan when ill) -D10 (adjust
diet when exercising) (weight=0.224 in type 1 and 0.023 in type 2), DM8 (regular diet)
-DM11 (eating diet when away from home) (weight 0.360 in type 1, weight=0.027 in type 2), DM13 (adjust diet when distressed) -DM14 (take meds) (weight=0.149 in type 1, weight=0 in type 2).
Concerning the centrality of self-efficacy items, in type 2 diabetes 3 items played a key role: DM2 (correct blood sugar when high) has the highest betweenness (connected directly more items with each other), DM7 (adjust diet when ill) had the highest closeness (direct and indirect connections with other items) and item DM8 (regular diet)
27
has the highest degree (stronger links with other items). In type 1 diabetes, item DM7 (adjust diet when ill) has all the highest centrality indices.
4.2.2 Network analysis: Gender differences in type 2 diabetes
This analysis was carried out in the 192 males and 114 females with type 2 diabetes. The network structure was similar between genders (M=0.23, p=0.663) and the global strength was almost overlapping in males and females (S=0.02, p=0.953) (Fig. 3).
Still, a visual inspection of the network showed some unique edges in males and females. While DM10 (adjust diet when exercising) was connected with DM13 (adjust diet when
distressed) only in males DM6 (examine feet) was connected with DM3 (correct blood sugar when low), DM12 (healthy eating pattern when eating out) with DM13 (adjust diet when distressed) and DM8 (regular diet) with DM13 (adjust diet when distressed) only
in females.
4.2.3 Network analysis: Gender differences in type 1 diabetes
This analysis included 52 females and 53 males with type 1 diabetes. The network structure and the global strength of the correlations proved to be invariant between genders (M=0.41, p=0.577 and S=0.05, p=0.937). However, the network showed some unique edges. In males, DM7 (adjust diet when ill) was connected with DM8 (regular
diet) and DM1 (check blood sugar when necessary) with DM4 (choose correct foods); in
females DM8 (regular diet) was connected with DM9 (take more exercise) (Supplementary Figure 1).
28
CHAPTER 5
5. Discussion
5.1 Study I
The study indicates that IT-DMSES is not unidimensional, but consists of two main factors underlying the construct of self-efficacy: Disease Management and Lifestyle Management. Furthermore, the results showed that the DMSES factor 2 ’Lifestyle Management’ has a good convergent validity with the Well-Being index, suggesting that a higher perceived capability to manage diet and exercise is associated with higher subjective psychological well-being. This result is consistent with previous studies, in which higher self-efficacy was related to lower emotional distress (Sturt et al., 2010; Fisher et al., 2007). Factor 1 ‘Disease Management’ was uncorrelated with PAID-5, PHQ-9 and WHO-5, confirming that this factor measures a conceptually different construct from distress, depression and well-being.
The identification of two dimensions of self-confidence in diabetes management has important implications on targeting personalised patient education interventions because it allows to know the activities in which patients are facing more difficulties.
In addition, we found that self-efficacy is related to illness duration, gender and age. Higher levels of self-efficacy in lifestyle management were found in patients diagnosed for at least 1 year up to 15 years and aged >65 years and the poorest self-efficacy was found in males < 65 years.
These results suggest that efforts to promote patient education to self-efficacy should be especially targeted to younger man, and to patients with a long-standing experience of disease.
29
The study has some limitations, one of which is the external validity, in fact the study sample attending the diabetes center included mostly elderly patients with comorbid diseases and complications. Therefore, our results cannot be generalized to all patients with type 2 diabetes.
Another possible limitation is the social desirability bias, that is the tendency to over-report good behaviors when answering questions. This may lead to an overestimation of patients’ ability to manage their diabetes.
5.2 Study II
This study is, to our knowledge, the first attempt to apply network analysis to investigate the relationships between diabetes self-efficacy items and to investigate the network structure and the strength of item relationships between type 1 and type 2 diabetes and between genders.
The original result of the present study is the difference in the self-efficacy network structure between type 1 and type 2 diabetes. The high interconnections between items in type 1 diabetes indicated that, in general, patients’ perceived ability to address specific tasks to manage their illness is associated with their ability to control their lifestyle. Thus, educational interventions aimed at empowering patients in coping with their disease are likely to affect both these aspects.
On the contrary, our findings indicate that in people with type 2 diabetes self-efficacy in taking and adjusting medications are two items strongly linked with each other but isolated and disconnected from the confidence in managing daily lifestyles. These findings suggest that an educational intervention targeted to support patients with type 2 diabetes in managing their disease may have a limited effect on the adoption of healthy lifestyles and vice versa. Thus this study points to the need to set up psychoeducational interventions for type 2 diabetes in which the adoption of healthy lifestyles should be
30
given at least the same attention as the glycemic control and the treatment management. Because educational programs vary in the method of delivery, content, illness and behavior change theory, their quality and outcomes should be monitored rigorously. The IT-DMSES is a standardized validated tool that can be used to measure the psychosocial effects of educational programs in two ways. The first traditional way consists in analyzing changes in self-efficacy scores.
The second innovative way, based on a network approach, consists in analyzing the item correlations before and after the program. Stronger links among items at the end of the educational program indicate that self-efficacy is improved and that confidence in managing specific tasks is connected to confidence in managing other tasks. On the contrary, looser and weak links would suggest that self-efficacy worsened. We argue that this alternative approach would offer a deeper insight into the self-efficacy aspects that change after the intervention and is consistent with self-efficacy theory which posits that confidence in self-care is not of a general nature but related to specific situations (Bandura & National Inst of Ment Health, 1986; van der Bijl & Shortridge-Baggett, 2001).
Our study has some limitations. This was a cross-sectional study measuring self-efficacy during a single study visit; therefore, we were unable to ascertain the persistence of self-efficacy in diabetes management over time or the effects of educational intervention. The generalizability of these study findings above and beyond this patient population should be done with caution because our sample is not representative of patients with type 2 and type 1 diabetes in other settings, such as, for instance, primary care. Moreover, self-efficacy was assessed using a self-report measure. Patients’ perceived ability in diabetes management may be overestimated due to a social desirability bias since patients completed questionnaires in the presence of the researcher. Moreover, this self-report
31
instrument may have limitations for routine use in clinical settings where supported administration may be needed for elderly people or for people with vision problems.
32
CHAPTER 6
6. Conclusion
6.1 Study I
IT-DMSES version has sound psychometric properties and measures two different dimensions of self-efficacy: disease and lifestyle management. Results support the validity and reliability of the instrument. IT-DMSES can be used in people living with type 2 diabetes to monitor diabetes self-management over time.
6.2 Study II
Network comparisons revealed differences between type 1 and type 2 diabetes concerning the centrality of specific self-efficacy aspects and the way in which these aspects are connected to each other. In particular, in type 1 diabetes, the ability to face non–regular self-management activities plays a central role because it is more interconnected with the other aspects of lifestyle and disease management than in type 2 diabetes. Knowledge of these aspects can give useful directions to clinicians to target psychoeducational interventions to support patient in the self-management of their condition. No significant gender differences emerged in the network structure. Future perspectives include the use of the network approach to analyze the efficacy of self-management educational programs in clinical trials and intervention studies.
33
REFERENCES
Ahmed N, Bestall JC, Payne SA, Noble B, Ahmedzai SH. The use of cognitive interviewing
methodology in the design and testing of a screening tool for supportive and palliative care needs. Support Care Cancer. 2009; 17:665-673.
Anderson RM, Funnell MM, Fitzgerald JT, Marrero DG. The diabetes empowerment scale: a
measure of psychosocial self-efficacy. Diabetes Care. 2000; 23:739–743.
Anderson RM. Is the problem of noncompliance all in our heads. Diabetes Educ. 1985;11:31– 36.
Bandura A. Health Promotion from the Perspective of Social Cognitive Theory. Psychol Health. 1998; 13:623–649.
Bandura A. The nature and structure of self-efficacy. New York: W.H. Freeman and Company; 1997.
Bandura A. Self-Efficacy. In V.S. Ramachaudran (Ed.), Encyclopedia of Human Behavior. 1994; 4: 71–81.
Bandura A & National Inst of Ment Health. Social foundations of thought and action: A
social cognitive theory. In Prentice-Hall series, Social learning theory. NJ, US:
Englewoods Cliffs; 1986.
Ballotari P, Venturelli F, Greci M, et al. Sex Differences in the Effect of Type 2 Diabetes on
Major Cardiovascular Diseases: Results from a Population-Based Study in Italy.
International Journal of Endocrinology. 2017.
Bech P, Gudex C, Johansen KS. The WHO (Ten) Well-Being Index: validation in diabetes. Psychother Psychosom. 1996; 65:183–90.
Beck J, Greenwood DA, Blanton L, et al. 2017 National Standards for Diabetes
Self-Management Education and Support. Diabetes Care. 2017; 40(10):1409–1419.
Beckerle CM & Lavin MA. Association of Self-Efficacy and Self-Care With Glycemic Control
in Diabetes. Diabetes Spectrum. 2013; 26(3):172–178.
Carlson ED. A Case Study in Translation Methodology Using the Health- Promotion Lifestyle
Profile II. Public Health Nurs. 2000; 17:61–70.
Cattell RB. The scree test for the number of factors. Multivar Behav Res. 1983; 1(2):245-276. Chen Z & Chen J. Extended Bayesian Information Criteria for Model Selection with Large
Model Spaces. Biometrika. 2008; 95(3):759–771.
Coyle ME, Francis K, Chapman Y. Self-management activities in diabetes care: A systematic
review. Australian Health Review. 2013; 37(4):513–522.
Devarajooh C & Chinna K. Depression, distress and self-efficacy: The impact on diabetes
34
De Vellis RF. Scale development: theory and applications. 2nd ed., vol.26. Sage Publications. 2003.
Erkut S, Alarcón O, Coll CG. The dual-focus approach to creating bilingual measures. J Cross Cult Psychol. 1999; 30(2):206-218.
Fappa E, Efthymiou V, Landis G, et al. Validation of the Greek Version of the Diabetes
Management Self-Efficacy Scale (GR-DMSES). Adv Ther. 2016; 33(1):82-95.
Fisher EB, Thorpe CT, Devellis BM, Devellis RF. Healthy coping, negative emotions, and
diabetes management. The Diabetes Educator. 2007; 33(6):1080-1103.
Fruchterman TMJ & Reingold EM. Graph drawing by force‐directed placement. Software: Practice and Experience. 1991; 21(11):1129–1164.
Hamzah M, Mohamad E, Suanda J. Systematic Review: The Measurement of Health
Self-Efficacy to Diabetes. Aust J Basic Appl Sci. 2013; 7:295–302.
International Diabetes Federation. The Global burden. In: International Diabetes Federation, Diabetes Atlas 6th edition. 2013.
Iannotti R, Schneider S, Nansel T, et al. Self-efficacy, outcome expectations, and diabetes
self-management in adolescents with type 1 diabetes. J Dev Behav Pediatr. 2006; 27(2):98–
105.
Istituto Nazionale di Statistica (Istat). Il diabete in Italia 2000-2016. https://www.istat.it/it/archivio/202600 Accessed July 2017.
Kara M, van der Bijl J, Shortridge-Baggett LM, et al. Cross-cultural adaptation of the
diabetes management self-efficacy scale for patients with type 2 diabetes mellitus: Scale development. Int J Nurs Stud. 2006; 43(5):611-621.
King DK, Glasgow RE, Toobert DJ, et al. Self-efficacy, problem solving, and
social-environmental support are associated with diabetes self-management behaviors. Diabetes
Care. 2010; 33(4):751–753.
Kroenke K, Spitzer RL, Williams JBW & Löwe B. The Patient Health Questionnaire
Somatic, Anxiety, and Depressive Symptom Scales: A systematic review. Gen Hosp
Psychiatry. 2010; 32(4):345-59.
Lee EU, Van der Bijl J, Shortridge-Baggett LM, et al. Psychometric Properties of the
Diabetes Management Self-Efficacy Scale in Korean Patients with Type 2 Diabetes. Int J
Endocrinol. 2015; (3):1-9.
Lenz ER, Shortridge-Baggett LM. Self-efficacy in nursing: research and measurement
perspectives. Springer Publishing Company. 2002.
Liu H, Lafferty J, & Wasserman L. The Nonparanormal: Semiparametric Estimation of High
Dimensional Undirected Graphs. J Mach Learn Res. 2009; 10:2295-2328.
35
diabetes related factors in young adults with type 1 diabetes: results from the METRO study. Endocrine. 2018; 61(2):240–247.
Mazzotti E, Fassone G, Pasquini P. The Patient Health Questionnaire (PHQ) for the
screening of psychiatric disorders: a validation study versus the Structured Clinical Interview for DSM-IV axis I (SCID-I). Ital J Psychopathol. 2003; 9:235–242.
McCollum M, Hansen LS, Lu L, & Sullivan PW. Gender differences in diabetes mellitus and
effects on self-care activity. Gender Med. 2005; 2(4), 246–254.
McDowell J, Courtney M, Edwards H, Shortridge-Baggett LM. Validation of the
australian/english version of the diabetes management self-efficacy scale. Int J Nurs
Pract. 2005; 11(4):177-184.
McGuire BE, Morrison TG, Pibernik-Okanovic M. Short-form measures of diabetes-related
emotional distress: the Problem Areas in Diabetes Scale (PAID)-5 and PAID-1.
Diabetologia. 2010; 53:66-69.
Messina R, Rucci P, Sturt J, Mancini T, Fantini MP. Assessing self-efficacy in type 2 diabetes
management: Validation of the Italian version of the Diabetes Management Self-Efficacy Scale (IT-DMSES). Health and Quality of Life Outcomes. 2018; 16(1):71. doi:
10.1186/s12955-018-0901-3.
Nicolucci A, Rossi MC, Pellegrini F, et al. Benchmarking network for clinical and
humanistic outcomes in diabetes (BENCH-D) study: protocol, tools, and population.
Springerplus. 2014; 3:1–9.
Nicolucci A, Kovacs Burns K, Holt RIG, et al. J. Diabetes Attitudes, Wishes and Needs
second study (DAWN2TM): cross-national benchmarking indicators for family members living with people with diabetes. Diabet Med. 2013; 30(7):778-88.
Noroozi A, Tahmasebi R. The diabetes management self-efficacy scale: Translation and
psychometric evaluation of the Iranian version. Nurs Pract. 2014; 1:9–16.
Nouwen A, Urquhart Law G, Hussain S et al. Comparison of the role of self-efficacy and
illness representations in relation to dietary self-care and diabetes distress in adolescents with type 1 diabetes. Psychol Health. 2009; 24(9):1071–1084.
Nunnally J. Psychometric theory. 2nd ed. New York: McGraw-Hill; 1978.
Peyrot M, Rubin RR, Lauritzen T, et al. Psychosocial problems and barriers to improved
diabetes management: results of the Cross-National Diabetes Attitudes, Wishes and Needs (DAWN) Study. Diabet Med. 2005; 22:1379–1385.
Polonsky WH, Anderson BJ, Schwartz CE. Assessment of diabetes-related distress. Diabetes Care. 1995; 18:754–60.
Riddle MC, Bakris G, Blonde L, et al. Standards of Medical Care in Diabetes—2018. Diabetes Care. 2018; 41 (Supplement 1).
36
Does self-efficacy in diabetes management differ by type of diabetes and gender? Results from network analysis. Journal of Health Psychology. 2018; Article in Press. doi:
10.1177/1359105318804866.
Sangruangake M, Jirapornkul C, Hurst C. Psychometric properties of Diabetes Management
Self-Efficacy in Thai type 2 diabetes mellitus patients: a multicenter study. Int J
Endocrinol. 2017; (Article ID 2503156).
Sarkar U, Fisher L, & Schillinger D. Is self-efficacy associated with diabetes self-management
across race/ethnicity and health literacy? Diabetes Care. 2006; 29(4):823–829.
Snoek FJ, Kersch NYA, Skovlund SE. Monitoring of Individual Needs in Diabetes (MIND):
baseline data from the Cross-National Diabetes Attitudes, Wishes, and Needs (DAWN) MIND Study. Diabetes Care. 2011; 34(3): 601-603.
Sturt J, Dennick K, Due-Christensen M, McCarthy K. The detection and management of
diabetes distress in people with type 1 diabetes. Curr Diab Rep. 2015; 15(11):101.
Sturt J, Hearnshaw H, Wakelin M. Validity and reliability of the DMSES UK: a measure of
self-efficacy for type 2 diabetes self-management. Prim Health Care Res. 2010.
Sturt J, Hearnshaw H, Farmer A, et al. The Diabetes Manual trial protocol–a cluster
randomized controlled trial of a self-management intervention for type 2 diabetes. BMC
Fam Pract. 2006; 7:45.
Thoolen GE, de Ridder BJ, Bensing DT, et al. Psychological outcomes of patients with
screen-detected type 2 diabetes. Diabetes Care. 2006; 29(10):2257-2262.
Tibshirani R. Regression Selection and Shrinkage via the Lasso. J Roy Stat Soc B. 1996; 58(1):267-288.
van Borkulo C, Boschloo L, Kossakowski JJ. et al. Comparing network structures on three
aspects: A permutation test. 2017. https://doi.org/10.13140/rg.2.2.29455.38569.
van Borkulo C, Boschloo L, Borsboom D, et al. Association of symptom network structure
with the course of longitudinal depression. JAMA Psychiat. 2015; 72(12):1219–1226.
van der Bijl J, & Shortridge-Baggett L. The theory and measurement of the self-efficacy
construct. Res Theor Nurs Pract. 2001; 15(3):189-207.
van der Bijl J, Van Poelgeest-eeltink A, Shortridge-Baggett L. The psychometric properties of
the diabetes management self-efficacy scale for patients with type 2 diabetes mellitus. J
Adv Nurs. 1999; 30:352–359.
Vivienne Wu SF, Courtney M, Edwards H. et al. Development and validation of the Chinese
version of the Diabetes Management Self-efficacy Scale. Int J Nurs Stud. 2008;
45(4):534-542.
World Health Organization. Global report on diabetes 2016.
doi:http://www.who.int/mediacentre/factsheets/fs312/en. Accessed October 2018.
37
implementation. Pract Diab Int. 2006; doi:doi: 10.1002/pdi.993.
Young-Hyman D, De Groot M, Hill-Briggs F, Gonzalez JS. Psychosocial care for people
with diabetes: a position statement of the American Diabetes Association. Diabetes Care.
2016; 39(12): 2126-2140. .
38
TABLES AND FIGURES
Table 1. Comments to items during pilot administration
Items Comments
2, 3 (1) people who do not have access to blood glucose monitors may just have the feeling of having high or low;
(2) people guess whether their blood glucose is low or high based on expected or unknown symptoms; (3) people guess how to cope with these possible symptoms by changing food intake or insulin intake; (4) Never experienced a low glucose so they never had to correct it.
4 “even if I am able to choose correct foods for my health, doesn’t mean that I do it because I am greedy” 7 Someone did not understand the term ‘when I am ill’, was clarified using examples like “when you have a high temperature”.
11, 12 It was necessary to explain the difference between following a healthy diet when eating outside the home (in a place that the person chooses) or eating out in places that the person does not choose (eg parties, birthdays where the person cannot choose what to eat).
39
TABLES AND FIGURES
Table 2. Demographic and clinical characteristics of study participants (N=165) and scales measuring self-efficacy, depression, diabetes distress and well-being.
Characteristics N(%) or mean±SD
Gender
Males 110 (66.7%)
Female 55 (33.3%)
Age (years) (mean±SD) 65.2 ± 9 (range 35-80)
Living situation With a spouse/partner 114 (79.7%) With parents 7 (4.9) Alone 22 (15.4%) Level of education Elementary school Middle school 54 (33.1%) 63 (38.7%) High school 34 (20.9%)
College and above 12 (7.4%)
No. of years since diagnosed with diabetes, no. (%) <1 year 1-15 years >15 years 11 (6.9%) 91 (56.9%) 58 (36.3%) Occupational status Employed Retired Unemployed 40 (24.2%) 118 (71.5%) 2 (1.2%) Weight classification Normal weight 20 (12.1%) Overweight 51 (30.9%) Obese 94 (57.0%) HbA1c ̽ (mean±SD) 57.28±10.3 HbA1c ≤53mmol/mol 61 (37%) HbA1c >53mmol/mol 104 (63%) Treatment regimen Diet/exercise only 10 (6.1%)
Oral hypoglycemic agent 71 (43%)
Insulin 11 (6.7%)
Oral hypoglycemic agent + insulin 73 (44.2%)
Co-morbidities
Hypertension 126 (76.4%)
Thyroid disease 45 (27.3%)
Dyslipidemia 141 (85.5%)
Ischemic heart disease 33 (20%)
Complications
Kidney disease 23 (13.9%)
40
Neurological disease 21 (12.7%)
Foot complications 2 (1.2%)
Peripheral circulatory complications 12 (7.3%)
DMSES scores *
Mean DMSES 1 factor score 8.53±1.63
Mean DMSES 2 factor score 6.83±1.76
PHQ-9 score† No depression Mild depression 99 (62.7%) 40 (25.2%) Moderate depression 17 (10.8%)
Moderately severe depression 2 (1.3%)
Mean PAID-5 score ‡ 39.32 ± 27.14
Cut-off ≥40 (elevated diabetes distress) 83 (51.2%)
Mean WHO-5 score § 63.43 ± 21.21
Good psychological well-being 118 (74.2%)
Poor psychological well-being Likely depression
28 (17.6%) 13 (8.2%) *HbA1c values: generic target, not modified on patient characteristics. Missing values: 22 living situation; 2 level of education; 5 n. of years since diagnosed with diabetes; 5 occupational status;
Abbreviations: DMSES, Diabetes Management Self-Efficacy Scale; PHQ-9, Patient Health Questionnaire; PAID-5, the Problem Areas in Diabetes-Short Form; WHO-5, Well-Being Index.
41
TABLES AND FIGURES
Table 3. Factor loadings of the two factors extracted using principal component analysis with promax rotation. Factor 1 Disease Management Factor 2 Lifestyle Management DM1- Check my blood sugar where necessary .747
DM2 - Correct my blood sugar when the sugar level is too
high .731
DM3 - Correct my blood sugar when the blood
sugar level is too low .789
DM4 - Choose the correct foods .714
DM5 - Keep my weight under control .732
DM6 - Examine my feet for cuts .415 .322
DM7 - Adjust my eating plan when ill .359 .444
DM8 - Follow a healthy eating pattern most of the
time .826
DM9 - Take more exercise if the doctor advises me to .753 DM10 - When taking more exercise I am able to
adjust my eating plan .573
DM11 - Follow a healthy eating pattern when I am
away from home .865
DM12 - Follow a healthy eating pattern when I am
eating out or at a party .844
DM13 - Adjust my eating plan when I am feeling stressed
or anxious .638
DM14 - Take my medication as prescribed .814
42
TABLES AND FIGURES
Table 4. Weights of the all items for the IT-DMSES scoring.
Components Lifestyle Disease DM1 -.006 .211 DM2 .024 .206 DM3 .006 .222 DM4 .146 .025 DM5 .151 -.021 DM6 .064 .116 DM7 .090 .099 DM8 .170 -.004 DM9 .155 -.019 DM10 .117 .046 DM11 .179 -.045 DM12 .174 -.047 DM13 .131 .035 DM14 -.031 .230 DM15 -.040 .246
43
TABLES AND FIGURES
Table 5. Socio-demographic and clinical characteristics of study participants (N=411).
† t-test; ^ chi-square type 1
(n=105)
type 2 (n=306)
Comparison between type 1 and 2 diabetes Test, p Female (%) 49.5 37.2 4.89 (0.027)^ Age (mean ± SD) 45.1±17.4 65.1±9.5 -14.80 (<0.001)† Employed (%) 62.9 26.9 43.55 (<0.001)^ BMI (mean ± SD) 24.4±3.7 30.3±5.6 -9.78 (<0.001)†
HbA1c mmol/mol (mean ± SD) 59.1±10.6 58.6±13.7 0.36 (0.720)† HbA1c % (mean ± SD) 7.6±1.0 7.5±1.2 0.35 (0.723)† Education (%) 54.70 (<0.001)^ Elementary school 7.6 26.3 Middle school 14.3 36.2 High school 46.7 26.3
College and above 31.4 11.2
Duration of diabetes diagnosis (%) 25.08 (<0.001)^ <1 year 1.9 4.6 1-15 years 28.6 54.1 >15 years 69.5 41.2 Living condition (%) 24.68 (<0.001)^ Alone 17.1 14.7 With a spouse/partner 58.1 70.3 With parents 20.9 5.6 Other/unknown 3.8 9.5 Treatment regimen (%) Diet/exercise only 0.0 3.6 3.88 (0.049)^
Oral hypoglycemic agent 0.0 42.2 64.51 (<0.001)^
Insulin 93.3 10.5 248.29 (<0.001)^
Oral hypoglycemic agent + insulin 6.7 43.8 47.81 (<0.001)^ Co-morbidities (%) Thyroid disease 14.3 17.5 0.58 (0.447)^ Hypertension 18.1 71.0 89.54 (<0.001)^ Dyslipidemia 11.4 58.5 69.62 (<0.001)^
Ischemic heart disease 9.5 25.7 12.03 (0.001)^
Complications (%) Kidney disease 4.8 14.5 6.98 (0.008)^ Eye damage 40.0 23.4 10.81 (0.001)^ Neurological disease 14.3 13.2 0.08 (0.770)^ Foot complications 7.6 3.9 5.26 (0.072)^ Peripheral circulatory complications 3.8 6.6 1.07 (0.301)^
44
TABLES AND FIGURES
Table 6. Gender differences in type 1 and type 2 diabetes (n=411 patients).
^ Chi-square test; † T-test
Males Type 2 Diabetes (n=192) Females Type 2 Diabetes (n=114) Comparison Test, p Males Type 1 Diabetes (n=53) Females Type 1 Diabetes (n=52) Comparison Test, p Age (mean ± SD) 65.6±9.2 64.4±9.9 1.13 (0.259)† 43.7±18.0 46.5±16.8 -0.82 (0.411)† Employed (%) 25.9 28.6 0.25 (0.617)^ 67.9 57.7 1.18 (0.278)^ BMI (mean ± SD) 30.3±5.2 30.4±6.7 -0.21(0.833)† 25.0±3.3 23.8±4.0 1.68 (0.096)† HbA1c mmol/mol (mean ± SD) 58.0±12.5 59.6±15.6 -1.02 (0.309)† 55.5±10.2 62.7±9.7 -3.69(<0.001)† HbA1c % (mean ± SD) 7.4±1.1 7.6±1.4 -1.01 (0.314)† 7.2±0.9 7.9±0.9 -3.66 (<0.001)† Education (%) 3.59 (0.309)^ 3.58 (0.311)^ Elementary school 24.1 30.1 5.7 9.6 Middle school 35.1 38.0 17.0 11.5 High school 29.8 20.3 52.8 40.4 College and above 11.0 11.5 24.5 38.5 Duration of diabetes (%) 0.90 (0.635)^ 2.00 (0.367)^ <1 year 5.3 3.5 3.8 0.0 1-15 years 55.2 52.6 28.3 28.8 >15 years 39.6 43.9 67.9 71.1 Living condition (%) 0.83 (0.842)^ 1.90 (0.594)^ Alone 14.6 14.9 20.7 13.5 With a spouse/partner 71.3 68.4 56.6 59.6 With parents 5.7 5.3 20.7 21.1 Other 8.3 11.4 1.9 5.8 Treatment regimen (%) Diet/exercise 5.2 0.9 3.87 (0.050)^ 0.0 0.0 Oral hypo. 38.5 48.2 2.76 (0.100)^ 0.0 0.0 Oral hypo. + Insulin 42.2 46.5 0.54 (0.463)^ 5.7 7.7 0.17 (0.676)^ Insulin 14.1 4.4 7.15 (0.007)^ 94.3 92.3 0.17 (0.676)^ Co-morbidities (%) Thyroid disease 11.6 27.2 11.92(0.001)^ 5.7 23.1 6.50 (0.011)^ Hypertension 72.1 69.3 0.27 (0.601)^ 20.7 15.4 0.51 (0.475)^ Dyslipidemia 64.1 49.1 6.57 (0.010)^ 9.4 13.5 0.42 (0.517)^ Ischemic heart disease 33.7 12.3 17.11(<0.001)^ 7.5 11.5 0.48 (0.486)^ Complications (%) Kidney disease 18.9 7.0 8.19 (0.004)^ 5.7 3.8 0.19 (0.663)^ Eye damage 22.6 24.6 0.15 (0.700)^ 39.6 40.4 0.01 (0.936)^ Neurological dis. 16.8 7.0 6.01 (0.015)^ 15.1 13.5 0.06 (0.811)^ Foot 4.7 2.6 0.82 (0.370)^ 9.4 5.8 1.53 (0.465)^ Periph. circulatory 9.4 1.8 6.71 (0.010)^ 1.9 5.8 1.08 (0.299)^
45
TABLES AND FIGURES
Figure 1. IT-DMSES items scores. All items indicate high level of diabetes management self-efficacy except for item 12 ‘follow a healthy eating pattern when I am eating out or at a party’.
46
TABLES AND FIGURES
Figure 2. Network of self-efficacy IT-DMSES items for type 1 (on the left) and type 2 diabetes (on the right) and centrality indices (panel C: red line= type 1 diabetes; blue line= type 2 diabetes).
47
TABLES AND FIGURES
Figure 3. Network of self-efficacy IT-DMSES items for males (on the left) and females (on the right) in type 2 diabetes and centrality indices (blue line=females; red line=males).
48
TABLES AND FIGURES
Supplementary Figure 1. Network of self-efficacy IT-DMSES items for females (on the left) and males (on the right) in type 1 diabetes and centrality indices (blue line=females; red line=males).
49 SUPPLEMENTARY MATERIALS
Supplementary material 1. DMSES-UK
Self-Efficacy (or confidence) Questionnaire for people living with type 2 diabetes. Directions
Below is a list of activities you have to perform to manage your diabetes. Please read each one and then put a line [/] through the number which best describes how confident you usually are that you could carry out that activity.
For example, if you are completely confident that you are able to check your blood sugar levels when nessessary, put a line through 10. If you feel that most of the time you could not do it, put a line through 1 or 2. I am confident that … Cannot do At all Maybe yes Maybe no Certain can do 1
I am able to check my blood sugar if necessary
0 1 2 3 4 5 6 7 8 9 10
2
I am able to correct my blood sugar when the sugar level is too high
0 1 2 3 4 5 6 7 8 9 10
3
I am able to correct my blood sugar when the blood sugar level is too low
0 1 2 3 4 5 6 7 8 9 10
4
I am able to choose the correct foods
0 1 2 3 4 5 6 7 8 9 10
5
I am able to keep my weight under control
0 1 2 3 4 5 6 7 8 9 10 6
I am able to examine my feet for cuts
0 1 2 3 4 5 6 7 8 9 10
7
I am able to adjust my eating plan when ill
50 I am confident that …
8
I am able to follow a healthy eating pattern most of the time
0 1 2 3 4 5 6 7 8 9 10
9
I am able to take more exercise if the doctor advises me to
0 1 2 3 4 5 6 7 8 9 10
10
When taking more exercise I am able to adjust my eating plan
0 1 2 3 4 5 6 7 8 9 10
11
I am able to follow a healthy eating pattern when I am away from home
0 1 2 3 4 5 6 7 8 9 10
12
I am able to follow a healthy eating pattern when I am eating out or at a party
0 1 2 3 4 5 6 7 8 9 10
13
I am able to adjust my eating plan when I am feeling stressed or anxious
0 1 2 3 4 5 6 7 8 9 10
14
I am able to take my medication as prescribed
0 1 2 3 4 5 6 7 8 9 10
15 I am able to adjust my medication when I am ill
0 1 2 3 4 5 6 7 8 9 10
Sturt J, Hearnshaw H & Wakelin M. Validity and reliability of the DMSES UK: a measure of
self-efficacy for type 2 diabetes self-management. Primary Health Care Research and