2020-08-06T10:12:25Z
Acceptance in OA@INAF
3FHL: The Third Catalog of Hard Fermi-LAT Sources
Title
Ajello, M.; Atwood, W. B.; Baldini, L.; Ballet, J.; Barbiellini, G.; et al.
Authors
10.3847/1538-4365/aa8221
DOI
http://hdl.handle.net/20.500.12386/26702
Handle
THE ASTROPHYSICAL JOURNAL SUPPLEMENT SERIES
Journal
232
3FHL: The Third Catalog of Hard
Fermi-LAT Sources
M. Ajello1 , W. B. Atwood2, L. Baldini3 , J. Ballet4 , G. Barbiellini5,6, D. Bastieri7,8 , R. Bellazzini9 , E. Bissaldi10,11 , R. D. Blandford12, E. D. Bloom12, R. Bonino13,14, J. Bregeon15, R. J. Britto16, P. Bruel17, R. Buehler18, S. Buson19,62,
R. A. Cameron12, R. Caputo20, M. Caragiulo10,11, P. A. Caraveo21, E. Cavazzuti22, C. Cecchi23,24, E. Charles12 , A. Chekhtman25 , C. C. Cheung26 , G. Chiaro8, S. Ciprini22,23, J. M. Cohen19,27, D. Costantin8, F. Costanza11, A. Cuoco13,28,
S. Cutini22,23, F. D’Ammando29,30, F. de Palma11,31, R. Desiante13,32 , S. W. Digel12, N. Di Lalla3, M. Di Mauro12, L. Di Venere10,11, A. Domínguez33 , P. S. Drell12, D. Dumora34, C. Favuzzi10,11, S. J. Fegan17, E. C. Ferrara19, P. Fortin35, A. Franckowiak18, Y. Fukazawa36, S. Funk37, P. Fusco10,11, F. Gargano11 , D. Gasparrini22,23, N. Giglietto10,11, P. Giommi22,
F. Giordano10,11, M. Giroletti29 , T. Glanzman12 , D. Green19,27, I. A. Grenier4, M.-H. Grondin34, J. E. Grove26, L. Guillemot38,39, S. Guiriec19,62 , A. K. Harding19, E. Hays19, J. W. Hewitt40, D. Horan17, G. Jóhannesson41,42, S. Kensei36,
M. Kuss9 , G. La Mura8, S. Larsson43,44, L. Latronico13, M. Lemoine-Goumard34 , J. Li45, F. Longo5,6, F. Loparco10,11, B. Lott34, P. Lubrano23, J. D. Magill27, S. Maldera13 , A. Manfreda3, M. N. Mazziotta11 , J. E. McEnery19,27, M. Meyer44,46, P. F. Michelson12, N. Mirabal19,62 , W. Mitthumsiri47, T. Mizuno48 , A. A. Moiseev20,27, M. E. Monzani12 , A. Morselli49,
I. V. Moskalenko12, M. Negro13,14, E. Nuss15, T. Ohsugi48, N. Omodei12 , M. Orienti29, E. Orlando12, M. Palatiello5,6, V. S. Paliya1 , D. Paneque50, J. S. Perkins19, M. Persic5,51, M. Pesce-Rollins9 , F. Piron15, T. A. Porter12, G. Principe37,
S. Rainò10,11 , R. Rando7,8, M. Razzano9,63, S. Razzaque52, A. Reimer12,53, O. Reimer12,53, T. Reposeur34,
P. M. Saz Parkinson2,54,55, C. Sgrò9 , D. Simone11, E. J. Siskind56, F. Spada9, G. Spandre9, P. Spinelli10,11, L. Stawarz57 , D. J. Suson58, M. Takahashi50, D. Tak19,27, J. G. Thayer12, J. B. Thayer12, D. J. Thompson19, D. F. Torres45,59 , E. Torresi60,
E. Troja19,27 , G. Vianello12 , K. Wood61, and M. Wood12
1
Department of Physics and Astronomy, Clemson University, Kinard Lab of Physics, Clemson, SC 29634-0978, USA;[email protected]
2
Santa Cruz Institute for Particle Physics, Department of Physics and Department of Astronomy and Astrophysics, University of California at Santa Cruz, Santa Cruz, CA 95064, USA
3Università di Pisa and Istituto Nazionale di Fisica Nucleare, Sezione di Pisa I-56127 Pisa, Italy 4
Laboratoire AIM, CEA-IRFU/CNRS/Université Paris Diderot, Service d’Astrophysique, CEA Saclay, F-91191 Gif sur Yvette, France
5
Istituto Nazionale di Fisica Nucleare, Sezione di Trieste, I-34127 Trieste, Italy
6
Dipartimento di Fisica, Università di Trieste, I-34127 Trieste, Italy
7
Istituto Nazionale di Fisica Nucleare, Sezione di Padova, I-35131 Padova, Italy
8
Dipartimento di Fisica e Astronomia“G. Galilei,” Università di Padova, I-35131 Padova, Italy
9
Istituto Nazionale di Fisica Nucleare, Sezione di Pisa, I-56127 Pisa, Italy
10
Dipartimento di Fisica“M. Merlin” dell’Università e del Politecnico di Bari, I-70126 Bari, Italy
11
Istituto Nazionale di Fisica Nucleare, Sezione di Bari, I-70126 Bari, Italy
12
W. W. Hansen Experimental Physics Laboratory, Kavli Institute for Particle Astrophysics and Cosmology, Department of Physics and SLAC National Accelerator Laboratory, Stanford University, Stanford, CA 94305, USA
13Istituto Nazionale di Fisica Nucleare, Sezione di Torino, I-10125 Torino, Italy 14
Dipartimento di Fisica, Università degli Studi di Torino, I-10125 Torino, Italy
15
Laboratoire Univers et Particules de Montpellier, Université Montpellier, CNRS/IN2P3, F-34095 Montpellier, France
16
Department of Physics, University of the Free State, P.O. Box 339, Bloemfontein 9300, South Africa
17
Laboratoire Leprince-Ringuet, École polytechnique, CNRS/IN2P3, F-91128 Palaiseau, France
18
Deutsches Elektronen Synchrotron DESY, D-15738 Zeuthen, Germany
19
NASA Goddard Space Flight Center, Greenbelt, MD 20771, USA
20
Center for Research and Exploration in Space Science and Technology(CRESST) and NASA Goddard Space Flight Center, Greenbelt, MD 20771, USA
21
INAF-Istituto di Astrofisica Spaziale e Fisica Cosmica Milano, via E. Bassini 15, I-20133 Milano, Italy
22
Agenzia Spaziale Italiana(ASI) Science Data Center, I-00133 Roma, Italy;[email protected]
23
Istituto Nazionale di Fisica Nucleare, Sezione di Perugia, I-06123 Perugia, Italy
24
Dipartimento di Fisica, Università degli Studi di Perugia, I-06123 Perugia, Italy
25
College of Science, George Mason University, Fairfax, VA 22030, resident at Naval Research Laboratory, Washington, DC 20375, USA
26
Space Science Division, Naval Research Laboratory, Washington, DC 20375-5352, USA
27
Department of Physics and Department of Astronomy, University of Maryland, College Park, MD 20742, USA
28
RWTH Aachen University, Institute for Theoretical Particle Physics and Cosmology,(TTK), D-52056 Aachen, Germany
29
INAF Istituto di Radioastronomia, I-40129 Bologna, Italy
30
Dipartimento di Astronomia, Università di Bologna, I-40127 Bologna, Italy
31
Università Telematica Pegaso, Piazza Trieste e Trento, 48, I-80132 Napoli, Italy
32
Università di Udine, I-33100 Udine, Italy
33
Grupo de Altas Energías, Universidad Complutense de Madrid, E-28040 Madrid, Spain;[email protected]
34
Centre d’Études Nucléaires de Bordeaux Gradignan, IN2P3/CNRS, Université Bordeaux 1, BP120, F-33175 Gradignan Cedex, France;[email protected]
35
Harvard-Smithsonian Center for Astrophysics, Cambridge, MA 02138, USA;[email protected]
36
Department of Physical Sciences, Hiroshima University, Higashi-Hiroshima, Hiroshima 739-8526, Japan
37
Erlangen Centre for Astroparticle Physics, D-91058 Erlangen, Germany
38Laboratoire de Physique et Chimie de l’Environnement et de l’Espace—Université d’Orléans/CNRS, F-45071 Orléans Cedex 02, France 39
Station de radioastronomie de Nançay, Observatoire de Paris, CNRS/INSU, F-18330 Nançay, France
40
University of North Florida, Department of Physics, 1 UNF Drive, Jacksonville, FL 32224, USA
41
Science Institute, University of Iceland, IS-107 Reykjavik, Iceland
42
Nordita, Roslagstullsbacken 23, 106 91 Stockholm, Sweden
43
Department of Physics, KTH Royal Institute of Technology, AlbaNova, SE-106 91 Stockholm, Sweden
44
The Oskar Klein Centre for Cosmoparticle Physics, AlbaNova, SE-106 91 Stockholm, Sweden
45
Institute of Space Sciences(IEEC-CSIC), Campus UAB, Carrer de Magrans s/n, E-08193 Barcelona, Spain
46
Department of Physics, Stockholm University, AlbaNova, SE-106 91 Stockholm, Sweden
47Department of Physics, Faculty of Science, Mahidol University, Bangkok 10400, Thailand 48
Hiroshima Astrophysical Science Center, Hiroshima University, Higashi-Hiroshima, Hiroshima 739-8526, Japan
49
Istituto Nazionale di Fisica Nucleare, Sezione di Roma“Tor Vergata,” I-00133 Roma, Italy
50
Max-Planck-Institut für Physik, D-80805 München, Germany
51
Osservatorio Astronomico di Trieste, Istituto Nazionale di Astrofisica, I-34143 Trieste, Italy
52
Department of Physics, University of Johannesburg, P.O. Box 524, Auckland Park 2006, South Africa
53
Institut für Astro- und Teilchenphysik and Institut für Theoretische Physik, Leopold-Franzens-Universität Innsbruck, A-6020 Innsbruck, Austria
54
Department of Physics, The University of Hong Kong, Pokfulam Road, Hong Kong, China
55
Laboratory for Space Research, The University of Hong Kong, Hong Kong, China
56NYCB Real-Time Computing Inc., Lattingtown, NY 11560-1025, USA 57
Astronomical Observatory, Jagiellonian University, 30-244 Kraków, Poland
58
Department of Chemistry and Physics, Purdue University Calumet, Hammond, IN 46323-2094, USA
59
Institució Catalana de Recerca i Estudis Avançats(ICREA), E-08010 Barcelona, Spain
60
INAF-Istituto di Astrofisica Spaziale e Fisica Cosmica Bologna, via P. Gobetti 101, I-40129 Bologna, Italy
61
Praxis Inc., Alexandria, VA 22303, resident at Naval Research Laboratory, Washington, DC 20375, USA Received 2017 April 23; revised 2017 June 29; accepted 2017 July 11; published 2017 September 27
Abstract
We present a catalog of sources detected above 10 GeV by the Fermi Large Area Telescope(LAT) in the first 7 years of data using the Pass 8 event-level analysis. This is the Third Catalog of Hard Fermi-LAT Sources(3FHL), containing 1556 objects characterized in the 10 GeV–2 TeV energy range. The sensitivity and angular resolution are improved by factors of 3 and 2 relative to the previous LAT catalog at the same energies (1FHL). The vast majority of detected sources(79%) are associated with extragalactic counterparts at other wavelengths, including 16 sources located at very high redshift (z > 2). Of the sources, 8% have Galactic counterparts and 13% are unassociated(or associated with a source of unknown nature). The high-latitude sky and the Galactic plane are observed with aflux sensitivity of 4.4 to 9.5×10⁻¹¹phcm−2s−1, respectively(this is approximately 0.5% and 1% of the Crab Nebulaflux above 10 GeV). The catalog includes 214 new γ-ray sources. The substantial increase in the number of photons(more than 4 times relative to 1FHL and 10 times to 2FHL) also allows us to measure significant spectral curvature for 32 sources and find flux variability for 163 of them. Furthermore, we estimate that for the sameflux limit of 10−12ergcm−2s−1, the energy range above 10 GeV has twice as many sources as the range above 50 GeV, highlighting the importance, for future Cherenkov telescopes, of lowering the energy threshold as much as possible.
Key words: catalogs– gamma rays: general Supporting material: FITS file
1. Introduction
The Large Area Telescope (LAT, Atwood et al. 2009) on
board the Fermi Gamma-ray Space Telescope has revolutio-nized our understanding of the high-energy sky. The latest release of the broadband all-sky LAT catalog (i.e., the Third Catalog of Fermi-LAT Sources, or 3FGL, Acero et al. 2015)
characterizes 3033 objects in the energy range 0.1–300 GeV from thefirst 4 years of LAT science data. Since the sensitivity of the instrument peaks at about 1 GeV, the 3FGL necessarily favors sources that are brightest in the GeV energy range.
The Fermi-LAT collaboration has also released two hard-source catalogs that were produced using analyses optimized for energies greater than tens of GeV. The First Catalog of Hard Fermi-LAT Sources (1FHL, Ackermann et al. 2013)
describes 514 sources detected above 10 GeV from thefirst 3 years of LAT data. Additionally, the Second Catalog of Hard Fermi-LAT Sources (2FHL, Ackermann et al.2016b) reports
the properties of 360 sources detected above 50 GeV from the first 80 months of data. The 2FHL was the first LAT catalog to take advantage of the latest event-level analysis(Pass 8), which provides significant improvements in event reconstruction and classification. Pass8 increases the sensitivity, improves the angular resolution, and also extends the useful energy range of
the instrument up to 2 TeV (Atwood et al. 2013). The 2FHL
was intended to close the energy gap between previous Fermi-LAT catalogs and the range of the current generation of Imaging Atmospheric Cherenkov Telescopes(IACTs).
In addition to serving as references for works on individual sources (e.g., Aleksić et al. 2014), these LAT hard-source
catalogs have been instrumental in providing promising candidates for detection by IACTs (e.g., Abeysekara
2015), enabling the search for plausible γ-ray counterparts of
IceCube high-energy neutrinos (e.g., Aartsen et al. 2016; Padovani et al.2016), triggering studies on unidentified sources
(Domainko2014), and enabling new studies on the extragalactic
background light (Domínguez & Ajello 2015), which yielded
constraints on the extragalactic γ-ray background (Broderick et al. 2014; Ackermann et al. 2016a), and on the proton
component of ultra-high-energy cosmic rays(Berezinsky et al.
2016).
The Third Catalog of Hard Fermi-LAT Sources (3FHL) is the latest addition to the Fermi-LAT catalogs and reports on sources detected at energies above 10 GeV. The 3FHL is constructed from the first 7 years of data and takes full advantage of the improvements provided by Pass8 using the point-spread function(PSF)-type event classification,64 which improves the sensitivity.
62
NASA Postdoctoral Program Fellow, USA.
63
Funded by contract FIRB-2012-RBFR12PM1F from the Italian Ministry of Education, University and Research(MIUR).
64
A measure of the quality of the direction reconstruction is used to assign events to four quartiles.
In this work, we do not look for new extended sources but explicitly model sources as spatially extended sources previously resolved by the LAT along with those recently found by Ackermann et al. (2017). Given that the Cherenkov
Telescope Array(CTA) is expected to have an energy threshold below 50 GeV (Acharya et al.2013), the 3FHL catalog offers
an excellent opportunity to relate observations from space and those that will be possible in the near future from the ground. This paper is organized as follows. Section 2 describes the methodology used to detect sources in the LAT data and to associate these sources with known astrophysical objects at other energies. Then, Section3gives details on the structure of the 3FHL catalog and describes its main properties in the Galactic and extragalactic sky, and gives details on the newly discovered γ-ray sources. In Section 3, we also discuss flux variability. Finally, we conclude in Section4.
2. Analysis
In this section, we present our methodology for extracting the high-level information provided in the catalog from the γ-ray event-level Fermi-LAT data.
2.1. Data Selection and Software
The current version of the Fermi-LAT data is Pass 8 (Atwood et al. 2013). For this study we have selected Source
class events in the energy range from 10 GeV to 2 TeV. Adopting a 10 GeV threshold, as was done in the 1FHL catalog (Ackermann et al.2013), provides the benefits of a narrow PSF,
with per-photon angular resolution from 0°.15 at 10 GeV to less than 0°.1 above 35 GeV (68% containment radius averaged over all event types),65 ensuring minimal confusion and low background at the PSF scale. In that range the sensitivity of the LAT observations is limited by statistics only. We used the PSF event types appropriate for each event, to obtain the best source localizations.
We analyzed seven years of data, from 2008 August 4 to 2015 August 2 (Fermi mission elapsed time 239,557,417 to 460,250,000 s). In addition to the ∼16% of real time lost when passing through the South Atlantic Anomaly andother inter-ruptions, we have excised small intervals around bright GRBs, solarflares, and bad data, resulting in 182,870,410 s (5.8 years) of good time intervals. To limit contamination from the γ-ray-bright Earth limb, we enforced a selection on zenith angle (<105°) and applied a very weak constraint on rocking angle (<90°). The scanning mode results in maximum exposure near the north celestial pole (4.3 × 10⁷ m2s at 10 GeV) and minimum exposure on the celestial equator(2.6 × 10⁷m2s).
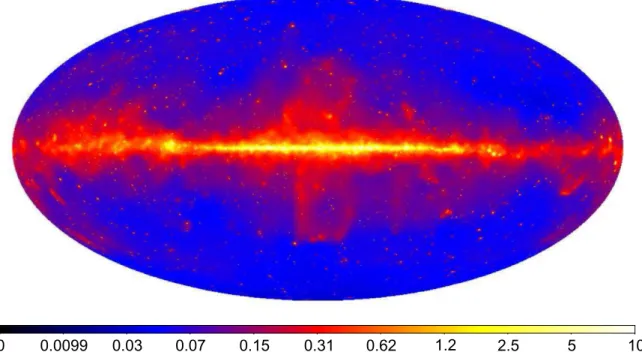
The analyzed data contain 699,582 photons at energies above 10 GeV. This is about a factor of 10 more photons than are above 50 GeV in the 2FHL(60,978 photons) and more than 4 times the number in the 1FHL above 10 GeV (162,812 photons). Figure 1shows the all-sky counts map, which has been smoothed.
We used the P8R2_Source_V6 instrument response func-tions. We used the same models of Galactic diffuse emission and extragalactic isotropic emission as used in the 3FGL analysis, adapted to Pass 8 data and extrapolated(linearly in the logarithm) up to 2 TeV. They are available from the Fermi Science Support Center (FSSC) as gll_iem_v06.fits
(Galactic) and iso_P8R2_SOURCE_V6_v06.txt (isotro-pic). We also used the same model as in 3FGL for the contributions from the γ-ray emissions of the Sun and Moon near the ecliptic plane (although their contribution above 10 GeV is very minor).
We undertook the LAT analysis using the standard pyLikelihood framework (Python analog of gtlike) in the LAT Science Tools66(version v11r4). Throughout the text we use the Test Statistic TS=2 Dlog (Mattox et al. 1996),
comparing the likelihood function optimized with and without a given source, for quantifying how significantly a source emerges from the background.
2.2. Source Detection
At the high energies considered here the width of the LAT PSF does not depend strongly on energy and the point-source detection is limited by source counts more than background, so we used image-based source detection techniques on counts maps integrated over all energies and event types. The algorithm we used (mr_filter) is based on a wavelet analysis in the Poisson regime (Starck & Pierre 1998). We set the
threshold to 2σ in the False Discovery Rate mode. It returns a map of significant features on which we ran the peak-finding algorithm SExtractor(Bertin & Arnouts1996) to generate a list
of source candidates (hereafter seeds). We also used another wavelet algorithm(PGWave, Damiani et al.1997; Ciprini et al.
2007), which differs in the detailed implementation and returns
directly a list of seeds(the threshold was set to 3σ). Simulations indicated that the latter was somewhat more sensitive on aflat background but did not work as well in the Galactic plane. We merged the two seed lists, eliminating duplicates within 0°.2.
Since those methods work in Cartesian coordinates, we paved the sky with 26 projections in Galactic coordinates: 6 CAR (plate carrée) projections along the Galactic plane covering Galactic latitudes (b) from b = −10° to +10°, 6 AIT (Hammer–Aitoff) projections on each side of the plane covering b= 10° to 45°, and 4 CAR projections covering b= 45° to 90° in four quadrants around each pole. Each map is 5° larger on each side than the area from which the seeds are extracted, to avoid border effects. The pixel size was set to 0°.05, comparable to the FWHM of the PSF at high energy (the 68% containment radius is greater than 0°.09 up to 300 GeV). Next, we added seeds in the Galactic plane from the search for extended Galactic sources above 10 GeV(Ackermann et al.
2017), as well as seeds derived in preparatory work for the next
general LAT source catalog over all energies. The full list comprised 3730 seeds. Compared to the single mr_filter method, adding seeds from those parallel studies and PGWave resulted in nearly 1000 more seeds, but only 24 (<2%) more sources in thefinal list of significant sources (Section2.4).
The source density at b∣ ∣ >10is 0.036 sources per square degree(after TS selection in Section2.4). Since the 68% PSF
containment radius is better than 0°.15, confusion is rather limited. A standard plot showing the distribution of distance between sources (such as Figure 13 of Acero et al. 2015)
indicates that this catalog has missed about 20 (<2%) high-latitude sources within 0°.4 of another one. In the Galactic plane the confusion is worse because many sources are extended.
65http://www.slac.stanford.edu/exp/glast/groups/canda/lat_
Performance.htm
66
Seehttp://fermi.gsfc.nasa.gov/ssc/data/analysis/documentation/ Cicerone/
2.3. Localization
The position of each source was determined by maximizing the likelihood starting from the seed position, using gtfindsrc. We used gtfindsrc rather than pointlike (used in 3FGL) in order to benefit from the full power of PSF event types introduced in Pass 8. The gtfindsrc tool works in unbinned mode, automatically selecting the appropriate PSF for each event as a function of its event type and off-axis angle(the PSF broadens at large off-axis angles). The gtfindsrc run was integrated into the main iterative procedure (Section 2.4), starting with the
brightest sources. This ensures that the surrounding sources were correctly represented. The main drawback is that gtfindsrc provides only a symmetric (circular) error radius, assuming a Gaussian distribution, not the full TS map and an ellipse as pointlike does. There is no reason to believe that this is a serious limitation. For example, in 3FGL the average ratio between the two axes of the error ellipses was 1.20, so most ellipses were close to circular. At higher energies(1FHL) this ratio was even smaller, 1.12.
The systematic uncertainties associated with localization were not calibrated on 3FHL itself, but on the larger(and more precise) preliminary source list derived from an analysis over all energies greater than 100 MeV. The absolute precision at the 95% confidence level was found to be 0°.0075 (it was 0°.005 in 3FGL, but the statistical precision on localization was not good enough to constrain the absolute precision well). The systematic factor was found to be 1.05, as in 3FGL. We checked that the 3FHL localizations were consistent with the same values. Consequently, we multiplied all error estimates by 1.05 and added 0°.0075 in quadrature.
2.4. Significance and Spectral Characterization The framework for this stage of the analysis was inherited from the 3FGL catalog analysis pipeline(Acero et al.2015). It
splits the sky into regions of interest(RoIs), each with typically
half a dozen sources whose parameters are simultaneously optimized. The global best fit is reached iteratively, by including sources in the outer parts of the RoI from the neighboring RoIs at the previous step. Above 10 GeV the PSF is narrow, so the cross-talk is small and the iteration converges rapidly. The diffuse emission model had exactly one free normalization parameter per RoI(see theAppendixfor details). We used unbinned likelihood with PSF event types over the full energy range, neglecting energy dispersion. Extended sources(Section2.5) were treated just as point sources, except
for their spatial templates. Whenever possible, we applied the new RadialDisk and RadialGaussian analytic spatial templates for the likelihood calculation. They are not pixelized and hence are more precise than the map-based templates used in 3FGL. Sources were modeled by default with a power-law (PL) spectrum(two free parameters, a normalization and a spectral photon index). At the end of the iteration, we kept only sources with TS> 25 with the PL model, corresponding to a significance of just over 4σ evaluated from the χ2distribution with 4 degrees of freedom (position and spectral parameters, Mattox et al.1996). We also enforced a minimum number of
model-predicted events Npred 4 (only two sources were rejected because of this limit, and only two have Npred< 5). We ended up with 1556 sources with TS> 25, including 48 extended sources.
The alternative curved LogParabola(LP) spectral shape
dN dE K E E 1 E E 0 log 0 = a b -⎛ ⎝ ⎜ ⎞ ⎠ ⎟ ( ) ( )
was systematically tested, and adopted when
Signif_Curve= 2 ln(L(LP) L(PL)) >3, corresp-onding to 3-σ evidence in favor of the curved model (the threshold was 4σ in 3FGL). Among 1556 sources, only 6 were found to be significantly curved at the 4σ level. Lowering the threshold to 3σ added 26 curved sources, whereas an average
Figure 1.Adaptively smoothed Fermi-LAT counts map in the 10 GeV–2 TeV band represented in Galactic coordinates and Hammer–Aitoff projection. The image has been smoothed with a Gaussian kernel whose size was varied to achieve a minimum signal-to-noise ratio under the kernel of 2.3. The color scale is logarithmic and the units are counts per(0.1 deg)2pixel.
of 4.2 would be expected by chance. So most of the additional spectral curvatures between 3σ and 4σ are real. We iterated after changing a spectral shape or removing a source. Only 2% of the 3FHL sources were considered significantly curved. This does not mean that sources are less curved than they are over the full Fermi-LAT range(100 MeV–300 GeV), but only that it is more difficult to measure curvature over a restricted energy range and with limited statistics (>10 GeV). One of those 32 has upward curvature. This source is associated with the pulsar PSR J1418−6058, and that curvature marks the transition between the pulsar emission at lower γ-ray energies seen by Fermi-LAT(Abdo et al.2013) and the very high-energy γ-rays
from the pulsar wind nebula detected by H.E.S.S. (Aharonian et al.2006a).
Photon and energy fluxes in the 10 GeV–1 TeV band were obtained from the best spectral model. We chose to report fluxes up to 1 TeV because integrating the energy flux up to 2 TeV has larger uncertainty when the photon index is harder than 2. Uncertainties were obtained by linear error propagation from the original parameters. No systematic errors were included. Fluxes in five energy bands were extracted in the same way as in 3FGL. The energy limits were set to 10, 20, 50, 150, 500 GeV, and 2 TeV. The width of the energy bins(in the logarithm) increases with energy in order to partially compensate for the decrease of photons due to the falling source spectra. Systematic uncertainties are estimated to be 5% in the first three bands, then 9% and 15%.67 They are not included in thefive individual uncertainties.
As for 2FHL, we evaluated the probabilities that the photons near each source originated from the source using gtsrcprob, and found the highest-energy photon with a probability>85%.
2.5. Extended Sources
This work does not involve looking for new extended sources, or testing the possible extension of sources detected as point-like. As in the 3FGL catalog, we explicitly modeled as spatially extended those sources that had been shown in dedicated analyses to be resolved by the LAT.68 The spectral parameters of each extended source werefitted in the same way as those for point sources. We did not attempt to refit the spatial shapes. Because many of those extended sources are much broader than the PSF at 10 GeV, we allowed the addition of new seeds inside the extended sources when their radii were larger than 0°.4 (this differs from what was done at lower energies in 3FGL). Identified point sources (in practice, pulsars) were allowed in extended sources of any size.
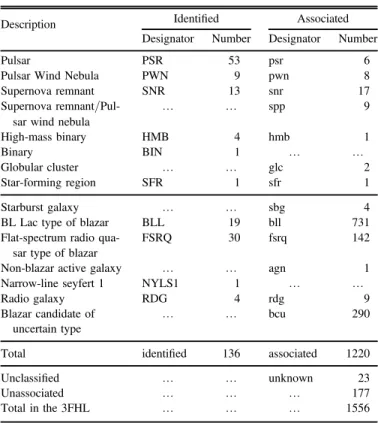
The 3FGL catalog considered 25 extended sources. Five more were introduced in the 2FHL catalog. Several descrip-tions of extended sources have been improved upon since then (see Table 1 for details). In particular, the Large Magellanic Cloud (LMC) is now represented by four independent components (but only the hard compact components are detected above 10 GeV, not the large one at the scale of the entire galaxy). The RCW 86 and RX J1713.7−3946 supernova remnants(SNRs) also benefited from new templates. The W 41 template was corrected(an error made 2FHL J1834.5−0846e too narrow). A new extragalactic extended source was reported
in the lobes of the Fornax A radio galaxy. Two(G296.5+10.0 and MSH 15−56 = G326.3−1.8) were taken from the systematic study of Galactic SNRs.
A recent comprehensive search for extended sources above 10 GeV in the Galactic plane( b∣ ∣< 7 , Ackermann et al.2017)
resulted in 46 detections, all represented as disks. Of those, 11 are new, and were entered as such in 3FHL(sources numbered FGES J1745.8−3028, J1857.7+0246, J2301.9+5855, J1023.3 −5747, J1036.3−5833, J1213.3−6240, J1409.1−6121, J1507.9−6228, J1553.8−5325, J1652.2−4633, J1655.5 −4737). FGES J1745.8−3028 was flagged in their work because the disk size was unstable with respect to the underlying diffuse model. We introduced it anyway, because it appears very significant (TS = 114) and preferred to two point sources. The 35 other detections coincide with previously detected extended sources. We switched to the new description only when it was clearly warranted, i.e., thefit was improved by DlogL>15+ , where p is the number of additionalp
parameters, as in the Akaike criterion(Akaike1974). We also
kept the previous Gaussian template of the IC 443 SNR because it is closer to the radio SNR than the two disks in the FGES representation and allows the collection of all theflux into a single source, even though it exceeds the above criterion. Only one Galactic source not detected in FGES appears in 3FHL. This is the Cygnus Loop, which has TS just above threshold, and can be easily understood because Ackermann et al. (2017) analyzed only six years of data instead of
seven here.
Thirteen extended source templates were abandoned in favor of thefitted disk representations:
1. W 28 is represented by the broader disk FGES J1800.5 −2343, which encompasses the four sources found outside the SNR (Hanabata et al.2014). Three of those
sources were too faint to be recovered individually by the point-source detection algorithm. The brightest peak in W 28 proper, as well as the brightest outer peak(HESS J1800−240 B), were detected as individual point sources on top of FGES J1800.5−2343.
2. W 30 is represented by the disk FGES J1804.7−2144, shifted by about 0°.2 with respect to the 3FGL disk. There is no doubt that the emission around 1 GeV, which is close to the SNR(Ajello et al.2012), is not centered on
the same direction as the emission above 10 GeV, which is closer to the TeV source HESS J1804−216 (Aharonian et al.2006b).
3. Two sources within 1° of each other, G24.7+0.6 and HESS J1837−069, came from previous similar automatic searches for extended sources(Lande et al.2012; Acero et al. 2016, respectively). They were replaced by the better representation involving three overlapping disks: FGES J1834.1−0706, J1836.5−0651, J1838.9−0704. 4. The previous templates for 2FHL sources SNR G150.3
+4.5, J1112.1−6101e, HESS J1356−645, and J1420 −607 (Ackermann et al. 2016b) were replaced by the
disks FGES J0427.2+5533, J1109.4−6115, J1355.1 −6420, and J1420.3−6046 (with much better statistics down to 10 GeV). FGES J0427.2+5533 is actually closer in size to the radio SNR (larger than the 2FHL size). FGES J1355.1−6420 and J1420.3−6046 are smaller than their 2FHL counterparts, closer to the TeV size.
5. The radio template for S 147 (Katsuta et al. 2012) was
replaced by theflat disk FGES J0537.6+2751. With the
67http://fermi.gsfc.nasa.gov/ssc/data/analysis/LAT_caveats.html 68
The templates and spectral models are available through the Fermi Science Support Center.
Table 1
Extended Sources Modeled in the 3FHL Analysis
3FHL Name Extended Source Changes Spatial Form Extent[deg] References
SMC Updated Map 1.5 Caputo et al.(2016)
HB 3 New Disk 0.8 Katagiri et al.(2016)
W 3 New Map 0.6 Katagiri et al.(2016)
J0322.6−3712e Fornax A New Map 0.35 Ackermann et al.(2016c)
J0427.2+5533e FGES J0427.2+5533 2FHL J0431.2+5553e Disk 1.515 Ackermann et al.(2017)
HB 9 New Map 1.0 Araya(2014)
J0500.9−6945e LMC FarWest New Mapa 0.9 Ackermann et al.(2016d)
LMC Galaxy LMC Mapa 3.0 Ackermann et al.(2016d)
J0530.0−6900e LMC 30DorWest New Mapa 0.9 Ackermann et al.(2016d)
J0531.8−6639e LMC North New Mapa 0.6 Ackermann et al.(2016d)
J0537.6+2751e FGES J0537.6+2751 S 147 Disk 1.394 Ackermann et al.(2017)
J0617.2+2234e IC 443 Analytic Gaussian 0.27 Abdo et al.(2010h)
J0822.1−4253e FGES J0822.1−4253 Puppis A Disk 0.443 Ackermann et al.(2017)
J0833.1−4511e Vela X Analytic Disk 0.91 Abdo et al.(2010f)
J0851.9−4620e FGES J0851.9−4620 Vela Jr Disk 0.978 Ackermann et al.(2017)
J1023.3−5747e FGES J1023.3−5747 New Disk 0.278 Ackermann et al.(2017)
J1036.3−5833e FGES J1036.3−5833 New Disk 2.465 Ackermann et al.(2017)
J1109.4−6115e FGES J1109.4−6115 2FHL J1112.1–6101e Disk 1.267 Ackermann et al.(2017)
J1208.5−5243e SNR G296.5+10.0 New Disk 0.76 Acero et al.(2016)
J1213.3−6240e FGES J1213.3−6240 New Disk 0.332 Ackermann et al.(2017)
J1303.0−6312e HESS J1303−631 Analytic Gaussian 0.24 Aharonian et al.(2005)
Centaurus A(lobes) No change Map (2.5, 1.0) Abdo et al.(2010c)
J1355.1−6420e FGES J1355.1−6420 2FHL J1355.1–6420e Disk 0.405 Ackermann et al.(2017)
J1409.1−6121e FGES J1409.1−6121 New Disk 0.733 Ackermann et al.(2017)
J1420.3−6046e FGES J1420.3−6046 2FHL J1419.3–6048e Disk 0.123 Ackermann et al.(2017)
J1443.0−6227e RCW 86 2FHL J1443.2−6221e Map 0.3 Ajello et al.(2016)
J1507.9−6228e FGES J1507.9−6228 New Disk 0.362 Ackermann et al.(2017)
J1514.2−5909e FGES J1514.2−5909 MSH 15−52 Disk 0.243 Ackermann et al.(2017)
J1552.7−5611e MSH 15−56 New Disk 0.21 Acero et al.(2016)
J1553.8−5325e FGES J1553.8−5325 New Disk 0.523 Ackermann et al.(2017)
J1615.3−5146e HESS J1614−518 Analytic Disk 0.42 Lande et al.(2012)
J1616.2−5054e HESS J1616−508 Analytic Disk 0.32 Lande et al.(2012)
J1631.6−4756e FGES J1631.6−4756 HESS J1632−478 Disk 0.256 Ackermann et al.(2017)
J1633.0−4746e FGES J1633.0−4746 HESS J1632−478 Disk 0.610 Ackermann et al.(2017)
J1636.3−4731e FGES J1636.3−4731 New Disk 0.139 Ackermann et al.(2017)
J1652.2−4633e FGES J1652.2−4633 New Disk 0.718 Ackermann et al.(2017)
J1655.5−4737e FGES J1655.5−4737 New Disk 0.334 Ackermann et al.(2017)
J1713.5−3945e RX J1713.7−3946 Corrected Map 0.56 Abdalla et al.(2016)
J1745.8−3028e FGES J1745.8−3028 New Disk 0.528 Ackermann et al.(2017)
J1800.5−2343e FGES J1800.5−2343 W 28 Disk 0.638 Ackermann et al.(2017)
J1804.7−2144e FGES J1804.7−2144 W 30 Disk 0.378 Ackermann et al.(2017)
J1824.5−1351e HESS J1825−137 Analytic Gaussian 0.75 Grondin et al.(2011)
J1834.1−0706e FGES J1834.1−0706 New Disk 0.214 Ackermann et al.(2017)
J1834.5−0846e W 41 Corrected Gaussian 0.23 Abramowski et al.(2015)
J1836.5−0651e FGES J1836.5−0651 HESS J1837−069 Disk 0.535 Ackermann et al.(2017)
J1838.9−0704e FGES J1838.9−0704 HESS J1837−069 Disk 0.523 Ackermann et al.(2017)
J1840.9−0532e HESS J1841−055 No change 2D Gaussian (0.62, 0.38) Aharonian et al.(2008)
J1855.9+0121e W 44 No change 2D Ring (0.30, 0.19) Abdo et al.(2010g)
J1857.7+0246e FGES J1857.7+0246 New Disk 0.613 Ackermann et al.(2017)
J1923.2+1408e W 51C No change 2D Disk (0.38, 0.26) Abdo et al.(2009)
J2021.0+4031e γ-Cygni Analytic Disk 0.63 Lande et al.(2012)
J2028.6+4110e Cygnus X cocoon Analytic Gaussian 3.0 Ackermann et al.(2011a)
HB 21 Analytic Disk 1.19 Pivato et al.(2013)
J2051.0+3040e Cygnus Loop No change Ring 1.65 Katagiri et al.(2011)
J2301.9+5855e FGES J2301.9+5855 New Disk 0.249 Ackermann et al.(2017)
Note.List of all sources that have been modeled as spatially extended. Sources without a 3FHL name did not reach the significance threshold in 3FHL. The Changes column gives the name of the source in previous catalogs in case of a change. The Extent column indicates the radius for Disk(flat disk) sources, the 68% containment radius for Gaussian sources, the outer radius for Ring(flat annulus) sources, and an approximate radius for Map (external template) sources. The 2D shapes are elliptical; each pair of parameters(a, b) represents the semimajor (a) and semiminor (b) axes.
a
flat disk that source is significant, whereas the radio template resulted in TS< 25.
6. The previous template for Puppis A(Hewitt et al.2012)
was replaced by the somewhat broader disk FGES J0822.1−4253, which follows more closely the radio and X-ray contour. Without this change a point source was necessary to fit the data just outside the pre-vious disk.
7. The previous template for Vela Jr (Tanaka et al. 2011)
was replaced by the somewhat smaller disk FGES J0851.9−4620, closer in size to the X-ray SNR. 8. The previous template for the pulsar wind nebula(PWN)
MSH 15−52 (Abdo et al.2010b) was replaced by FGES
J1514.2−5909, shifted by about 0°.1 with respect to the 3FGL disk. Without this shift, a point source close to PSR B1509−58 was necessary, although this pulsar is known to have a very soft spectrum.
9. The previous template for HESS J1632−478 (Lande et al.
2012) was replaced by the combination of a broader disk
(FGES J1631.6−4756) with two smaller ones on top of it (FGES J1633.0−4746 and J1636.3−4731), all with different spectra. Together they provide a much better representation at the cost of only two additional parameters(for extension), since two point sources were necessary next to HESS J1632−478.
For each of the extended sources, Table 1 lists its name, changes since 3FGL and 2FHL, if any, the spatial template description, the extent, and the reference to the dedicated analysis. In the catalog these sources are tabulated with the point sources, with the only distinction being that no position uncertainties are reported and their names end in e (see Section3.1). Point sources inside extended ones are marked by
“xxx field” in the ASSOC2 column of the catalog. 2.6. Background-only Simulation
The narrow PSF above 10 GeV implies that the number of independent positions in the sky is large. Therefore, we might expect a fraction of spurious sources from background fluctuations only. Taking a disk of radius 0°.15 (68% PSF containment radius at 10 GeV) as the source size, there are 6× 10⁵independent positions in the sky. Since the probability to reach TS> 25 (χ2distribution with 4 degrees of freedom) is 5× 10⁻⁵, we might expect as many as 30 spurious sources.
In order to quantify this more precisely we simulated the full sky with the same exposure as the real data, assuming pure (Galactic + isotropic) background. Owing to the narrowness of the PSF above 10 GeV there is essentially no correlation between sources so it is not worth including sources in the simulation. The source detection step was not run in exactly the same way as the detection step run on the real data, because mr_filter uses a False Detection Rate threshold, which depends on the number of true sources. Since there is no true source in the simulation, the same setting would have resulted in very few seeds at the detection step. Instead we used aflat threshold at 4σ over all wavelet scales, resulting in 135 seeds over the entire sky. We merged those with the PGWave seeds, which are much more numerous(1955) because of the 3σ threshold. The maximum likelihood analysis of these seeds(including localization) resulted in 10 sources at TS > 25 including 2 at TS> 30, randomly distributed over the sky, with Npred; 6 and formal position error∼0°.05 (similar to the faint sources in the
real data). We conclude that the number of spurious sources in 3FHL is closer to 10 than the rough estimate of 30 given at the beginning of this section. This is a small fraction even of sources close to threshold in the real sky(192 at 25 TS < 30 and 161 at 30 TS < 35).
2.7. Source Association and Classification
We adopt the same procedure for evaluating the probabilities of association betweenγ-ray sources and potential counterparts previously used in 3FGL. This procedure is based on two different association methods, the Bayesian method (Abdo et al. 2010e) and the the Likelihood-Ratio (LR) method
(Ackermann et al. 2011b, 2015). The fractions of new
associations provided by the two methods are different from 3FGL since the source populations are different, as described in Section 3.6. Following the same strategy as in the 3FGL, we distinguish between associated and identified sources. Associa-tions depend primarily on close positional correspondence, whereas identifications require measurement of correlated variability at other wavelengths or characterization of the 3FHL source by its angular extent.
The Bayesian method is applied using the set of potential-counterpart catalogs listed in Table 12 of Acero et al.(2015),
updated to the latest available versions. The priors are recalibrated via Monte-Carlo simulations to enable a proper estimate of the association probabilities and in turn of the false association rates. These rates indeed depend on the sizes of the error ellipses of the sources, whose distributions are appreci-ably different in the 3FGL and 3FHL catalogs. A total of 1187 associations with posterior probabilities greater than 0.80 are found via this method, with an estimated number of false positives of∼5. Thanks to the updated catalogs (e.g., Massaro et al.2015; Álvarez Crespo et al.2016a,2016b; Peña-Herazo et al.2017), 25 unidentified 3FGL sources detected in 3FHL
are now associated with blazars.
The Likelihood-Ratio method provides additional associa-tions with blazar candidates based on large radio and X-ray surveys (typically including >105sources). The Bayesian method in its current implementation cannot handle these surveys because their large source densities conduce to too many false positives. The resulting associated counterparts are then scrutinized using additional available multi-wavelength data to assess their classifications. If no or too-limited information is found, a sole association with radio counterparts is usually rejected, the high source densities in the radio surveys making the chance of false positives exceedingly large. A total of 1151 3FHL sources are associated by this method, of which 150(with an estimated number of 15 false positives) are not associated by the Bayesian method. In these 150 sources, 44 have 3FGL counterparts as well. As an exception to the rejection criterion outlined above, if the counterpart belongs to the ROSAT X-ray survey (which has a much lower source density than the radio surveys), we do report the association with a classification left as unknown. These sources (23 in total) are not particularly different from the unassociated sources in theirγ-ray properties or sky locations. Follow-up observations would be particularly useful to determine their nature. Associations with γ-ray sources reported in earlier LAT catalogs are established by requiring an overlap of their respective 95% error ellipses. Note that in the rare cases(six in total) where conflicting Bayesian-based associations are found for a 3FHL source and its 3FGL counterpart, we give
preference to the choice presenting the smaller error ellipse, foregoing consistency with 3FGL in some cases. The results of the association procedures are summarized in Table2. Figure2
shows the distributions of angular separation between the 3FHL sources and their assigned counterparts. The good agreement with the expected distributions for real associations visible in thisfigure provides confidence in the reliability of the associations.
The associated blazars were optically classified as flat-spectrum radio quasars (FSRQs), BL Lacs, and blazars of unknown types (BCUs, Shaw et al. 2012, 2013). The source
peak frequencies were adopted from 3LAC(Ackermann et al.
2015), when available, or determined via the same approach.
Low-synchrotron peak (LSP), intermediate-synchrotron peak (ISP), and high-synchrotron peak (HSP) blazars are those with log10(nspeak)<14, 14 log 15
s 10 npeak
< ( )< , log10(nspeak)>15, respectively, withnspeakgiven in units of Hz.
3. The 3FHL Catalog
The 3FHL catalog includes 1556 sources detected over the whole sky. (We note that the number of sources in the 3FHL catalog is more than the 1506γ rays detected above 10 GeV by the EGRET experiment on the predecessor Compton Gamma-ray Observatory mission, Thompson et al. 2005). The
association procedure (see Section2.7) finds that 79% of the
sources in the catalog (1231 sources) are extragalactic, 8% (125) are Galactic, and 13% (200) are unassociated (or associated with a source of unknown nature). Of the unassociated/unknown sources, 83 are located at b∣ ∣ <10, and 117 are located at b∣ ∣ 10. Since sources outside the plane are typically extragalactic, the fraction of extragalactic sources in the sample is likely about 87%. Figure3shows the
locations of 3FHL sources color-coded by source class.
3.1. Description of the Catalog
The FITSfiles format of the 3FHL catalog69is similar to that of the 3FGL catalog(Acero et al.2015). The file has four binary
table extensions. The LAT_Point_Source_Catalog extension has all of the information about the sources (see Table3for details). The catalog is available in a .tar.gz package. Relative to previous LAT catalogs, two changes are important.
1. The parameters of the curved (LogParabola) spectral shape, which is systematically tested against a power law, are now always reported via the Spectral_Index and betacolumns, even when the curvature is not significant (Signif_Curve < 3). The photon index of the power-law model is always reported via the PowerLaw_Index column. In 3FGL Spectral_Index contained the power-law index when the power-law model was adopted. The Flux_Density, Flux and Energy_-Flux columns still refer to the preferred model (SpectrumType).
2. The format of the spectral energy distributions (SEDs) differs. Now, we give the fluxes and their uncertainties for each source in a vector column matching the number of energy bins. These bins are documented in the EnergyBounds extension. The level of the relative
systematic uncertainty on the effective area in each band (SysRel column) is given in the same extension. The extensions ExtendedSources and ROIs (format unchanged since 3FGL) contain information about the 55 extended sources (Table 1) that were included in the analysis
(only 48 were detected) and the 741 ROIs over which the analysis ran. The extended sources are singled out by an e appended to their names in the main table. The background parameters are reported in the ROIs extension following the model described in the Appendix. The GTI extension is not included because it would dominate the volume of thefile.
3.2. General Characteristics of Sources
The 3FHL sources have integratedfluxes above 10 GeV that range from 1.3× 10⁻¹¹ph cm−2s−1 (approximately 0.5% of the Crab Nebula flux) to 1.2 × 10⁻⁸ph cm−2s−1, with a median of 5.0× 10⁻¹¹ph cm−2s−1.
The median spectral index is 2.48, which is characteristic of relatively hard sources. In Figure4, we show the spectral index distributions by source class. The figure shows that Galactic sources tend to have a broader range of spectral indices, whereas the distribution of extragalactic sources peaks at about an index of 2. There is also a clear bimodality in the Galactic index distribution produced by the SNR+PWN and PSR populations (see Section 3.5 for details). The population of unknown sources follows a similar trend as the blazars, SNRs, and PWNe but is different from PSRs. The median of the positional uncertainty is 0°.038 (2.3 arcmin; we note that about 75% of the 3FGL sources present in the 3FHL now have smaller localization uncertainties). Figure 5 illustrates that the detection threshold on photonflux does not depend strongly on spectral index (the same is not true for the energy flux). The reason for this is the constancy of the LAT per-photon resolution with energy at E 10 GeV. We note that extra-galactic sources are detected to lower fluxes than Galactic objects, highlighting that the sensitivity for source detection becomes worse in the plane of the Galaxy. Figure6shows the
flux sensitivity as a function of sky location (see the appendix of Ackermann et al.2013).
Figure 7shows example SEDs for four sources over four
decades in energy, which combine 3FGL and 3FHL spectral data(the 1FHL data are also shown for comparison).
3.3. Comparison with the 1FHL Catalog
In this section, we compare the 3FHL results with those of the previous Fermi-LAT catalog at similar energies (i.e., the 1FHL, Ackermann et al.2013).
The 1FHL was based on the first 3 years of data and the Pass 7 event reconstruction and classification analysis. For 3FHL we have analyzed 7 years of data using Pass 8. The total number of detected sources has increased by a factor of 3, from 514 to 1556. A simple scaling of the sensitivity, assuming a background-limited scenario, would suggest1000 sources in 3FHL. The much larger number of sources detected in 3FHL shows that the sensitivity, for 10 GeV, improves nearly linearly with time.70This is because the Fermi-LAT operates in a counts-limited regime at these energies. This is demonstrated
69
Thefile is available from the Fermi Science Support Center.
70
We have assumed that the fluxes of the sources are distributed as a Euclidean log N-log S, i.e., N(>F) ∝ F−3/2, where N is the number of sources above a givenflux F.
by the comparison of the flux distributions of the 1FHL and 3FHL sources in Figure 8. Indeed, a decrease in the median flux of a factor about 3, from 1.3 × 10⁻¹⁰ to 5.0× 10⁻¹¹ph cm−2s−1, is apparent. The median of the spectral index distributions remains similar in both catalogs. In Figure 8, we see that the 3FHL increases the size of the population of hard sources (Γ ∼ 1.8) that was discovered in 1FHL. These are faint and hard HSP BLLacs (see Section3.6
for more details) that are detected in 3FHL because of the improved sensitivity at high energies delivered by Pass 8. Furthermore, Figure 8 also compares the distributions of positional uncertainties. There is a clear improvement in the median positional resolution by approximately a factor of 2, from 4.7 to 2.3 arcmin, 95% C.L. This is better than the 3.8 arcmin median location uncertainty (95% C.L.) of 2FHL (Ackermann et al. 2016b) thanks to the generally larger
statistics existing at>10 GeV for 3FHL sources. Figure8also shows the distributions of detection significance for both catalogs.
Sixteen 1FHL sources are missing in 3FHL. Among these, only one was very significant, 1FHL J1758.3−2340 with TS= 47. In 3FHL this source is now part of the FGES J1800.5−2343 disk, which is broader than W 28 was in 1FHL. The rest of the missing sources had a TS between 25 and 30. Three of the missing 1FHL sources are parts of new extended sources: 1FHL J0425.4+5601 and 1FHL J0432.2+5555 in FGES J0427.2+5533 and 1FHL J1643.7−4705 in FGES J1633.0−4746. Only one other missing 1FHL source (1FHL J1830.6−0147) had Npred> 4. It coincides with a cluster of
four 3FGL sources, so it is possibly an extended source remaining to be discovered. All of these sources have corresponding seeds in the 3FHL analysis pipeline that were rejected from the catalog for having a TS∼15. We stress that the 1FHL catalog was built from Pass 7 Clean class events (before reprocessing). Therefore, the set of events was rather different, and the PSF was significantly broader.
3.4. New g-ray Sources and TeV Candidates
Thanks to the unprecedented lowflux limit of our analysis at E> 10 GeV, the 3FHL analysis has revealed a large number of new sources. The number of 3FHL sources without a 3FGL counterpart is 258, and of these 214 have no counterparts in any previous Fermi-LAT catalog.71 Of these 214, 3 have been detected with IACTs, i.e., 3FHL J0632.7+0550 (HESS J0632 +057, Caliandro et al.2015), 3FHL J1303.0−6350 (PSR B1259
−63, which flared after the 3FGL time period), and 3FHL J1714.0−3811 (CTB 37B, previously unresolved). In summary, the 3FHL has 211 sources previously unknown inγ rays. The sky locations and classes of the 214 sources are shown in Figure9. This figure shows that while most of them appear to be isotropically distributed, some fraction of the unassociated new sources appears to lie in the Galactic plane(see Section3.5).
Figure 10shows that the new sources follow an index
distribution similar to that of the previously detected sources but are fainter. Most new sources are either extragalactic or unassociated (but probably extragalactic). The new Galactic sources tend to be already known to be spatially extended from IACT observations, and we model them as such.
IACTs have excellentflux sensitivities at TeV energies but limited fields of view that make finding new sources challenging. The 3FHL is a resource for planning IACT observations. The catalog lists the highest-energy photon (HEP) detected by the LAT and its probability of association with a given source. Sources with HEPs of hundreds of GeV, small indices(hard spectra), and large fluxes are a priori good candidates for IACTs. However, the majority of the γ-ray sources detected by the LAT in 3FHL may be too faint for the current-generation IACTs, which can reach a sensitivity of 2.7× 10⁻¹²erg cm−2s−1(this is >1%–2% of the Crab Nebula flux at 100 GeV in 50 hr of observation). Of the 1423 3FHL sources that have not been detected by IACTs, only 8 have >100 GeV flux > 10−12erg cm−2s−1 (∼0.3% of the Crab Nebulaflux). Of those eight , six are already reported in 2FHL, while the remaining two are extended sources(3FHL J1036.3 −5833e and 3FHL J1824.5−1351e) in the Galactic plane. These two sources are the brightest among the above group, with>100 GeV flux of ∼30% and ∼50% of the Crab Nebula flux, respectively, and HEPs of ∼355 GeV and 586 GeV. Thus, hard Galactic sources, with limited extension, may be the best targets for current-generation IACTs.
In the TEVCAT_FLAG column of the catalog, we have flagged the sources considered as good TeV candidates based on these criteria(which are from Ackermann et al. 2013, see Section 5.1 of that paper): (1) the source significance above 50 GeV is σ50> 3, (2) the power-law spectral index above 10 GeV isΓ < 3, and (3) the integrated flux above 50 GeV is F50> 10−11ph cm−2s−1. This selection results in 246 candi-dates for TeV detection.
Table 2 3FHL Source Classes
Description Identified Associated
Designator Number Designator Number
Pulsar PSR 53 psr 6
Pulsar Wind Nebula PWN 9 pwn 8
Supernova remnant SNR 13 snr 17
Supernova remnant /Pul-sar wind nebula
K K spp 9 High-mass binary HMB 4 hmb 1 Binary BIN 1 K K Globular cluster K K glc 2 Star-forming region SFR 1 sfr 1 Starburst galaxy K K sbg 4
BL Lac type of blazar BLL 19 bll 731
Flat-spectrum radio qua-sar type of blazar
FSRQ 30 fsrq 142
Non-blazar active galaxy K K agn 1
Narrow-line seyfert 1 NYLS1 1 K K
Radio galaxy RDG 4 rdg 9
Blazar candidate of uncertain type
K K bcu 290
Total identified 136 associated 1220
Unclassified K K unknown 23
Unassociated K K K 177
Total in the 3FHL K K K 1556
Note.The designation“spp” indicates potential association with SNR or PWN. Designations shown in capital letters arefirm identifications; small letters indicate associations. Note that the PWN N 157 B in the LMC is counted as Galactic.
71
Note that the detections of 34 of them were aleady reported by Arsioli and Chang(2017).
3.5. The Galactic Population
The majority of Galactic sources detected in 3FHL are sources at the final stage of stellar evolution such as pulsars, PWNe, and SNRs, many of which are detected as extended, and high-mass binaries.
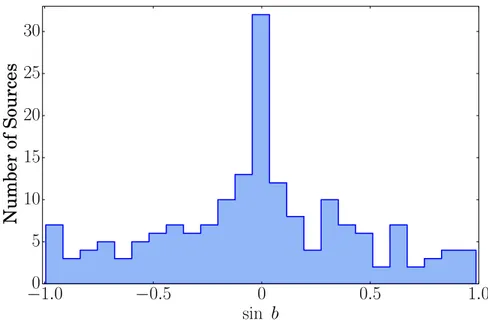
In this catalog 125 sources are associated with Galactic objects and 83 are unassociated within the plane of our Galaxy ( b∣ ∣<10). The same low Galactic latitude region has 133 extragalactic objects. Considering the density of extragalactic sources outside of the plane and the decreased sensitivity for source detection in the plane, we estimate that ≈25–40 of the 83 unassociated objects may be Galactic. Indeed, the distribu-tion in Galactic latitude of unassociated sources(see Figure11)
shows a peaked profile for b∣ ∣< 2 on top of a flat isotropic background.
The spectral index distribution of Galactic sources is broad, with a median indexΓ ≈ 3 as shown by Figure12. This arises from the superposition of the distributions of the indices of the different source classes. The majority of sources are pulsars, and at >10 GeV, the LAT samples their super-exponential cutoffs, yielding a median spectral index of Γ ≈ 4. Sources classified as pulsars in 3FGL retain this classification in 3FHL for consistency. A source is reclassified as PWN only if it is associated with a known, small-size PWN and has a rising SED indicative of a dominant PWN component. Only 3FHL J0205.5 +6449, 3FHL J0534.5+2201, and 3FHL J1124.4-5916 have been reclassified accordingly. SNRs and PWNe account for 56 objects. Their similar index distributions translate into much harder spectra than the rest, having a median of Γ ≈ 2. The unassociated sources within the plane of the Galaxy display the full range of spectral indices 1<Γ<5. However, those
Figure 2.Distributions of angular separations inσ units between 3FHL sources and their counterparts (r95 = 2.448σ). (Left panel): sources associated with the Bayesian method(red solid line) and sources solely associated with that method (black dotted line). (Right panel): Same, but for the LR method. The curves correspond to the expected distributions for real associations.
within b∣ ∣ < 2 primarily have Γ<2.5, suggesting PWN or SNR natures. At latitudes b∣ ∣ 10the 3FHL catalog contains 15 millisecond pulsars (MSPs) of which 13 are classified as PSR (discovered pulsating in γ rays by the LAT) and 2 as psr (radio MSP with no detection of γ pulsations). We also find three young pulsars classified as LAT PSR and one PWN in the LMC (N 157B).
With respect to the 1FHL catalog, the 3FHL doubled the number of Galactic objects detected at>10 GeV, maintaining similar proportions among the source classes. On the other hand, the Galactic sources in the 2FHL catalog, because of its >50 GeV threshold, are primarily PWNe/SNRs, with only one pulsar. Within the region b∣ ∣ 5 , which is where the diffuse flux is the brightest, the sensitivity of the 3FHL
Table 3
LAT 3FHL FITS Format: LAT_Point_Source_Catalog Extension
Column Format Unit Description
Source_Name 18A K Official source name 3FHL JHHMM.m+DDMM
RAJ2000 E deg R.A.
DEJ2000 E deg Decl.
GLON E deg Galactic Longitude
GLAT E deg Galactic Latitude
Conf_95_SemiMajor E deg Error radius at 95% confidence
Conf_95_SemiMinor E deg =Conf_95_SemiMajor in 3FHL
Conf_95_PosAng E deg NULL in 3FHL(error circles)
ROI_num I K ROI number(cross-reference to ROIs extension)
Signif_Avg E K Source significance in σ units over the 10 GeV to 2 TeV band
Pivot_Energy E GeV Energy at which error on differentialflux is minimal
Flux_Density E cm−2GeV−1s−1 Differentialflux at Pivot_Energy
Unc_Flux_Density E cm−2GeV−1s−1 1σ error on differential flux at Pivot_Energy
Flux E cm−2s−1 Integral photonflux from 10 GeV to 1 TeV obtained by spectral fitting
Unc_Flux E cm−2s−1 1σ error on integral photon flux from 10 GeV to 1 TeV
Energy_Flux E ergcm−2s−1 Energyflux from 10 GeV to 1 TeV obtained by spectral fitting
Unc_Energy_Flux E ergcm−2s−1 1σ error on energy flux from 10 GeV to 1 TeV
Signif_Curve E K Significance (in σ units) of the fit improvement between power-law and
LogParabola. A value greater than 3 indicates significant curvature
SpectrumType 18A K Spectral type(PowerLaw or LogParabola)
Spectral_Index E K Best-fit photon number index at Pivot_Energy when fitting with LogParabola
Unc_Spectral_Index E K 1σ error on Spectral_Index
beta E K Curvature parameterβ when fitting with LogParabola
Unc_beta E K 1σ error on β
PowerLaw_Index E K Best-fit photon number index when fitting with power law
Unc_PowerLaw_Index E K 1σ error on PowerLaw_Index
Flux_Band 5E cm−2s−1 Integral photonflux in each spectral band
Unc_Flux_Band 10E cm−2s−1 1σ lower and upper error on Flux_Banda
nuFnu E ergcm−2s−1 Spectral energy distribution over each spectral band
Sqrt_TS_Band E K Square root of the Test Statistic in each spectral band
Npred E K Predicted number of events in the model
HEP_Energy E GeV Highest energy among events probably coming from the source
HEP_Prob E K Probability of that event to come from the source
Variability_BayesBlocks I K Number of Bayesian blocks from variability analysis; 1 if not variable,
−1 if could not be tested
Extended_Source_Name 18A K Cross-reference to the ExtendedSources extension
ASSOC_GAM 18A K Correspondence to previousγ-ray source catalogb
TEVCAT_FLAG A K P if positional association with non-extended source in TeVCat
E if associated with an extended source in TeVCat, N if no TeV association C if TeV source candidate as defined in Section3.4
ASSOC_TEV 24A K Name of likely corresponding TeV source from TeVCat, if any
CLASS 7A K Class designation for associated source; see Table2
ASSOC1 26A K Name of identified or likely associated source
ASSOC2 26A K Alternate name or indicates whether the source is inside an extended source
ASSOC_PROB_BAY E K Probability of association according to the Bayesian method
ASSOC_PROB_LR E K Probability of association according to the Likelihood-Ratio method
Redshift E K Redshift of counterpart, if known
NuPeak_obs E Hz Frequency of the synchrotron peak of counterpart, if known
Notes.
a
Separate 1σ errors are computed from the likelihood profile toward lower and larger fluxes. The lower error is set equal to NULL and the upper error is derived from a Bayesian upper limit if the 1σ interval contains 0 (TS < 1).
analysis reaches a median of∼5 × 10⁻¹²erg cm−2s−1; this is ∼1% of the Crab Nebula flux in the 10 GeV–2 TeV band. Transformed to the energy range >1 TeV based on the Crab Nebula spectrum, this corresponds to an energy flux of ∼8 × 10⁻¹³erg cm−2s−1, which is slightly better than the sensitivity of ∼1.4 × 10⁻¹²erg cm−2s−1 reached at>1 TeV by H.E.S.S. in its Galactic plane survey (Aharonian et al.
2006b; Carrigan et al. 2013). Within the footprint72 of the H.E.S.S. survey, where H.E.S.S. detects 69 objects (reported in TeVCat73), the LAT detects 111 objects, of which 43 are in
common with H.E.S.S. Detections at TeV energies are related to the spectral hardness. Indeed, the median spectral index of 3FHL sources detected in the H.E.S.S. survey is∼2.0, while it is ∼2.5 for those that are undetected. Cut-out images of the Galactic plane are shown in Figure13.
Of the 15 hardest sources (Γ 1.7) detected at latitudes
b <10
∣ ∣ , only four and seven are detected in TeVCat and 2FHL, respectively. There are five objects associated with Galactic classes, four blazars, and six are unassociated. None of the blazars are in the TeVCat, possibly due to source activity. Variability cannot affect the comparison between the 3FHL and 2FHL because they span essentially the same time period. Indeed, all of the 3FHL AGNs located in the Galactic Plane were included in 2FHL.
Figure 4.Normalized distributions of the spectral indices of the Galactic sources(orange), extragalactic sources (green slash), and unassociated plus unknown sources (brown dotted) in 3FHL. The medians of the distributions are plotted with dashed, dashed–dotted, and dotted vertical lines, respectively.
Figure 5.The spectral index of Galactic(orange squares), extragalactic (green circles), unknown (blue triangles), and unassociated sources (brown diamonds) vs. the integrated photonflux above 10 GeV. The black line shows the flux limit averaged over the high-latitude sky ( b∣ ∣10). Symbols outlined with red are in the TeVCat.
72
The H.E.S.S. Galactic survey extends over the range 283° < l < 59° and Galactic latitudes of b∣ ∣< 3 . 5.
73
3.6. The Extragalactic Population
The sky above 10 GeV is dominated by extragalactic sources (1231 sources, 79% of the whole catalog). Blazars are the most numerous source type. Wefind associations with 750 BL Lacs, 172 FSRQs, 290 BCUs, and 19 extragalactic sources with a
different classification (representing 61%, 14%, 23%, and 2% of the total extragalactic sky, respectively). These results differ from what was found at>50 GeV (i.e., 2FHL). In the 2FHL, 65% of the sources with b∣ ∣ >10 were associated with BL Lacs (mostly HSP BL Lacs) and only 4% with FSRQs.
Figure 6.Point-sourceflux limit in units ofphcm−2s−1for E>10 GeV and photon spectral index Γ=2.5 as a function of sky location (in Galactic coordinates) for the 3FHL time interval.
Figure 7.Examples of SEDs for 3FHL sources. We combined the spectral data from the 3FGL(green circles) and 3FHL (magenta stars) to provide spectral coverage over four orders of magnitude. The 1FHL data(blue diamonds) are shown for comparison, when available. The (V) stands for variable source according to the criteria in the respective catalog. We note that the SEDs of Mkn421 (lower left panel) and 3C66A (lower right panel) are characterized by a log-parabola shape. In these cases, a curved model is preferred over a power law at a significance of 3.1σ and 3.3σ, respectively.
Figure 8.Distributions of properties of 3FHL and 1FHL sources.(Upper left panel): integrated flux above 10 GeV. (Upper right panel): spectral index. (Lower left panel): positional uncertainty (95% error radius). (Lower right panel): significance of detection. The medians are shown with vertical lines.
Figure 9.Sky map, in Galactic coordinates and Hammer-Aitoff projection, showing the 214 3FHL objects not previously reported in Fermi-LAT catalogs. The sources are classified by their most likely source class. The 3 sources already found by IACTs are indicated with open red circles.
However, at>10 GeV there is a more diverse AGN population, confirming that a strong spectral cutoff in the range 10–50 GeV is common.
Figure 14shows the distribution of synchrotron-peak
frequencies of blazars detected in the 3FGL, 2FHL, and 3FHL (Abdo et al. 2010a). The 3FGL and 2FHL catalogs
clearly sample different parts of the blazar population, with the 3FGL including mostly LSPs and ISPs and the 2FHL including mostly HSPs. The 3FHL BL Lac population is more heterogeneous and includes blazars with a broader range of
s peak
n . The BL Lacs in 3FHL include 153 LSPs(20%), 198 ISPs (27%), 324 HSPs (43%), and 75 sources with unknown s
peak
n
(10%). These fractions are intermediate between those for blazars found in 3FGL and 2FHL.
The 3FHL contains 131 new extragalactic sources. These are typically fainter than the average 3FHL source, and have spectral indexes similar to the average(∼2.2). There are 1078 3FHL extragalactic sources detected in the 3FGL, 16 in the 2FHL (and not 3FGL). No 1FHL extragalactic source is missing in the 3FHL catalog. Among all the 3FHL extra-galactic sources, 72 have already been detected by IACTs.
The spectral index is plotted versus the frequency of the synchrotron-peak maximum in Figure15. The trend of a strong hardening of the energy spectra with increasing peak frequency
Figure 10.The spectral index of Galactic(orange squares), extragalactic (green circles), unknown (blue triangles), and unassociated sources (brown diamonds) vs. the integratedflux above 10 GeV for the 3FHL sources not in previous Fermi-LAT catalogs. The black line shows the flux limit averaged over the high-latitude sky ( b∣ ∣10). Symbols with a red outline are sources already detected at TeV energies and contained in the TeVCat catalog. For comparison, the rest of the 3FHL sources are shown as gray symbols.
already seen above 100 MeV in the Fermi-LAT AGN catalogs (e.g., Ackermann et al.2015) is even more pronounced above
10 GeV. This enhanced effect relative to 3LAC is due to the larger EBL attenuation suffered by high-redshift sources(most
of them being LSPs) in comparison with the lower-redshift ones(preferentially HSPs; see more details on EBL attenuation below). In Figure 15, we note one FSRQ that has a hard spectrum (Γ = 1.65 ± 0.36) and low luminosity. This blazar
Figure 12.Distributions ofγ-ray spectral indices of SNRs plus PWNe (dashed blue) and sources associated with PSRs (filled red). At the 3FHL energies, SNRs and PWNe tend to have smaller indices(harder spectra) than PSRs, for which the LAT measurement is sensitive to the exponential cutoff.
Figure 13.Adaptively smoothed counts map showing the whole Galactic plane 0°l360° at Galactic latitudes −14°b14°, divided into four panels. The panels are centered at l=90°, 0°, 270°, and 180°, from top to bottom. Detected point sources are marked with a cross, whereas extended sources are indicated with their extensions. Only sources located at−4°b4° are labeled, plus the Crab Nebula.
(3FHL J0845.8−5551), which should be studied further in a future work, is associated with PMNJ0845−5555.
Redshifts have been measured for 548 of the sources (45% of the extragalactic sample). The median of the redshift distribution is z∼ 0.4, but the distribution extends to z ∼ 2.5. As is well known, BL Lacs typically have lower redshifts (median z ∼ 0.3) than FSRQs (median z ∼ 1, Ackermann et al.
2015). BCUs generally have low redshifts (median z ∼ 0.1).
There are 109 blazars at z>1 (82 FSRQs, 31 BL Lacs, and 3 BCUs) and 16 at z>2 (11 FSRQs, 4 BL Lacs, and 1 BCUs). We note that only 7 2FHL blazars have redshifts z>1.
Photons with energies greater than about 30 GeV suffer from attenuation over cosmological distances as a consequence of the pair production interactions with extragalactic background light(EBL) photons (e.g., Franceschini et al.2008; Helgason & Kashlinsky2012; Scully et al.2014). This interaction results in
a cosmic optical depth,τ, to γ-rays that may be quantified by the cosmic γ-ray horizon (CGRH, defined as the energy at which τ = 1 as a function of redshift, Abdo et al. 2010d; Domínguez et al. 2013) and carries cosmological information
(Domínguez & Prada 2013; Biteau & Williams 2015).74
Figure16shows a clear softening of the spectral index above 10 GeV with increasing redshift, which is likely due to EBL attenuation. This softening was already evident among 1FHL sources. As Figure 14 illustrated, different mixes of AGN populations dominate each LAT catalog. This fact could
introduce some bias in the inferred index evolution; however, we also show in Figure 16 that the difference between the 3FHL and 3FGL spectral indexes(i.e., ΔΓ = Γ3FHL− Γ3FGL) evolves similarly with redshift for the BL Lac as well as FSRQ populations(see also Domínguez & Ajello2015).
Photons from sources that suffer strong attenuation(τ > 1), such as those from 3FHL J0543.9−5532 (1RXS J054357.3 −553206, z = 0.273, HEPEnergy= 1341 GeV, Npred= 96 photons above 10 GeV, HEPProb= 0.95), 3FHL J0808.2 −0751 (PKS 0805−07, z = 1.837, HEPEnergy= 130 GeV, Npred= 80, HEPProb= 0.99), and 3FHL J1016.0+0512 (TXS 1013+054, z = 1.714, HEPEnergy= 179 GeV, Npred= 31, HEPProb= 0.86), can be powerful probes of the EBL. These photons permit testing EBL models and evaluating potential changes in the optical depth due to other more exotic scenarios (e.g., de Angelis et al.2007; Sánchez-Conde et al.2009; Essey & Kusenko 2010; Domínguez et al. 2011b; Horns & Meyer 2012). Figure 17shows the HEPs from each source
versus redshift together with estimates of the CGRH from EBL models (Finke et al. 2010; Domínguez et al. 2011a; Gilmore et al. 2012). This figure illustrates that the Fermi-LAT data
explore the region around and beyond the horizon(τ = 1).
3.7. Flux Variability
In this section, we present results on source flux variability following a similar methodology as used for previous hard-source LAT catalogs. Our analysis is based on a Bayesian Block algorithm that detects and characterizes variability in a
Figure 13.(Continued.)
74
Note that the CGRH is different from the cosmological particle horizon, the distance beyond which information cannot reach the observer.