High-level Visualization Over Big Linked Data
Laura Po and Davide Malvezzi“Enzo Ferrari” Engineering Department University of Modena and Reggio Emilia
Via Vignolese, 10 int 1 41125, Modena - ITALY
[email protected],[email protected] https://sites.google.com/view/laurapo/h-bold
Abstract. The Linked Open Data (LOD) Cloud is continuously expanding and the number of complex and large sources is raising. Understanding at a glance an unknown source is a critical task for LOD users but it can be facilitated by visualization or exploration tools. H-BOLD (High-level visualization over Big Open Linked Data) is a tool that allows users with no a-priori knowledge on the domain nor SPARQL skills to start navigating and exploring Big Linked Data. Users can start from a high-level visualization and then focus on an element of interest to incrementally explore the source, as well as perform a visual query on certain classes of interest. At the moment, 32 Big Linked Data (with more than 500.000 triples) exposing a SPARQL endpoint can be explored by using H-BOLD.
Keywords: Linked Open Data · Visualization · Big Data · SPARQL
1
Introduction
Gaining overview is a crucial task in the visual exploration scenario of big linked data. As outlined in the survey [3], modern visualization systems should effectively and ef-ficiently handle Real-time Interaction, On-the-fly Processing, Visual Scalability, and User Assistance and Personalization.
H-BOLD extends and improves our previous tool LODeX [1, 2] by: (1) adopting a two levels abstraction model to effectively address the problem of information over-loading and visual scalability (as shown in Figure 1); (2) creating a concise high-level view of big datasets thanks to the implementation of a community detection algorithm; (3) implementing an on-the-fly incremental exploration of classes and properties based on the user selections; (4) enriching visualizations with useful statistics and data infor-mation (percentage of the source shown, number of instances, properties etc.).
2
H-BOLD
We first give an overview of H-BOLD with the focus on its novel components and then present technical details behind community detection algorithm, and incremental exploration.
Several LOD visualization tools are focused on representing the instances (see the “Instance View” level in Figure 1). In this case, the problem of management of large graphs is enormously amplified. Indeed, a LOD source has a number of instances two or three order of magnitude higher than the number of classes. Our previous tool, LODeX [2], allows to explore an abstract visualization of the schema of a LOD that shows only classes instead of instances (see the “Schema View” level in Figure 1). H-BOLD adds a higher abstraction level that allows to represent and explore also big datasets. By aggregating classes into Cluster, the entire LOD can be visualize at a glance (see the “Cluster View” level in Figure 1).
The architecture of H-BOLD is depicted in Figure 2, here the arrows denote the data flow between the systems components. The index extraction and the schema sum-mary were originally in LODeX while the community detection has been introduced, and the visualization has been adapted in H-BOLD. The index extraction takes as input the URL of a SPARQL endpoint and generates the queries needed to extract structural and statistical information for a LOD. These information (number of triples, number of instantiated classes, class list, property list, etc.) are stored in a NoSQL database and are used to generate the Schema Summary, a pseudograph inferred from the distribu-tion of the dataset instances that represents the structure of a LOD. In case the Schema Summary is represented through a graph with a high number of nodes, a community detection algorithm is applied to shrink the graph into a cluster graph, i.e. a graph that represent communities/clusters of classes. The visualization is performed by a web ap-plication through which the user can interact for browsing, expanding and querying the graph. The visualization is organized on two levels. The higher level shows the Cluster View: here the clusters and their interconnections are displayed in an interactive graph; by selecting a cluster a list of the contained classes is shown, the selection of a set of classes is the pre-requisite to proceed to the next level of the visualization process. The second level shows a portion of the Schema Summary of the LOD source, here the classes that have been selected on the previous level are shown together with their properties and attributes. Iteratively, the graph can be expanded by adding new classes. On the Schema View, the user might also define a visual query by selecting classes, properties and attribute.
Fig. 2. The architecture of H-BOLD.
Community Detection - By analyzing the Schema Summaries produced by LODeX an important feature, called community structure1, has emerged. The problem of
de-tecting communities within a network can be handled using community detection algo-rithms. We make use of the igraph Software Package for Complex Network Research2 for the comparison of the several community detection algorithms within H-BOLD. Among those we choose to the Louvain algorithm. Louvain has a linear computational complexity, which makes it extremely scalable. From an experimental evaluation and comparison of 4 community detection algorithms on H-BOLD [4], it obtained a good average quality, it also showed the property of creating a very low number of commu-nities in every type of graph in which it has been applied.
Incremental Exploration - H-BOLD allows an incremental exploration of a dataset. The user usually starts from the Cluster View from which he/she can grasp the overall structure of the dataset. After this, an in-depth exploration within a cluster can be carried out: the visualization of the classes within the cluster shows a portion of the complete Schema Summary (in Figure 3 (c) only the 42% of the complete Schema Summary is shown). The user can incrementally expand this graph by adding new nodes connected to the one shown. Thus augmenting the percentage of the Schema Summary shown.
3
Demo
The first part of the demo is devoted to show a use case scenario3. While, the second
part of the demo is open to the active role of the audience, thus any of the 32 Big Linked Data exposing a SPARQL endpoint can be explored to show the functionalities of the tool.
In the first part, we select a source of 12 millions triples and 960 thousands in-stances: the environment agency bathing water quality, a dataset published by the UK Environmental Agency about bathing water quality4. Starting from the visualization
1
A high concentration of arcs within specific groups of nodes.
2Available at http://igraph.org/python/ 3
A short video of the demonstration we will give at ISWC is available at https://sites. google.com/view/laurapo/h-bold.
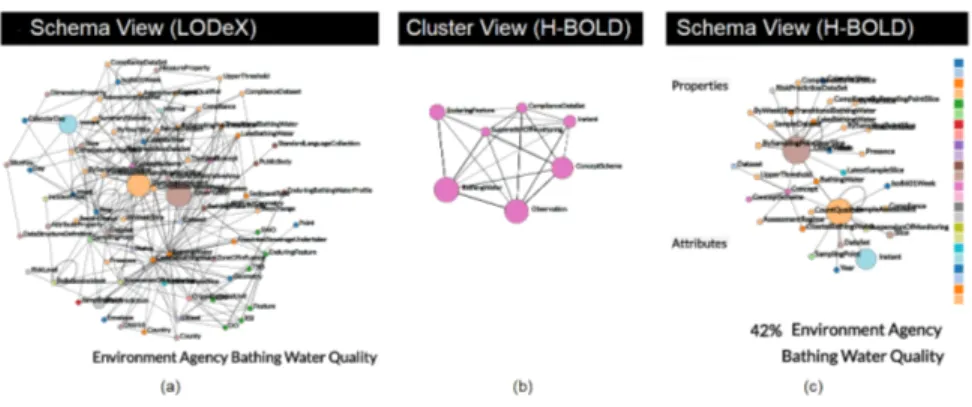
Fig. 3. Example of a complex graph represented by LODeX (on the left), by H-BOLD at a high-level of abstraction, i.e Cluster View, (in the center), or with an incremental exploration, i.e. Schema View (on the right).
of the complete Schema Summary, composed of 90 classes linked by 250 properties, users will see a complex graph represented in Figure 3) (a). This graph well depicts the flaws of representations that cannot handle sources of big size. The effectiveness of H-BOLD is shown by selecting the Cluster View (see Figure 3 (b)). Here the nodes represent a community/cluster of classes. Users can appreciate that the visualization is very compact and simple and give a first impression of the entire dataset grouped in 7 main clusters. By selecting one of these clusters, for example, the cluster “Concept”, we can explore in details which classes are grouped within this cluster. The Schema View shows a portion of the complete Schema Summary (see Figure 3 (c)) that con-tains only the classes grouped in the “Concept” Cluster selected in the previous level. On this view, the user is aware that he/she is navigating a portion of the classes of the dataset (42%), and perceives the influence of each class by looking at its dimension (that is proportional to the number of instances of the class) and its provenance (since the color of the nodes express to which vocabulary the class belongs to). Once the user is familiar with that portion, he/she might iteratively enlarge the Schema Summary that is visualized by selecting the classes from which to expand the graph. For example, by double clicking on “Dataset”, the graph is expanded by adding the classes directly connected to the “Dataset” node.
References
1. Benedetti, F., Bergamaschi, S., Po, L.: Lodex: A tool for visual querying linked open data. In: Proceedings of the ISWC 2015 Posters & Demonstrations Track the 14th International Semantic Web Conference (2015)
2. Benedetti, F., Bergamaschi, S., Po, L.: Visual querying LOD sources with lodex. In: Proceed-ings of the 8th International Conference on Knowledge Capture, K-CAP 2015, Palisades, NY, USA, October 7-10, 2015. pp. 12:1–12:8 (2015)
3. Bikakis, N.: Big data visualization tools. Encyclopedia of Big Data Technologies (2018) 4. Po, L., Malvezzi, D.: Community detection applied on big linked data (2018), (Forthcoming)