Alma Mater Studiorum – Università di Bologna
DOTTORATO DI RICERCA IN
Oncologia e Patologia Sperimentale
Ciclo XXVII
Settore Concorsuale di afferenza: 06/A2
Settore Scientifico disciplinare: MED/04
Mitochondrial DNA rearrangements
during human aging:
a study on liver, muscle and adipose tissue
Presentata da: Dott.ssa Fiammetta Biondi
Relatore
Prof. Stefano Salvioli
Coordinatore Dottorato
Prof. Pierluigi Lollini
Co-relatore
Prof. Claudio Franceschi
Al mio dono più grande, la mia famiglia.
A Maria Grazia, a Marco ed a Eleonora.
Alla loro forza e al loro coraggio.
i
1 INTRODUCTION ... 1
1.1 HUMAN AGING ... 1
1.1.1 HUMAN LIVER AGING ... 3
1.1.2 HUMAN SKELETAL MUSCLE AGING ... 4
1.1.3 HUMAN WHITE ADIPOSE TISSUE AGING ... 6
1.2 MITOCHONDRIA ... 7
1.2.1 MITOCHONDRIA STRUCTURE AND FUNCTION ... 7
1.2.2 MITOCHONDRIAL GENOME (MTDNA) ... 9
1.2.2.1 Replication models of mtDNA ... 10
1.2.3 MITOCHONDRIAL THEORY OF AGING AND MTDNA REARRANGEMENTS ... 11
1.2.4 NUCLEAR-MITOCHONDRIAL INTERCONNECTIONS ... 14
1.2.4.1 Mitochondrial biogenesis ... 14
1.2.4.2 Mitochondrial dynamics ... 15
1.2.4.3 Mitophagy ... 16
1.2.4.4 Protein Quality Control System ... 16
1.2.4.5 Super oxide product scavenging ... 17
1.3 TELOMERES ... 17
1.3.1 TELOMERES AND AGING ... 17
1.3.2 TELOMERE AND MITOCHONDRIA, A CONNECTION IN AGING... 18
2 AIM OF THE THESIS ... 20
3 MATERIALS AND METHODS ... 22
3.1 TISSUES SAMPLES... 22
3.2 NUCLEIC ACID ISOLATION AND PURIFICATION ... 23
3.2.1 DNA ISOLATION ... 23
3.2.1.1 Liver and skeletal muscle biopsies ... 23
3.2.1.2 Adipose tissue biopsies ... 23
3.2.2 RNA ISOLATION ... 24
3.2.3 RNA TREATMENT WITH DNASE ... 25
3.2.4 NUCLEIC ACID QUANTIFICATION ... 25
3.3 CDNA SYNTHESIS ... 26
3.4 QUANTITATIVE REAL TIME PCRSYBR®GREEN ASSAY ... 26
ii
3.4.2 TELOMERE LENGTH ANALYSIS ... 29
3.4.3 GENE EXPRESSION ANALYSIS ... 30
3.5 STATISTICAL ANALYSIS ... 32
4 RESULTS ... 34
4.1 HUMAN LIVER ... 35
4.1.1 MTDNA COPY NUMBER ... 35
4.1.2 MTDNA DELETION LEVEL ... 36
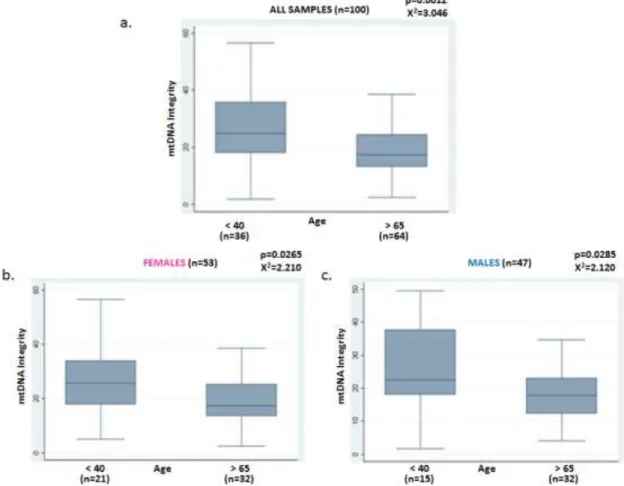
4.1.3 MTDNA INTEGRITY ... 37
4.1.4 TELOMERE LENGTH ... 39
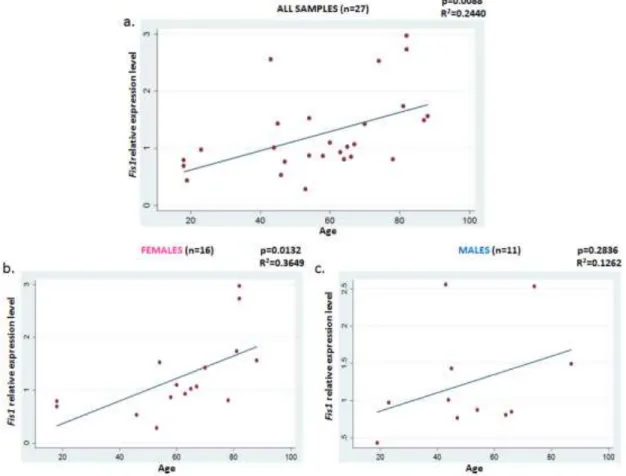
4.1.5 GENE EXPRESSION ANALYSIS ... 43
4.2 HUMAN SKELETAL MUSCLE ... 47
4.2.1 HEALTHY SUBJECTS ... 47
4.2.1.1 mtDNA copy number ... 47
4.2.1.2 mtDNA deletion level ... 48
4.2.1.3 mtDNA integrity ... 49
4.2.1.4 Telomere length ... 50
4.2.1.5 Gene expression analysis ... 51
4.2.2 LLMI PATIENTS ... 57
4.2.2.1 mtDNA copy number ... 57
4.2.2.2 mtDNA deletion level ... 58
4.2.2.3 mtDNA integrity ... 59
4.2.2.4 Telomere length ... 60
4.2.2.5 Gene expression analysis ... 61
4.3 ADIPOSE TISSUE ... 66
4.3.1 MTDNA COPY NUMBER ... 66
4.3.2 MTDNA DELETION LEVEL ... 67
4.3.3 MTDNA INTEGRITY ... 68
4.3.4 TELOMERE LENGTH ... 69
4.3.5 GENE EXPRESSION ANALYSIS ... 70
4.4 TISSUE COMPARISON ... 75
4.4.1 MTDNA COPY NUMBER ... 75
4.4.2 MTDNA DELETION LEVEL ... 76
4.4.3 MTDNA INTEGRTIY ... 77
4.4.4 TELOMERE LENGTH ... 78
iii 4.4.5.1 Pgc1-α ... 79 4.4.5.2 Polγ ... 81 4.4.5.3 Tfam ... 83 4.4.5.4 Nrf1 ... 85 4.4.5.5 Twinkle ... 87 4.4.5.6 Sirt1 ... 89 4.4.5.7 Mfn2 ... 91 4.4.5.8 Opa1 ... 93 4.4.5.9 Fis1 ... 95 4.4.5.10 Pink1 ... 97 4.4.5.11 Beclin ... 99 4.4.5.12 Ambra ... 101 4.4.5.13 Pik3cd ... 103 4.4.5.14 Lonp ... 104 4.4.5.15 Nos3 ... 106 4.4.5.16 Sod1 ... 108 5 DISCUSSION ... 110 5.1 LIVER ... 111
5.1.1 GENDER DIFFERENCE IN HUMAN LIVER AGING ... 112
5.2 SKELETAL MUSCLE ... 113
5.2.1 HEALTHY SUBJECTS ... 114
5.2.1.1 Gender difference in aging of skeletal muscle from healthy subjects ... 115
5.2.2 LLMI PATIENTS ... 116
5.2.2.1 Gender difference in aging of skeletal muscle from LLMI patients ... 116
5.3 ADIPOSE TISSUE ... 117 5.4 TISSUE COMPARISON ... 118 6 CONCLUSIONS ... 120 7 BIBLIOGRAPHY ... 122 7.1 BOOKS ... 135 7.2 WEB SITES ... 135 8 RINGRAZIAMENTI ... 137
1
1 Introduction
1.1 Human aging
Aging is an essential, inevitable, physiological complex phenomenon characterized by a progressive decline in the functional maintenance of tissue homeostasis and an expanding propensity to degenerative diseases and death (Cui et al., 2012). Even if this process is still not completely understood (Vitale et al., 2013), there is a large agreement on fact that the aging is: (1) universal; (2) intrinsic (i.e., “built-in”); (3) deleterious and (4) irreversible (Shokolenko et al., 2014). Over time, different aging theories proposed a variety of such basic mechanisms in order to explain it (Shokolenko et al., 2014), even if, at the molecular level, many evidences suggest that damages to macromolecules are at the base of several of the most important mechanisms (Kirkwood, 2005). In particular, as summarized by López-Otín and colleagues in figure 1, the main phenomena thought to be among the causes of aging are: genomic damages due to both endogenous and environmental factors, which lead to genomic instability; epigenetic alterations that involve changes in DNA methylation patterns, post-translational modification of histones and chromatin remodelling; decline of stem cell regenerative potential; deregulation of nutrient sensing mediated by insulin and IGF-1 signalling pathway, mTOR, AMPK and sirtuins; decline in protein quality control and degradation systems (autophagy-lysosomal and ubiquitin-proteasome systems) and accumulation of oxidised cell components and indigested garbage; cellular senescence; telomere shortening; mitochondria dysfunction; altered intercellular communication particularly in relation to inflammation (López-Otínet al., 2013).
2 These hallmarks of aging can be modulated by circulatory factors (Kennedy et al., 2014), between which, there are IL-6, IL-18 and C-reactive protein, that are pro-inflammatory molecules whose levels increase with age in both women and men (Howcroft et al., 2013). Elevated levels of inflammatory biomarkers, such as the above mentioned, are predictive and associated with the age-related phenotype, diseases and mortality (Franceschi and Campisi, 2014). In particular, Franceschi and colleagues found that a low-grade, chronic, systemic inflammatory status exists in absence of overt infection and characterizes the aging process. They named this status “Inflamm-aging” (Franceschi et al., 2000), it is provoked by continuous antigenic load and stress, with the persistence of inflammatory stimuli over time (Morrisette-Thomas et al., 2014) and in particular by an impairment of the balance between pro-inflammatory and anti-pro-inflammatory agents (Cevenini et al., 2013), as well as the activation of macrophages and the expansion of specific clones of T lymphocytes directed toward common antigens (Franceschi et al., 2000). However, the identification of pathways involved in the control of age-related inflammation across multiple system is very important, above all because several mechanisms of chronic inflammation could be implicated. Among others, it can be recognized: (i) constant production of reactive molecules by infiltrating leukocytes, that at the end damages the structural and cellular components of tissues; (ii) amplification of inflammatory response due to damaged non-immune cells and activated immune cells and (iii) interference with “anabolic signalling” (Franceschi and Campisi, 2014). Moreover, from the fields of genetics, epigenetics, proteomics and other “omics” platforms, new experimental data come to demonstrate that others cellular processes are involved, also of non-immunological nature, such as microRNAs (miRs), agalactosylated N-glycans, gut microbiota-related products and metabolites, cellular senescence, mitochondrial function and reactive species production (Santoro et al., 2014).
These latter processes are also the principal actors of two of the most important aging theories proposed and for this reason, will be discussed in more detail below (see section 1.2 and 1.3). On the whole, the aging of human body could be considered as a mosaic (Cevenini et al., 2008) because the different tissues could age at different rates and likely with slightly different mechanisms thus differently contributing to inflammaging. Hereafter it is summarized the knowledge of the aging process in liver, muscle and adipose tissues, which are the object of the study in this thesis, with particular attention to mitochondria and telomeres.
3
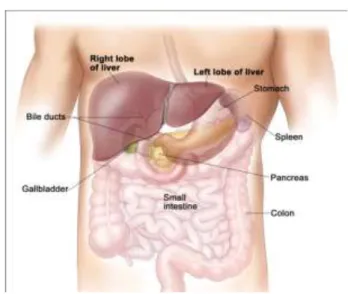
1.1.1 Human liver aging
Figure 2: Liver in human body (http://www.ncbi.nlm.nih.gov/pubmedhealth/PMHT0018957/).
Liver is a vital organ supporting a multitude of different functions and playing a central role in human physiology. In particular, among other functions, the liver represents the main reservoir of blood in the body and hepatocytes are assigned to the synthesis of bile, as well as to the control of levels of circulating lipids, carbohydrates and amino acids, to the removal of toxins from the blood and to the assimilation of nutrients and liposoluble vitamins (A, D, K and E), that can be also stored in the liver (Martini et al., 2008).
Besides, one of the most important liver characteristic is that it is able to regenerate itself after suffering several injuries, but during aging the ability to withstand a hepatic insult is reduced (Hoare et al., 2010). Indeed, studies in rodents and humans show as some structural changes in liver morphology occur (Schmucker and Sanchez, 2011): (a) the volume of hepatocytes declines with senescence and also the relative volumes of hepatocyte organelles change during ageing (Hoare et al., 2010), (b) the smooth surfaced of endoplasmic reticulum is progressively lost, (c) the volume of the dense body compartment, for example, secondary lysosomes, residual bodies, or lipofuscin increases, as well as (d) the hepatocyte polyploidy increases (Schmucker, 1990). In spite of this, liver function tests failed to identify significant age-related deficits (Schmucker and Sanchez, 2011).
Additionally, in the last years it is notably increased the number of orthotopic liver transplants where the age of the donor is considerably higher than that of the recipient. Clinical data, in fact, point out how, in some conditions, function and duration of liver graft from aged subjects are comparable to those achievable with liver grafts from young donors (Cescon et al., 2003, 2008;). Therefore a peculiar aging pattern for liver seems to emerge from this evidence
4 (Conboy et al., 2005; Bellavista et al., 2014), but the molecular mechanisms involved are still largely unknown (Bellavista et al., 2014).
One hypothesis is that mitochondrial dysfunction might play a pivotal role. It was seen, indeed, that in liver, as well as in some other tissues, the activities of the electron transport chain protein complex are decreased with age and in liver this is particularly true for complex I and IV (Castro et al., 2012). Moreover, Navarro and colleagues suggest that the activities of complex I and IV are inversely correlated with the accumulation of oxidative damaged lipid, proteins and DNA (Navarro et al, 2002), that leads to a vicious circle and to more accumulation of mitochondrial dysfunction (Castro et al., 2012).
As Muller-Hocker and colleagues suggested, also in liver the expression either of mitochondrial and nuclear encoded electron transporter chain complexes or the respiration rates are reduced during aging (Muller-Hocker et al., 1997) and these deficits probably are due to the oxidative mtDNA lesions occurring in aged liver, that if not repaired, may result in mtDNA deletion (Gredilla et al., 2010).
The elevated mtDNA damage levels are consistent with the age-dependent rises in lipid peroxidation and thus in agreement with the age-associated accumulation of lipofuscin in the liver (Brunk and Terman, 2002), that reflects an inability to eliminate cellular waste products and compromised normal cell activities (Schmucker and Sachs, 2002).
1.1.2 Human skeletal muscle aging
In human body, skeletal muscle is the most abundant tissue, accounting for almost 40% of the total body mass. It is also a major site of metabolic activity and, in healthy conditions, carries out an important role in the prevention of metabolic disorders, such as obesity, diabetes and hypertension, among others (Romanello and Sandri, 2010). Changes in exercise, loading, nutrition and hormones are factors able to induce a muscle answer, since skeletal muscle is a plastic tissue able to respond and, above all, adapt to them (Sandri, 2008). This ability is attributable to contractile proteins located inside the muscle cells (myocytes), which determine the cellular size, morphology (Masiero and Sandri, 2010), but also different type of contraction and of movement abilities. Since ATP is required for muscle contraction, in muscle cells there are many mitochondria (Cogswell et al., 1993; Manneschi and Federico, 1995; Bizeau et al., 1998; Picard et al., 2013), that carry out vital functions in the maintenance of myocite viability, in particular in the context of energy provision, redox homeostasis and regulation of several catabolic pathways (Marzetti et al., 2013). Since the importance of these
5 organelles, it is possible that their dysfunction is implicated in the age-dependent muscle degeneration.
In particular, the age-associated decline in skeletal muscle mass, strength and function is named “sarcopenia” (Roseberg, 1989) and it is referred to a complex medical condition that predicts a deficiency in mobility, disability, leading in turn to loss of independence, a higher risk of falls, reduced quality of life, increased health care costs and eventually an increased risk of mortality (Montero-Fernandez and Serra-Rexach, 2013). The reduction in size of type II fibers seems to be the main cause of sarcopenia (Nilwiket al., 2013), together with a decreased capacity of proliferation and differentiation of the muscle stem cells (satellite cells) that lead to diminished generation of myogenic fibers and a replacement of them with fibrous tissue (Verdijk et al., 2007; Gopinath and Rando, 2008; Sahin and De Pinho, 2010;).
Figure 3: Sarcopenia is the age associated decline in muscle mass, strength and function, with an increment of muscle atrophy. (OpenStax College. Anatomy & Physiology. Connexions, June 19, 2013. http://cnx.org/content/col11496/1.6/)
As previous anticipated, an increasing number of evidences suggest that mitochondrial dysfunction is the main responsible of age-related skeletal muscle decline (Johnson et al., 2013), but the interpretation of the consequences is complicated by the presence of two population of mitochondria inside myocites: sub-sarcolemmal and inter-myofibrillar mitochondria (Johnson et al., 2013), with different specific biochemical and functional proprieties and, above all, a distinct behaviour during aging (Marzetti et al., 2013).
Besides, in last years, increasing literature reports an accumulation with aging of fat between the fibres. This type of fat, named inter-muscular adipose tissue (IMAT), has been identified as a potential contributor to sarcopenia and to reduced mobility of the elderly. According to Marcus and colleagues, IMAT may also be metabolically active secreting, like inflammatory cytokines that contribute to systemic inflammation (Marcus et al., 2012).
6
1.1.3 Human white adipose tissue aging
Figure 4: Adipose tissue is a connective tissue, consisting of fat cell with little extracellular matrix. (OpenStax College. Anatomy & Physiology. Connexions, June 19, 2013. http://cnx.org/content/col11496/1.6/)
Two types of adipose tissue could be distinguished: brown adipose tissue, whose main role is thermogenesis, particularly in small mammals and human neonates, and white adipose tissue (WAT). The latter is composed by adipocytes, that are the most prevalent cell type, and many others, like the stromovascular fraction, which in turn is constituted from approximately 10% of CD14+CD31+ macrophages (Fantuzzi, 2005). In mammals and birds, WAT is the main site of
energy storage, since substrate being deposited as triacylglycerols at a high energy density. Initially it was thought that this was the principal function of white adipose tissue, together with thermal and mechanical insulation, but now this tissue is seen as a highly dynamic organ, involved in several physiological and metabolic processes (Trayhurn and Wood, 2004). Indeed, WAT is an important source of cytokines, chemokines and adipocyte-specific factors, known as adipokines, that are used by WAT to regulate several biologic activities, like, among others, appetite, energy expenditure, insulin sensitivity, bone metabolism and the endocrine and reproductive system (Fantuzzi, 2005). In particular, WAT produces as much as 30% of circulating IL-6 and tumor necrosis factor, that increase its release in people with obesity (Vitale et al., 2013). In this way, WAT affects inflammation and immunity, as seen by Ostan and colleagues in a study on centenarians, where the healthy status of old people it is argued to be due by levels of adipokines (Ostan et al.,2008). Specifically, the production of inflammatory mediators is linked to oxidative stress and generation of reactive oxygen species, that are increased during hypoxia and that lead to a deregulated expression of adipokines and to induction of adipogenesis (Vitale et al., 2013). In fact, white adipose tissue in adults is increased, as result of adipocytes hypertrophy and hyperplasia. This is the reason why WAT is the only endocrine tissue that increase with age (Jackson et al., 2012). Moreover, the increment of adipose tissue is preferentially in its visceral component, but, above all, it is invaded by activated macrophages and T-cells, able in turn to induce the activation of multiple
7 signalling networks and the generation of inflammatory compounds. These are the principal responsible of a low-grade, chronic inflammation, orchestrated by metabolic cells in response to excess nutrients and energy, referred as “metaflammation” (Gregor and Hotamisligil, 2011). Classically it is thought that metaflammation occurs in young and adult (obese) people, while inflammaging occurs later in life even in non obese and lean people, but a possible overlapping of the two phenomena in the same individual cannot be excluded and it is an interesting perspective to purse (Cevenini et al., 2013), also because little is known about modifications of this peculiar endocrine tissue, as white adipose tissue is yet (Vitale et al., 2013).
1.2 Mitochondria
1.2.1 Mitochondria structure and function
Mitochondria – from the Greek mitos (thread-like) and khondros (grain or granule) – are intracellular, bacteria-sized organelles present in all eukaryotic cells (Schon et al., 2012). They are bound by two lipid bilayer membranes (Okamoto and Kondo-Okamoto, 2012), with specific and different characteristics and functions. The outer mitochondrial membrane (OMM) is highly permeable, regulates the mitochondrial shape and contains enzymes involved in amino acids’ oxidation, fatty acids’ elongation, phospholipids biosynthesis and hydroxylases. Instead, the inner mitochondrial membrane (IMM) is characterised by some peculiar structures, called cristae. Cristae contain the electron transport proteins and in particular, the cytochromes that form the electron transport chain, and are associated to the five respiration complexes located in the mitochondrial matrix. Thus, each mitochondrion results divided in four distinct section: OMM, the inter-membrane space, IMM and the mitochondrial matrix, as shown in figure 5.
8 Inside the cells, mitochondria carry out many functions as iron/sulfur cluster biosynthesis, the synthesis of amino acids, lipid metabolism, copper homeostasis, signal transduction, thermogenesis and the control of apoptosis, among others (Peterson et al., 2012; Osiewacz and Bernhardt, 2013). Nevertheless, the main mitochondrial function is to produce energy, generating more than 90% of a typical cell adenosine triphosphate (ATP), which is used to drive all cellular energy-consuming processes (Schon et al., 2012, Osiewacz and Bernhardt, 2013).
Mitochondrial energy production is the result of two coordinated processes: the tricarboxylic acid (TCA) cycle, also known as the Kreb’s or the citric acid cycle, and the electron transport chain (ETC). The former produces only a small amount of ATP from carbohydrates and fats, since its main aim is to provide, from pyruvate generated by glycolysis, not ATP but coenzymes NADH and FADH for ETC. More specifically, the Kreb’s cycle consists of nine steps leading to the production of three molecules of NADH and two molecules of FADH, for a total of six molecules of NADH and four molecules of FADH per molecule of pyruvate. Furthermore, two molecules of ATP are generated during acetyl-CoA oxidation with two additional molecules of CO2 (Lehninger, 2004).
Figure 6: Mitochondrial structure and energy production processes (Adapted from Lehninger, 2004 and Larsson, 2010).
The role of NADH and FADH is to carry electrons to the electron transport chain, whose reactions create a reduction potential that increases along the chain. In this way, the
9 generated energy is sufficient to drive the protons translocation across the IMM, creating a proton gradient and a membrane potential, collectively called the proton motive force, which drives the synthesis of ATP. This process, named also oxidative phosphorylation (OXPHOS), is not a perfect system since proton leakages occurs reducing the yields of ATP production (Mathews et al., 2004).
1.2.2 Mitochondrial genome (mtDNA)
A fundamental characteristic of mitochondria is that, as evolutionary relics of aerobic bacteria that invaded the proto-eukaryotic cell a billion of years ago, they have a separate genome (Green et al., 2011), that is maternally inherited (figure 7). The human mtDNA is a circular double strand DNA molecule of 16569bp (Anderson et al., 1981), present in multiple copies in each cell. They are organised in protein-DNA complexes (mitochondrial nucleoids) often associated to the inner mitochondrial membrane and that look like globular foci. Each mtDNA molecule can be divided in two regions. The former is a regulatory region (16024-576bp), named displacement loop (D-loop) and involved in the replication and transcription processes, since it contains transcriptional promoters and replication origins. The second one is the coding region (577-16023bp), containing only 37 genes, 13 of which encoding for proteins which are part of the core subunits of the respiratory complexes I, III, IV and V, the others encoding for 2 rRNAs (12S and 16S) and 22 tRNAs necessary for mtDNA translation (Ylikallio et al., 2010). Moreover, the strands of the duplex DNA can be distinguished on the basis of G+C content in heavy (H, G-rich) and light (L, C-rich) strands (Kasamatsu et al., 1974). Most of the information is encoded on the H strand, that includes 2 rRNAs, 14 tRNAs and 12 polypeptides, while the L strand codes for only 8 tRNAs and one polypeptide.
10
1.2.2.1 Replication models of mtDNA
It is known that each cell contains numerous mitochondria and that each of them contains several hundreds to thousands copies of mtDNA, probably due to the faster evolution of mtDNA in respect to nuclear DNA (Kato, 2001). Therefore, replication of mtDNA is essential to the maintenance of the mtDNA copy number per cell, but there is any agreement about how mitochondrial DNA replicates itself. For this reason, three main models have been proposed (figure 8). The strand-displacement model is the first, proposing that the synthesis of H strand initiates at the OH origin within the D-loop and proceeds continuously. Continuing the H strand
synthesis, replication intermediates progressively distance from the parental H stand maintained in a single stranded form, while the L strand synthesis begins at about two thirds of the distance around the genome, when the OL get exposed, and proceeds continuously
(Kasamatsu and Vinograd, 1973). The second model is the strand-coupled model and it is based on what happen during DNA replication in bacteria, with the presence of fully double-stranded DNA theta-like replication intermediates which are indicative of coupled H and L strand synthesis and of a bidirectionally progression of the replication. The progression ends within the D-loop region (Holt et al.,2000). Finally, the third model proposed is that referred to as RITOLS (RNA Incorporated Through Out the Lagging Strand) (Yasukawa et al., 2006). It suggests that during mtDNA replication, RNA is incorporated throughout the H strand and implies strand-coupled replication proceeding unidirectionally from the D-loop region, with the RNA replication intermediates subsequently being maturated into DNA (Holt and Reyes, 2012; McKinney and Oliveira, 2013).
11
1.2.3 Mitochondrial Theory of Aging and mtDNA rearrangements
Among the proposed theories of aging, one of the most popular is the Free Radical/Mitochondrial Theory of Aging (MTA), proposed by Harman in 1956. At the beginning, this theory postulated that the increase of reactive species of oxygen (ROS), that are generated in mitochondria as a “waste” of aerobic respiration and several other catabolic and anabolic processes, lead to damage of the cellular components, including nucleic acids on the genome and in this way to cellular senescence (Harman, 1956; Halliwell, 1991). Hereafter, the theory was redefined since mitochondria were identified as both the source and the target of ROS, and in particular mtDNA is the main keeper of damage. In fact, the proximity of the mtDNA to the ROS source makes it more susceptible to injury, which can be converted to point mutation and deletions and the latter can be transmitted and accumulated to daughter molecules throughout replication process, changing the hereditary information over time (Shokolenko et al., 2014). In this way, the accumulation of mutations in mtDNA may arrive to a critical threshold causing adverse effects especially in those mitochondria where components of the respiratory chain improperly function or are damaged and need to be replaced (Chistiakov et al., 2014). However, inefficient transfer of electrons across the electron transport chain generates more ROS, that in turn can damage mitochondria and further decrease the efficiency of ETC, constituting a “vicious cycle” that lead to more mitochondrial ROS generation and oxidative damage (Ziegler et al., 2014), as well as more mtDNA modifications. Indeed, mtDNA shows a high mutation rate, due to its vicinity with ROS source and to the occurrence of spontaneous errors generated through DNA replication or unrepaired damage to mtDNA that introduces mis-coding lesions (Santoro et al., 2006; Copeland and Longley, 2014). The random distribution of mtDNA molecules during cell division can generate two different situation: the former is named heteroplasmy and indicates the coexistence of mutated and wild-type mtDNA molecules in the same cell, tissue or organ, while the second one is named homoplasmy and indicates cells containing only one type of mtDNA molecules, mutated or wild-type (Santoro et al., 2006). As suggests by Trifunovic’s experiment on mtDNA mutator mice, these random distributed mtDNA mutations are associated with age. In fact, these engineered mice accumulated mtDNA mutations during the process of mitochondrial biogenesis, due to a defect in the proofreading function of mitochondrial DNA polymerase, developing a premature onset of age-related phenotypes, like weight loss, reduces subcutaneous fat, alopecia, anemia, reduced fertility, kyphosis, progressive hearing loss, heart disease, decreased spontaneous activity and sarcopenia (Trifunovic e al., 2004).
12 Nevertheless, even if it is well known that age-associated mtDNA mutations occur and are distributed randomly in the mitochondrial genome, differential pattern of mtDNA point mutations accumulation and some differences between in mitotic and post-mitotic tissues appear. In particular, base substitutions are the most common type of mtDNA mutations in mitotic tissue, while in post-mitotic tissues, large-scale deletions occur more commonly (Shokolenko et al., 2014).
mtDNA deletions refer to mtDNA molecules that have lost large section of the mitochondrial genome (Krishnan et al., 2008; fig. 9) and originate as an interplay of large number of base-pair direct repeats contained in mtDNA with the asynchronous replication of the heavy and light strands (Kovalenko et al., 1998). Recent studies also suggest that mtDNA deletions arise not only by defective replication, but also during repair of damaged mtDNA, since during aging, oxidative damage leads to generation of double strands breaks that, when are processed, generate single-strand regions free to anneal with microhomologous sequences on other single-stranded mtDNA or with non coding region. The resulting formation of an intact mitochondrial genome carrying a deletion is due to the processes of repair, ligation and degradation of the single strands that remain exposed (Cui et al., 2012). Most mtDNA deletions share that they are located between the two origins of replication (OH and OL), also known as
major arc of mtDNA (Krishnan et al., 2008), but a clear pattern of mtDNA deletions show how accumulation intervene with age (Kazachkova et al., 2013). Between these, the most studied in human is a 4977bp deletion, also named “common deletion”, that generate a mtDNA molecule lacking of the genes for NADH dehydrogenase subunits 3, 4, 4L and 5, cytochrome c oxidase subunit III and ATP synthase subunits 6 and 8 (Hebert et al., 2010). In 1992, Cortopassi and colleagues demonstrated that dissimilar levels of this deletion appeared in different tissues of older individuals, and in particular brain stem and brain cortex, heart, psoas and diaphragm muscles have higher levels of the common deletion than skin, lung, spleen, kidney and liver. They therefore suggested that tissues with elevated oxygen consumption, as muscle and brain are, have higher levels of oxidative damage to mtDNA, causing also increased deletion frequency (Cortopassi et al., 1992). Later, in 1997, also Zhang and colleagues corroborated this study also in animal model, demonstrated that in rats the mtDNA deletions differently accumulate in different tissues (Zhang et al., 1997). Therefore, as mtDNA deletions are tissue-specific, it is likely that mitochondrial dysfunction with different grade of severity are caused by different levels of mtDNA deletions (Frahm et al., 2005).
13
Figure 9: Schematic representation of mtDNA deletions in which each line represents a possible deleted region of mtDNA (Payne et al., 2011)
Furthermore, in addition to qualitative changes in mtDNA, also quantitative alterations in mtDNA amount (mtDNA copy number) have been associated with mitochondrial disease and ageing (Masuyama et al., 2005). Several studies, both in rodents and in humans, were conducted but contrasting data emerged about the age-related changes in mtDNA coy number (Santoro et al., 2006). Barazzoni and colleagues analyzed mtDNA copy number in rats, founding that it was significantly decreased in almost all tissue from old animals even if also this reduction showed a tissue-specificity: mtDNA decline was similar in the red and white portions of the skeletal muscle gastrocnemius, while it was higher in soleus muscle and highest in the liver. Instead, mtDNA copy number did not change with age in rat’s hearts (Barazzoni et al., 2000). Also in humans, different tissues show different changes of the amount of mtDNA with age. In particular, in human lung there is an age-dependent increase in mtDNA copies (Lee et al., 1998), while in blood there is a significant decrease (Bai et al., 2004). A different situation appears for skeletal muscle, for which there are any consensus data yet: Pesce analyzed mtDNA copy number in vastus lateralis and rectus abdominalis, finding that in both the mtDNA content increased about 2-folder in elderly individuals (Pesce et al., 2001). However, in 2003 Welle found that in human vastus lateralis, the mtDNA amount diminished with age (Welle et al., 2003). Still different data come from the study of Frahm, which, analysing mtDNA copy number in five diverse tissues (caudate nucleus, the frontal lobe brain, cerebellar cortex, ilipsoas muscle and heart), did not find any significative age-related changes (Frahm et al., 2005). These reported discrepancies in mtDNA abundance may be due to the different methods utilized to quantify the mtDNA content and also to the region analyzed for estimation of mtDNA copy number, especially if this corresponds to the mtDNA region
14 frequently deleted. However, these data also show a marked tissue specificity (Santoro et al., 2006; Hebert et al., 2010; Kazachkova et al., 2014) that can be attributable to the tissue specific need of oxidative metabolism and to its oxidative capacities (Santoro et al., 2006) as well as to the developmental stage.
Therefore, loss of mtDNA copy number control affect human aging (Clay Montier et al., 2009), together with respiratory chain deficiency due to high levels of mtDNA rearrangements, like clonally expanded deletions (Trifunovic and Larsson, 2008).
1.2.4 Nuclear-mitochondrial interconnections
Inside the cells, mitochondria are not self-supporting entities, since the preservation of their function are governed by genes present in mitochondrial DNA but also by genes located in chromosomal DNA (Taanman JW, 1999; Zhang and Singh, 2014). Moreover nuclear-encoded proteins are fundamental for the maintenance and the expression of mtDNA (Trifunovic and Larsson, 2008). This is probably due to the fact that during evolution there is a great translocation of the original information encoded by mitochondrial genome into the nuclear genome, which now coded structural mitochondrial proteins. Thus, nucleus has to be constantly informed about the functional status of mitochondria, in order to regulate mitochondrial activity, in both physiological and pathological conditions (Santoro et al., 2006; Dato et al., 2013). Therefore the cross-talk between nuclear and mitochondrial genome has to be intact to ensure normal mitochondrial biogenesis, dynamics, mitophagy, quality of the mitochondrial proteins and finally scavenging of ROS (Michel et al., 2012).
1.2.4.1 Mitochondrial biogenesis
Mitochondrial biogenesis refers to either the formation of mitochondria during cell cycle, the genesis of organelles for normal turnover and the phylogenesis and ontogenesis of mitochondria (Attardi and Schatz, 1988; Shepard et al, 1998). As for many processes that happening in mitochondria, also mitochondrial biogenesis is dependent of the import of a large number of proteins encoded by nuclear genes and then transferred by the translocase of the outer mitochondrial membrane (TOMM) complex in the mitochondrial sub-compartments. Mutations on these translocases, like for instance TOMM40, lead mice to death in 4-6 weeks for abnormal heart, pulmonary vascular congestion and hypertension (Desler and Rasmussen, 2014).
Anyway, the formation of new mitochondria depends also by others players, like Pgc-1α, that is the main regulator of mitobiogenesis. It is regulated by several external stimuli, such as cold exposure, energy deprivation, caloric restriction or physical activity (Michel et al., 2012). In
15 particular physical activity or nutrition stress cause post-translational modification of Pgc-1α through the deacetylation mediated by sirtuins (SIRT1 and SIRT3), that are able to activate PGC-1α and its mitochondriogenesis pathway (López-Llunch et al., 2008; Gurd, 2011; Johnson et al., 2013). In turn, Pgc-1α activates nuclear respiratory factors 1 and 2 (Nrf1/2), which are, above all NRF1, potent stimulators of the expression of mitochondrial transcription factor A, TFAM (Viña et al., 2009). TFAM, together with DNA polymerase γ (POLγ), twinkle and mitochondrial single strand binding protein (mtSSB) are responsible to carry out mtDNA replication and repair, through mtDNA helix destabilization and replication, which is an essential component of mitochondrial biogenesis (Michel et al., 2012).
1.2.4.2 Mitochondrial dynamics
Mitochondria are not isolated organelles, but rather they exist in a dynamic network adapting to cellular needs constantly through fusion and fission processes. Moreover, these processes are fundamental also to regulate mitochondrial morphology and number (Romanello and Sandri, 2010), in an opposing way (Mishra and Chan, 2014). The former generates an extended interconnected network, starting from isolated mitochondria which can thus mix their contents and redistribute metabolites, proteins and mitochondrial DNA, preventing the accumulation of defective or abnormal mitochondria. Instead the latter allows the segregation of dysfunctional mitochondria from the network components, resulting in the activation of autophagy (Romanello and Sandri, 2010).
In humans, the key factors of the fusion machinery are GTP-hydrolysing enzymes located either in the outer and in the inner membranes: the OMM fusion is driven by mitofusin 1 and 2 (Mfn1/2), whereas the IMM are fused by dynamin-related protein optic atrophy 1 (OPA1) (Zorzano et al., 2010). For the opposite mechanism of fission, dynamin-related protein 1 (DRP1) and mitochondrial fission 1 (Fis1) are required, leading before to the constriction and after to the fission of the mitochondrion (fig. 10; Mishra and Chan, 2014).
16
1.2.4.3 Mitophagy
Autophagy is the process by which organelles are surrounded by double membrane that fuses with lysosomes, allowing the hydrolytic digestions and recycling (Klionsky, 2007). Mitophagy is simply a selective type of autophagy targeted to mitochondria (Okamoto and Kondo-Okamoto, 2012). Indeed, digestion of the entire organelles by mitophagy allows the control of the abundance of mitochondrial population through the right level of turnover (Michel et al., 2012), but above all mitophagy is the key mechanism of the mitochondrial quality control system, which is evolved to avoid cell damage and maintain the overall fitness of the cell (Gomes and Scorrano, 2013). Fission is strictly linked to mitophagy, since it generates unequal daughter mitochondria, that differ in membrane potential, and in particular, the dissipation of the membrane potential lead to proteolytic processing of OPA1, causing the inhibition of mitochondrial fusion and ensuring effective mitophagy (Okamoto and Kondo-Okamoto, 2012). E3-ubiquitin ligase Parkin (Parkin) and the PTEN-induced putative kinase 1 (PINK1) are the main factors that cause the collapse of membrane potential, following by the action of Beclin and AMBRA1 (activating molecule in beclin 1-regulated autophagy) that localize on endoplasmic reticulum and mitochondrial surface respectively to stimulate autophagy (Michel et al., 2012; Okamoto and Kondo-Okamoto, 2012).
Interestingly, cells lacking mtDNA are autophagic-deficient, but also a controlled degradation of the organelle represents a crucial steps for proper mitochondrial and cell function (Michel., 2012).
1.2.4.4 Protein Quality Control System
Mitochondrial proteins, such as the others proteins present inside the cells, have to be kept properly folded, while damage or aggregated proteins have to be rapidly degraded by proteases (Michel et al., 2012). In particular, oxidized proteins have to be eliminated in order to maintain mitochondrial homeostasis (Bulteau el al., 2006). For this reason, inside mitochondria there are three known proteases, all of which are able to degrade short-lived, misfolded or damaged proteins (Bota et al., 2005). One of these, AAA protease, is localized in IMM, whereas Clp and Lon proteases are immersed in the mitochondrial matrix. In particular, Lon Protease (LonP) is the most studied, since it is the main protease for degradation of oxidized proteins, even if does not recognize a specific consensus peptide sequence (Ngo et al., 2013).
LonP is age-modulated, as demonstrated in old rats by Bakala and colleagues. The Lon activity in these animals, in fact, was found decreased by 2.5 fold in liver, even if the level of protein in
17 the mitochondrial matrix remained the same, as to indicate Lon inactivation. In heart, instead, the activity is similar between young and old rats, but the protein level was 5-fold increased, suggesting a sort of compensation for the loss of activity (Bakala et al., 2003).
1.2.4.5 Super oxide product scavenging
Inside cells, ROS carry out multiple functions, such as cell migration, proliferation, differentiation and they are also essential for signalling cascades. However, when the redox equilibrium is lost, ROS abundance causes a state of oxidative stress that is linked also to the aging process (Scheurmann et al., 2014). For this reason, during evolution, a variety of defense mechanisms have been developed to remove ROS from cells (Trifunovic and Larsson, 2008), since they are a well-known cause of oxidative damage, which in turn has long been suggested as a possible cause of mtDNA mutations and deletions (Wanagat et al., 2015).
In mammalian cells sophisticated antioxidant defenses are present in order to scavenge ROS in non-toxic forms. These include catalase, glutathione peroxidase and superoxide dismutase, SOD (Cui et al., 2012). Superoxide dismutases are responsible to catalyze the conversion of superoxide radicals (O2•-) to hydrogen peroxide (H2O2) and O2; inside the cells there are three
isoforms of SOD that are noticeable by the intercellular localization: SOD1, or CuZn-SOD, is present in cytoplasm, SOD2, or MnSOD, is the prevalent mitochondrial isoform, being distributed in the mitochondrial matrix, and finally SOD3, or extracellular SOD, that it can be found in lymph, synovial fluid, plasma and all the other extracellular fluids (Watanabe et al., 2014).
Different sod-null mutant mice were generated in order to understand the role of the different SODs: Reaume and colleagues described a shortened lifespan in mice sod1-/- mice (Reaume et
al., 1996), Li and colleagues studied sod2-/- mice, that showed neonatal lethality (Li et al., 1995)
and finally Carlsson et al. generated sod3-/- mice which, conversely from the others, exhibited a
shorter survival time under hyperoxic condition, with no apparent abnormalities until late in life (Carlsson et al., 1995).
1.3 Telomeres
1.3.1 Telomeres and aging
Telomeres are long sequences of non-coding DNA, located at the end of chromosomes, where the specific TTAGGG hexanucleotide sequence is repeated thousands time in tandem and is associated with protein complexes. Shelterin is the name of the specialized multi-protein
18 complex, composed by six proteins: TRF1 and TRF2, binding telomeric double strand DNA, RAP1 that interacts with TRF2, TIN2 and TPP1, which are linker proteins that stabilize and hold the complex together and POT1, that instead binds telomeric single strand DNA. In fact, telomeres contain a region of double-stranded (ds) and a region of single-stranded (ss) DNA, that is an extension at the 3’ end of the G-rich strand and consists in about 100 nucleotides. It can form a telomere-loop (t-loop) structure, in order to mask the chromosomal ends by strand-invading into the ds DNA thus forming a displacement loop (D-loop) (Sahin and DePinho, 2012). This peculiar structure allows performing two protective functions: telomere prevent chromosomal end-end fusion and non reciprocal translocation (Hoare et al., 2010). Indeed, at each cellular division a telomeric fragment of 50-200bp is lost, causing progressive shortening of telomeres that, in fibroblast, is related to progressive loss of the proliferation capacity after a limited number of cell divisions, a phenomenon called by Hayflick limit or cellular replicative senescence (Hayflick and Moorhead, 1961).
Senescence is now known to be triggered by telomeres shortening or disruption, but it is largely heterogeneous, probably because several factors participate, such as telomere structure and composition, telomerase availability and activation state, interplay between proteins, telomerase and DNA replication machinery (Stewart et al., 2012). Also environmental factors like stress, pathologies and ROS can increase telomere shortening by increasing telomeric DNA damage and telomere shortening rate (Saretzki and von Zglinicki, 2002).
However, telomere length is regulated by telomerase, i.e. a reverse transcriptase consisting of a complex of several proteins and RNA template (Cong et al., 2002), that increases telomere length adding TTAGGG repeats, in order to maintain the telomeric length in embryonic cells, in adult stem cells and finally in cancer cells (Hoare et al., 2010). Conversely, in most somatic cells telomerase is suppressed within few weeks after birth (Oeseburg et al., 2010). Moreover, it was seen that in some human premature diseases telomerase complex is mutated, resulting in decreased telomerase stability and shorter telomeres (Mitchell et al., 1999), proving a plausible involvement in aging process.
1.3.2 Telomere and mitochondria, a connection in aging
Since mitochondria are the most important source of ROS in the cells, a possible role of mitochondria and oxidative stress in telomere-driven replicative senescence has been proposed. Knowing that ROS production and mitochondrial dysfunction are involved in aging and that mitochondrial dysfunction induces a retrograde response to signal the disruption of the ETC to the nucleus, it is possible that nucleus implement an adaption response. Likely, this
19 retrograde signalling of adaption response corresponds to the up-regulation of mitochondrial biogenesis induced by PGC-1α and PPARγ and increases mitochondrial uncoupling, causing a reduction in ROS production by the mitochondria, with less oxidative stress impacting on telomeres (Passos et al., 2007).
Supporting the connection between telomeres and mitochondria during aging there is the fact that chronic or mild long lasting oxidative stress causes exportation of telomerase from the nucleus to the mitochondria, avoiding its activity on telomeres. However, it has been shown that the catalytic subunit of telomerase (TERT) may have a telomere-independent function in mitochondria, carrying out the protection of mitochondria and mtDNA from ROS-induced damage as a result of improved mitochondrial function, decreased ROS production, increased mitochondrial coupling and suppressed retrograde response (Ahmed et al., 2008).
Basing on the fact that telomere maintenance is controlled also by some proteins involved in the repair pathways, it is clear that active genome maintenance and repair systems are fundamental to avoid premature aging. Thus, a constitutive activation of repair pathways with sustained p53 induction could be due to shortened of disrupted telomeres, as signal of DNA damages. In turn, p53 activation can lead to cell growth arrest, stimulation of repair, apoptosis or senescence pathways depending on its degree of activation, in addition to mitochondrial changes, due to its binding with the promoter of the mitochondrial transcriptional co-activators family of PGC-1α, master regulators of mitochondrial biogenesis, as shown in figure 11 (von Zglinickiet al., 2001; Sahin and De Pinho, 2012;).
20
2 Aim of the thesis
Aging is characterized by an increasing propensity to degenerative diseases and death due to the progressive decline in the functional maintenance of tissue homeostasis (Hayflick, 1998), caused by the accumulation of unrepaired and deleterious changes of molecules and cells. Thus, in order to compensate and neutralize the adverse effects of such damages, each tissue acts out a series of adaptive mechanisms resulting in the tissue-specificity of the aging process (Meissner et al., 2006; Ostan et al., 2008).
However it is well known that age-related declines in mitochondrial function underlie several of those biological changes that cause an incremented vulnerability to multiple disease states, functional and cognitive decline and, at the end, mortality (Ashar et al., 2014). Mitochondrial dysfunction includes decreased oxidative capacity and increased oxidative damage to biomolecules (DNA, proteins and lipids) due to the excessive production of reactive oxygen species, which are highly toxic (Chistiakov et al., 2014). In particular, ROS can damage mitochondrial component like mitochondrial DNA (mtDNA), causing mtDNA point mutations, varying its copy number or inducing mtDNA deletion. Thus, mtDNA rearrangements, intended as mtDNA copy number, deletion level and integrity, are likely to play an important role in the aging process. Several studies investigate mtDNA copy number or mtDNA deletion in different tissue from either human and animal models but data on mtDNA rearrangements are still controversial.
Thus, in order to understand the involvement of mtDNA rearrangements during human aging, the primary aim of this thesis is the analysis of mtDNA copy number, deletion level and integrity, in human biopsies from liver, vastus lateralis skeletal muscle from healthy subjects and patients with limited mobility of lower limbs (LMLL) undergone hip replacement surgery, and adipose tissue. The biopsies were recruited in the framework of the project MIUR-PRIN 2008, for what concern liver, whereas all muscle and adipose tissue biopsies were recruited in the framework of the European project MYOAGE (Understanding and Combating age related muscle weakness; FP7-223576; 2008-2012), and all of them are from subjects at different ages. Moreover, the telomere length was also investigated, considering its possible relationship with mitochondrial function (Sahin et al., 2011) and its role as marker of cellular aging.
To further characterise the involvement of mtDNA rearrangements in the aging of human liver, skeletal muscle and adipose tissue, the expression of nuclear genes related to mitochondrial biogenesis (pgc-1α, polɣ, nrf1, tfam, twinkle, sirt1, sirt3, tomm40 and ppard), mitochondrial dynamics, i.e. fusion and fission processes (mfn2, fis1 and opa1), mitophagy (ambra1, beclin,
21
pink1, parkin, atg16l and pik3cd), mitochondrial protein quality control system (lonp),
production of ROS (nos3), protection from ROS (sod1 and sod2) and hypoxia (hif-1α) were also evaluated in the same samples.
Finally, a comparison among the considered tissues was realized, in order to understand the tissue specificity of mtDNA rearrangements and to extend the comprehensive and age-independent vision of tissue-related variability in mtDNA rearrangements and of the nuclear genes expression involved in mitochondrial pathways, which is still poor of evidences.
22
3 Materials and methods
3.1 Tissues samples
For the present work, biopsies from three different human tissues have been collected.
For human liver, 82 biopsies have been obtained from organ donors at different ages (13-84 years) in collaboration with the Unit of Surgery of liver and multi-organ transplants of the S. Orsola-Malpighi Hospital in Bologna, in the framework of the project MIUR-PRIN 2008 coordinated by Dr. Gianluca Grazi (Transplantation Unit) and Dr. Miriam Capri (Lab of Immunology of Prof. Franceschi). The biopsies have been recovered during the explants of the liver, which were performed at beating heart.
For skeletal muscle, biopsies of vastus lateralis were taken from two group of subjects recruited in the framework of the European Project MYOAGE. The former was the patients group, i.e. 50 biopsies from subjects with lower limb mobility impairment (LLMI) who underwent hip replacement surgery, recruited in Bologna, Italy (Prof. Ermanno Martucci, Istituto Ortopedico Rizzoli, Bologna). The latter enclosed 109 biopsies from healthy subjects of two different age groups, subjects under 40 years and subjects that are more than 65 years old, coming from Tartu, Estonia (Prof Enn Seppet, Centre of Molecular and Clinical Medicine, University of Tartu) and Leiden, the Netherlands (Prof. Andrea Mayer, Department of Gerontology and Geriatrics, Leiden University).
From LLMI patients were also picked up 20 biopsies of adipose tissue in order to obtain two different tissues from the same subjects. For this reason, the range of age of adipose tissue is the same of LLMI patients group (24-89 years).
Table 1 shows the number of samples studied in this thesis grouped by tissue, age and gender.
Liver LLMI muscle Adipose Tissue Healthy muscle Age Group
(age range)
Gender Total Gender Total Gender Total Age Group (age range) Gender Total M F M F M F M F 1: ≤30 10 5 15 10 5 15 2 1 3 1: ≤40 15 21 36 2: 31-50 10 4 14 7 4 11 3 1 4 2: ≥65 38 35 73 3: 51-70 11 15 26 5 7 12 2 3 5 4: ≥71 14 13 27 6 6 12 4 4 8
23
3.2 Nucleic acid isolation and purification
3.2.1 DNA isolation
3.2.1.1 Liver and skeletal muscle biopsies
Quick-gDNA™ MiniPrep kit from Zymoresearch (USA) was used to isolate total DNA from liver and vastus lateralis muscle biopsies, since it allowed the isolation of total DNA from various biological sample sources, including different solid tissues, as in this case.
To obtain total DNA is not require the use of organic denaturants or Proteinase K digestion, but just columns with high DNA affinity. Following the provided data sheet:
1. Homogenize about 25mg of frozen biopsy in 500μl of Genomic Lysis Buffer by an automatic homogenizator
2. Centrifuge the lysate at 10000 x g for 5 minutes
3. Transfer the supernatant to a Zymo-Spin™ Column in a Collection Tube, without disturb the pellet debris
4. Centrifuge at top speed for one minute and discard the Collection Tube with the flow trough and transfer the Zymo-Spin™ Column to a new Collection Tube
5. Add 200μl of DNA Pre-Wash Buffer to the spin column and centrifuge at 10000 x g for one minute
6. Discard the flow trough, add 500μl of g-DNA Wash Buffer to the spin column and centrifuge at 10000 x g for one minute
7. Transfer the Zymo-Spin™ Column in a new and clean eppendorf tube and add 70μl of Elution Buffer
8. Incubate for 5 minutes at room temperature 9. Centrifuge at 10000 x g for 30 seconds to elute DNA
Purified DNA is suitable for many experiments, like quantitative Real Time PCR, but before its use, all samples were quantified by Nanodrop spectrophotometer (see paragraph 3.2.4) and normalized to a working concentration of 0,4ng/μl.
3.2.1.2 Adipose tissue biopsies
To isolate total DNA from adipose tissue biopsies ZR Genomic DNA™ –Tissue MiniPrep kit from Zymoresearch (USA) was utilized since it allowed the isolation of total DNA from specific solid tissues, as adipose tissue.
24 1. Put a sample of about 25mg of frozen biopsy in a microcentrifuge tube and add, mixing, 95μl of H2O, 95μl of 2X Digestion Buffer and 10μl of Proteinase K. Incubate the
eppendorf at 55°C for 3hours
2. Add 700μl of Genomic Lysis Buffer to the tube and vortex 3. Centrifuge at 10000 x g for 1 minute to see insoluble debris
4. Without disturb the pellet, transfer the supernatant to a Zymo-Spin™ Column in a Collection Tube and centrifuge at 10000 x g for 1 minute
5. Change the Collection Tube and add 200μl of DNA Pre-Wash Buffer to the spin column. Centrifuge at 10000 x g for one minute
6. Discard the flow trough, add 400μl of g-DNA Wash Buffer to the spin column and centrifuge at 10000 x g for one minute
7. Transfer the Zymo-Spin™ Column in a new and clean eppendorf tube and add 70μl of water and incubate for 5 minutes at room temperature
8. Centrifuge at 10000 x g for 30 seconds to elute DNA
After purification, all DNA samples were quantified by Nanodrop spectrophotometer (see paragraph 3.2.4) and normalized to the working concentration of 0,4ng/μl.
3.2.2 RNA isolation
RNA was extracted by mirVana Isolation Kit (Life Technologies, California, USA), from about 25mg of frozen biopsies from each tissue.
The whole procedure was performed on ice, and the following protocol has been used:
1. Mechanically homogenize the biopsies in 10 volumes per tissue mass of lysis buffer (Lysis\Binding Buffer)
2. Add 1/10 volume of miRNA Homogenate Additive to the homogenate and incubate for 10minutes
3. Add a volume of acid-phenol:chloroform equal to the initial volume of lysate and mix by vortex for 60 seconds
4. Centrifuge at 10000 x g for 10 minutes to separate aqueous and organic phase
5. Transfer carefully the aqueous upper phase, containing the RNA, in a new eppendorf and add 1.25 volumes of room temperature 100% ethanol, mixing with pipette
6. Transfer up to 700 μl of solution to a spin-column (Filter Catridge with Collection Tube) and centrifuge at 10000 x g for 30 seconds. Discard the flow through and repeat until all solution pass to the filter
25 7. Add 700 μl of Wash Solution 1 and centrifuge at 10000 x g for 30 seconds, discarding
the flow through
8. Wash two time the filter through adding 500 μl of Wash Solution 2/3, and centrifuging at 10000 x g for 30 seconds
9. Transfer the filter to a new eppendorf and add 70 µl of pre-heated 95°C RNase-free sterile H2O. Centrifuge at 10000 x g for 30 seconds to elute RNA
Isolated RNA was tested with electrophoresis on 1% agarose gel to evaluate the quality and integrity. Each sample was prepared with 3 µl extracted RNA, 2 µl H2O and 1 µl Bromophenol
6X, loaded on the gel and run at 60-80 V for 30-45 minutes, monitoring voltage and run time to avoid excessive heating and RNA degradation. A positive control RNA has been also loaded on the gel. Extracted RNA was stored at -80°C.
3.2.3 RNA treatment with DNAse
To eliminate possible DNA traces, RNA extracted with mirVANA Isolation Kit was treated with DNase of Turbo DNA-free kit (Life Technologies, California, USA). Following the company indications, 2 µl of Turbo DNase Buffer and 1 µl of Turbo DNaseI enzyme were added to 17 µl of RNA and incubated at 55°C for 25 minutes. After this incubation time, 2 µl of DNase Inactivation Reagent were added to the mixture that was incubated for 5 minutes at room temperature and then centrifuged at 10000 x g for 90 seconds. Later than centrifugation, the supernatant was recovered avoiding removal or touching of the pellet with pipette tip and 3 µl of treated RNA were transferred in a new eppendorf to quantify them by Nanodrop spectrophotometer (see paragraph 3.2.4).
3.2.4
Nucleic acid quantification
NanoDrop 1000 spectrophomometer (Thermo Scientific, Wilmington, USA) was used to quantify isolated DNA and DNase treated RNA in order to later normalize samples in the working solutions.
Measurements for both DNA and RNA were expressed as ng/μl and taken in triplicate, utilizing each time 1 µl of sample. The mean value was used as final concentration. Also other two parameters (260/280 and 260/230 ratio) were taken into account to assess samples purity and identify potential contaminations. In particular, for the 260/280 ratio values should be around 1.8 for pure DNA and around 2.0 for pure RNA, while for the ratio 260/230 around 2.0-2.2. Lower values may indicate presence of contaminants and residues of reagent used in the extraction protocol (for example phenol).
26
3.3 cDNA synthesis
SuperScript® III First Strand Synthesis System for RT-PCR (Life Technologies, California, USA) was used to convert DNase treated RNA in cDNA.
Following the provided protocol, the quantified RNA was used to start with 750ng, 250 ng and 150 ng of RNA for liver, muscle and adipose tissue respectively for a maximum of 12,5 µl. To this first solution of RNA and water, 0,5 µl of Random Primer 3 µg/µl and 1 µl of dNTPs 2.5 mM were added and incubated for 5 minutes at 65°C on ice for 2 minutes. Then, before continuing the RT-PCR program, 4 µl of Buffer FS 5X, 1 µl of DTT 0.1M and 0,5 µl of SuperScript III 200 U/ µl were added to each starting solution.
All the reagents used for the cDNA synthesis reaction and the overall RT-PCR program are summarized in the tables 2 and 3:
Reagent Volume Step
DNAseI treated RNA 750/250/150 ng Random primer 3 µg/ µl 0.5 µl Addition 1 dNTPs 2.5 mM 1 µl Buffer FS 5X 4 µl Addition 2 DTT 0.1 M 0.5 µl SuperScript III 200 U/ µl 0.5 µl
Table 2: RT-PCR reagents for cDNA synthesis.
Steps 5’ at 65°C 2’ on ice Addition 2 5’ at 25°C 50’ at 50°C 15’ at 72°C
Table 3: RT-PCR program for cDNA synthesis.
cDNA was then diluted 1 to 10 to use it for qPCR assays and then stored at -80°C.
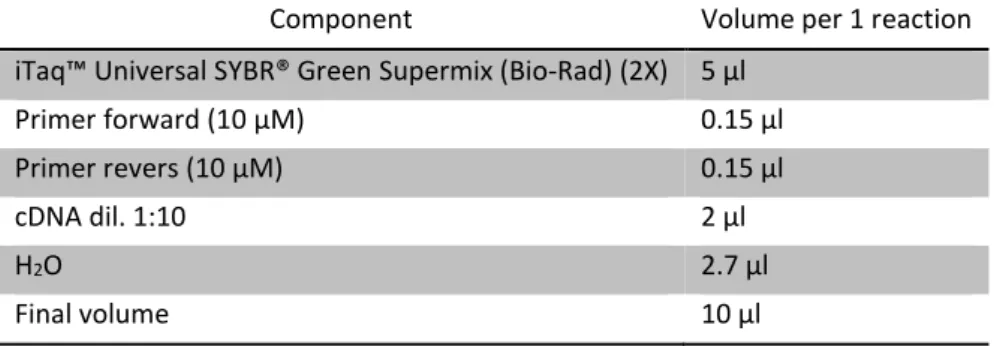
3.4 Quantitative Real Time PCR SYBR® Green assay
Quantitative Real Time polymerase chain reaction (qPCR) assay allows the simultaneous amplification and quantification of target nucleic acid after every reaction cycle, detecting the amplification product through the use of a fluorophore. In this case, the used fluorophore is
27 SYBR® Green I, enclosed in the two utilized master mixes, MesaGreen qPCR MasterMix for SYBR® Assay No Rox (Eurogentec, Belgium) and iTaq™ Universal SYBR® Green Supermix (Bio-Rad, USA). Both master mixes contain also the other necessary components for the amplification reaction, like dNTPs, MgCl2, and stabilizers but they differ for the polymerase
enzyme (MeteorTaq DNA polymerase and antibody-mediated hot-start iTaq DNA polymerase, respectively) and thus for the thermal profile that has to be used. The fluorophore is important because it binds aspecifically double-strand DNA (dsDNA) and the complex fluorophore-DNA absorbs blue light at wavelength λmax = 494 nm and emits green light with λmax = 520 nm, in
order to monitor the reaction progression. The melting curve analysis, instead, consent to evaluate the specificity of the amplification, which relies mainly on the primers, since it is built at the end of the amplification reaction by a gradual and regular increase in temperature that gradually denature the dsDNA. When the dsDNA is denaturated, the intensity of the fluorescence dramatically decreases, as shows the melting curve graph. The trend illustrates a pick which represents the temperature at which the 50% of DNA duplex are disrupted (melting temperature, Tm). The Tm is specific for each amplicon. Real time PCR was performed on a
Rotor-Gene Q 6000 (Qiagen, USA) thermalcycler, that has a Rotor Gene Q Series Software
being able to analyze qPCR data with a comparative method, since it compare the Ct values of
the samples of interest with that of a sample used as calibrator which will be run with all samples, without using a standard curve as a reference. The Ct values represent the number of
cycle required for the fluorescent signal to cross the threshold and is inversely proportional to the amount of target nucleic acid in the sample. The quantification of the samples were then obtained with the delta delta Ct (ΔΔCt) method (Pfaffl, 2001), since the final value is gained
from the subtraction of the delta Ct of the gene of interest and the delta Ct of the gene used as
reference.
This method has been used to assess in each tissue:
mtDNA rearrangements (mtDNA copy number, deletion level and integrity) on extracted DNA
telomere length on extracted DNA
gene expression on cDNA synthetised from isolated RNA The details of each assay are described below.
3.4.1 mtDNA rearrangements analysis
As written above, real time qPCR SYBR® Green assay has been used to determine copy number, deletion level and integrity of mtDNA.
28 To quantify mtDNA copy number a primers pair to amplify the mitochondrial gene nd1, located in a portion of the mtDNA rarely deleted and a primers pair to amplify a nuclear gene, β-actin, which is necessary to normalize mtDNA were chosen.
Instead to quantify mtDNA deletion level, primers for the gene nd4, which is located in the major arch of the mtDNA where deletion frequently occurs, where used in combination with those for nd1.
The ratio between mtDNA deletion level and mtDNA copy number represents the mtDNA integrity, intended as the number of deleted molecules on the total number of mtDNA molecules.
The sequences of utilized primers are described in table 4:
Gene Primers sequence Product size ND1 FOR: CCCTAAAACCCGCCACATCT
REV: GAGCGATGGTGAGAGCTAAGGT 94 ND4 CCATTCTCCTCCTATCCCTCAAC
REV: CACAATCTGATGTTTTGGTTAAACTATATTT 98 ACTB FOR: ACCCACACTGTGCCCATCTAC
REV: TCGGTGAGGATCTTCATGAGGTA 107
Table 4: Pairs of primers for mtDNA deletion level and copy number.
The qPCR assays were conducted on Rotor gene Q 6000 system (Qiagen, USA). The assays for
nd1, nd4 and actin were run together on the same samples in different tube in duplicate. To
obtain compelling results and to perform significant statistical analysis, qPCR reaction was run three times.
Each mix was prepared by following the directions supplied with the Eurogentec MasterMix (Eurogentec, Belgium) protocol in a final reaction volume of 10μl, as described in table 5. In table 6, instead, is described the thermal profile used for qPCR assays, as indicate in the protocol provided with MasterMix by Eurogentec.
Component Volume per 1 reaction Mesa Green qPCR MasterMix
for SYBR Assay No Rox (Eurogentec) (2X) 5 µl Primer forward (10 µM) 0.15 µl Primer revers (10 µM) 0.15 µl
DNA (0.4 ng/µl) 3 µl
H2O 1.7 µl
Final volume 10 µl
29
Condition Cycles Step 95°C for 5 min Initialization 95°C for 15 sec
40 cycles
Template denaturation 60°C for 60 sec Primers annealing 72°C for 20 sec DNA synthesis From 55°C to 99°C Melt
Table 6: Thermal profile of qPCR assays for Eurogentec MasterMix.
3.4.2 Telomere length analysis
To assess telomere length with a relative quantification method a pool of six different DNAs from young subjects was used as calibrator sample in qPCR assays. The primers chosen for telomere and for the reference gene are taken from Cawthon et al., 2002 and are listed in table 7. 36B4 is the reference gene and encodes for the acidic ribosomal phosphoprotein P0. The ratio between the amounts of telomeres and 36B4 was used to calculate the telomere length.
Primers Sequences
Telomere For: 5’-GGTTTT-TGAGGGTGAGGGTGAGGGTGAGGGTGAGGGT-3’ Rev: 3’-TCCCGACTATCCCTATCCCTATCCCTATCCCTATCCCTA-5’ 36B4 D: 5’-CCCATTCTATCATCAACGGGTACAA-3’
U: 5’- CAGCAAGTGGGAAGGTGTAATCC-3’
Table 7: Primers pair for telomere and 36B4.
As previous, the reaction and the thermal profile were set up following the protocol provided with MesaGreen qPCR MasterMix as shown in table 8 and 9.
Reagent Volume per 1 reaction Mesa Green qPCR MasterMix
for SYBR Assay No Rox (Eurogentec) (2X) 5 µl Primer forward (10 µM) 0.15 µl Primer revers (10 µM) 0.15 µl
DNA (0.4 ng/µl) 3 µl
H2O 1.7 µl
Finale volume 10 µl