The impact of Social Responsibility on productivity and efficiency of US listed companies
1 Leonardo BecchettiUniversity of Rome Tor Vergata Stefania Di Giacomo University of Rome Tor Vergata
Damiano Pinnacchio University of Rome Tor Vergata
Abstract
We investigate whether inclusion and permanence in the Domini social index affects corporate performance on a sample of around 1000 firms in a 13-year interval by controlling for size, industry, business cycle and time invariant firm idiosyncratic characteristics. Our results find partial support to the hypothesis that corporate social responsibility (CSR) generates a transfer of wealth from shareholders to stakeholders. On the one side, the combination of entry and permanence into the Domini is shown to increase (reduce) significantly total sales per employee (returns on equity). On the other side, lower returns on equity seem nonetheless to be accompanied by relatively lower conditional volatility and lower reaction to extreme shocks of Domini stocks with respect to the control sample.
The first two econometric findings match intrinsic characteristics since they are paralleled by significant differences in fixed effects between the control sample and firms which will become Domini affiliated in the sample period. Our conclusion is that Domini affiliation significantly reinforces traits of corporate identity which were already in place before entry.
We also show that exit from Domini has strong negative effects on total sales per employee, returns on equity, investment and capital employed. An explanation for the “transfer of wealth” effect, suggested by the inspection of Domini criteria, is that social responsibility implies, on the one side, decisions leading to higher cost of labour and of intermediate output, but may, on the other side, enhance involvement, motivation and identification of the workforce with company goals with positive effects on productivity.
Manca test garch vedere descrittive
Key words: social responsibility, stakeholders, corporate performance.
JEL classification codes: M14, L25.
1
Paper presented ad the XIII Tor Vergata Financial Conference. Support from the Veritatis Splendor Research Project on Social responsibility is acknowledged. The authors thank Helen Alford, Michele Bagella, Iftekhar Hasan, James Lothian, Ferruccio Marzano, Francesco Nucci, Alberto Pozzolo for useful comments and suggestions and Laura Boccardelli, Saverio De Santo and Osea Giuntella for their precious research assistance. The usual disclaimer applies.
1. Introduction
A first minimal definition of social responsibility is generally related to the corporate choice of not
breaching laws and regulations when pursuing shareholders’ wealth maximisation goals. A second
approach considers that CSR is more than just following the law (McWilliams & Siegel, 2001), as it
also involves actions which are expected to affect positively an identifiable social stakeholder’s
welfare. Our analysis is aimed at measuring the impact of this second definition of CSR on
corporate performance.
The debate on the relevance and effects of this second type of corporate social responsibility is
polarised around two opposite perspectives. A first one considers it as a violation of manager’s
responsibility to shareholders, leading to arbitrary management of "free cash flow" and to higher
expenditures which reduce shareholders’ wealth (Friedman, 1962).
2The reasoning of Friedman
(1962) implies an efficient balance of powers between profit maximizing firms and social welfare
maximizing institutions, which is far from the reality of our economic systems. Asymmetric
information, agency costs and conflicts of interests are so widespread that institutions are distant
from the benevolent planners depicted by theoretical models of some decades ago. In the current
“three-pillar” (institutions, corporations and the civil society) system what we observe is
stakeholders creating bottom up pressures on corporations in order to compensate institutional
weaknesses in designing rules which should align firm behaviour to the goal of socially and
environmentally sustainable development (Adriani and Becchetti, 2004). This pressure induces
corporations to signal their social responsibility in order to minimize attrition with stakeholders. In
this framework, CSR is often originated not from an autonomous decision of managers, but by
external pressures of institutions of or consumers.
2
“Few trends could so thoroughly undermine the very foundations of our free society as the
acceptance by the corporate officials of a social responsibility other than to make as much money
for their shareholders as possible”.
Well aware of these linkages between corporations, institutions and consumers, a completely
different and broader perspective considers the social role of corporations and their relationship not
just with shareholders, but with the larger set of firm stakeholders (Freeman, 1984). Freeman
emphasizes that, if stakeholders have voice, the socially responsible behaviour of corporations may
be a rational strategy to minimize conflicts and optimize sinergies in their complex network of
relationships with various stakeholders (local communities, consumers, environmentalist
associations, subcontractors, etc.).
An additional argument for the relevance of CSR comes from the observation that, in a society
riddled by conflicts of interests and informational asymmetries, with weak institutions and
incomplete contracts, the tenet of shareholders wealth maximization may be untenable if corporate
power is not offset by proper checks and balances from institutional action.
In addition to it, we must not forget that maximization of shareholders wealth is a quite narrow goal
also from an aggregate point of view. Shareholder wealth maximization does not coincide with
value creation, while it already implies criteria on how the value created must be redistributed.
Paradoxically, shareholders wealth maximisation may lead to negative externalities and to lower
value creation than the adoption of a socially responsible behaviour. We may, for instance, have a
firm with lower return on equity (because of its higher concern for stakeholders), but higher added
value and contribution to aggregate output (for superior worker’s identification with SR goals)
against another one with higher return on equity and lower value added and contribution to
aggregate output. In the case of banks this trade-off may be even clearer, with a bank maximizing
returns on equity and, for this reason, not financing projects whose return is above the risk adjusted
opportunity cost, but below its return on equity target. On the other side, we may have some banks,
such as microfinance institutions, which, by lending to uncollateralized producers with projects
(...)If businessmen do have social responsibility other than making maximum profits for
stockholders, how are they to know what it is? Can self private individuals decide what the social
interest is ?” (Friedman, 1962)
whose return is above the opportunity costs, significantly enlarge the set of profitable ideas
financed, thereby positively contributing to aggregate growth.
3On this line Tirole (2001) argues that the concept of stakeholder value recognizes that corporate
activity may create negative externalities that need to be counterbalanced, either by institutional
rules or by corporations themselves. In such case, creating shareholders value is not enough to
maximize total welfare and management should aim at “maximizing the sum of various stakeholder
surpluses.” He is though sceptical on the possibility of creating incentives inducing managers to
behave in a socially responsible way. First, he observes that the difficulty of measuring SR fosters
managerial opportunistic behaviour. Second, he argues that a SR company with relatively low
return on equity may be object of a takeover from a profit maximising raider.
A first reply to Tirole (2001) is that several social labelling organisations have born to overcome
informational asymmetries in this field. Hence, a corporation considered as being socially
responsible not just when it claims to be as such, but only if complies with a set of externally fixed
behavioural criteria. In addition to it, bottom-up pressure from SR consumers and investors is the
best substitute for autonomous corporate action fostering CSR. The second Tirole's objection
(takeover risk) is an interesting one and is the object of this empirical research aimed at verifying
whether SR firms are relatively less or more profitable than the rest of the economy.
Overall, the best reply to the above mentioned objections on CSR is that CSR may definitely be a
superior corporate behaviour in terms of social welfare if the expected reduction of negative
externalities is accompanied by a creation of value (and not merely shareholder return) equal or
superior to that of non socially responsible firms. If this is true, a powerful incentive for
corporations to adopt a SR attitude, beyond enlightened altruism, exists. This is why the evaluation
of the effects of SR on corporate performance is a relevant issue in the current debate.
3
The well known Galor-Moav (2004) growth model emphasizes that, while in a first phase of
physical capital accumulation growth is negatively related with equality, in a second phase in which
Our paper focuses on this issue and is divided into seven sections (including introduction and
conclusions). The second section discusses expected costs and benefits arising from the adoption of
a SR behaviour. The third section briefly surveys the empirical literature on the effects of SR on
corporate performance. The fourth section analyses Domini criteria, focusing in particular on their
potentially cost increasing and productivity enhancing characteristics. The fifth section presents and
comments our descriptive and econometric findings. The sixth section analyses whether the lower
return on equity of SR firms is compensated by reduced conditional volatility.
2. Expected costs and gains from socially responsible behaviour
Before testing directly the impact of SR on corporate performance we briefly survey theoretical
grounds which might support the hypothesis of a non negative relationship between SR and
corporate performance. As a starting point we must consider - as it will be clear from the analysis of
the characteristics of Domini criteria - that SR involves the undertaking of a set of actions which are
potentially cost increasing (such as higher attention to labour conditions within the firm and in
subcontracting companies, adoption of more environmentally, and often more costly, productive
processes, etc.).
These sources of additional costs need to be compensated by some potential benefits to be
economically sustainable. A first one, already mentioned, is represented by the creation of
reputational capital which may help the company to obtain more favorable terms of trade when
negotiating with various stakeholders (Cornell and Shapiro, 1987; Bowen et al., 1995; Jones, 1995).
A second one considers that SR may positively affect workers productivity if we move away from
the standard microeconomic approach which regards labour productivity as mainly related to
individual skills, human capital and expected remunerations. In this perspective, a new strand of the
literature starts modeling workers productivity as being affected not just by the usual set of
conditions, and by the worker identification with the goals of their firm (Agell and Lundberg, 1999;
Bewley, 1999, Campbell and Kamlani, 1999). Social preferences
4(Fehr- Schmidt, 1999; Fehr and
Schmidt, 2001; Sobel 2001) and gift exchange are two leading fields in this literature ((Akerlof,
1982) .
In this perspective, the move to (exit from) CSR may significantly increase (reduce) intrinsic
workers motivation, thereby affecting positively (negatively) their productivity. This hypothesis
will be tested in the empirical analysis which follows.
3. The empirical literature on the impact of CSR
A huge number of empirical papers have tested in the past the relationship between social
responsibility and corporate performance. Strangely enough, almost all of these papers have been
published in the business and not in the economics literature, even though the topic of CSR is
obviously relevant for both.
This “anomaly” gives us the advantage to provide a contribution to this specific field by testing the
relationship between the two variables with methodological approaches which are standard in
economics, but are not always used in the business literature.
With some approximation we can divide the existing empirical papers into three groups. The first
finds a positive relationship between CSR and corporate performance. Soloman and Hansen (1985)
find that the costs of having a high level of CSR are more than compensated by benefits in
employee morale and productivity. Pava and Krausz (1996) and Preston and O’Bannon (1997)
observe that CSR is positively associated with financial performance, while positive synergies
between corporate performance and good stakeholders relationships are found by Stanwick and
4
According to a definition of Fehr and Falk (2002) "a person exhibits social preferences if it does
Stanwick (1998) and by Verschnoor (1998). Ruf et al. (2001) find that change in CSR is positively
associated with growth in sales and that return on sales are positively associated with CSR for three
financial periods. Simpson and Kohers (2002) document a positive link between social and financial
performance on a sample of banking firms.
A second group of papers finds no significant direction in the link between CSR and corporate
performance. Mc Williams and Siegel (2001) find that the financial performance of Domini
constituents is not significantly different from that of a control sample when per capita R&D
expenditure is added among regressors. Other papers finding inconclusive results are those of
Anderson and Frankle (1980), Freedman and Jaggi (1986), Aupperle, Caroll and Hatfield (1985).
A third group of contributions documents a negative relationship and does not reject the managerial
opportunism hypothesis. Preston and O’Bannon (1997) suggest that managers reduce expenditures
on social performance to increase short-term profitability and their personal compensation, but
when financial performance is poor they divert attention by expenditures on social programs. Other
papers documenting a negative relationship are those of Freedman and Jaggi (1982), Ingram and
Frazier (1983), Waddock and Graves (1997).
How to interpret these controversial results ? In the well known story about the blind men and the
elephant each blind man can get only a part of the truth by touching a part of the body of the
elephant. The group acquires reasonable knowledge of the phenomenon under investigation (the
elephant) only when partial and insufficient information collected by each individual is pooled.
The story suggests that the above described differences in findings across the four groups of papers
do not necessarily reflect mistakes or inaccuracies, but, most often, differences in perspective
(observation periods, companies included in the sample, measures of corporate performance and
methodological approaches adopted for the empirical analysis). It also suggests that the
combination of them, or an empirical research broadening the scope of the analysis and integrating
many of these perspectives, may give us a more complete picture of the effects of SR on corporate
Our paper goes in this direction as it aims to implement the existing research in the field from
several points of view. First, it uses panel data and takes into account a significantly long time
period, accounting specifically for business cycle effects with year dummies. Second, it introduces
firm specific intercepts (fixed effects), thereby separating the impact of CSR from time invariant,
firm idiosyncratic, characteristics. Third, it explores the impact of exit from CSR with specific
reference to a range of motivations (labour, sales of weapons, governance, environment) on
corporate performance. Fourth, it proxies the relative risk of holding CSR stocks by testing for the
difference in conditional volatility and in its reaction to shocks between CSR and control sample
stocks.
4. The Social domini criteria
The Domini Social Index 400 (DSI 400) is a portfolio of SR companies developed by Kinder,
Lydenberger and Domini.
The index methodology presents advantages and drawbacks. Its advantages are that it reflects
historical concerns of investors, keeps track of CSR evolution in time and includes all dimensions
identified as important in CSR. Its limit is in the absence of a measure of intensity in corporate
performance. Another important problem with the index is in the adoption of a “best in class
process” in which relative, but not absolute, best SR performers in some industries have been
included with the specific aim of keeping the index sufficiently diversified, thereby allowing ethical
fund investors to adopt well diversified passive investment strategies. Finally, a third limit is that
the index must have a constant number of constituents. Therefore, for any exit a new entry is
needed, with the effect that entry timing is determined not solely by firm progress on CSR, but also
by rebalancing needs.
controversial business issues. For each of them the Domini index identifies strengths and
weaknesses, and lists a series of corporate actions falling under one of the two (see Appendix 1).
4.1 Domini requirements with cost increasing potential
The inspection of these criteria immediately shows that there are no “free lunches” in SR, revealing
how several SR actions are clearly cost-increasing. In the community section we find as strengths
charitable giving, support for education and support for housing. In the diversity section we find
work benefits (the company has outstanding employee benefits or other programs addressing
work/life concerns, e.g. childcare, eldercare or flextime). In the employee relations section we find
as strengths cash profit sharing programs, health and safety strength and strong retirement benefit
programs. In the environment section we find as strengths clean air programs. This item is for
companies which have taken significant measures to reduce its impact on climate change and air
pollution through use of renewable energy and clean fuels or through energy efficiency or for
companies that have demonstrated a commitment to promoting climate-friendly policies and
practices outside its own operations. The impact of these measures on costs is not necessarily
positive, but it is highly suspected to be so. In the human right section we find the item of
Indigenous Peoples Relations Strength (the company has established relations with indigenous
peoples near its proposed or current operations –either in or outside the U.S- that respect the
sovereignty, land, culture, human rights and intellectual property of the indigenous peoples) and
Labor Rights Strength (the company has outstanding transparency on overseas sourcing disclosure
and monitoring or has particularly good union relations outside the U.S.). Here again, good
relationships with local workers and stakeholders are expected to have some costs in terms of
missed opportunities of labour costs reductions.
Against all these potentially cost increasing factors we find only one clearly cost-decreasing SR
initiative in the corporate governance section (the limited compensation of the manager).
On the other hand, our inspection of Domini affiliation also suggests that CSR may increase
workers participation and productivity. First, limits to managerial compensation may increase
workers satisfaction. Second, the presence of a program of Work/Life Benefits (the company has
outstanding employee benefits or other programs addressing work/life concerns, e.g. childcare,
eldercare or flextime) may increase workers involvement with the company.
Last but not least, a positive reaction of workers in terms of productivity may also be generated by
strength factors in the employee relations section. These are: i) Cash Profit Sharing (the company
has a cash profit-sharing program through which it has recently made distributions to a majority of
its workforce); ii) Employee Involvement (the company strongly encourages worker involvement
and/or ownership through stock options available to a majority of its employees, gain sharing,
stock ownership, sharing of financial information, or participation in management
decision-making); iii) Health and Safety Strength (the company is noted by the US Occupational Health and
Safety Administration for its safety programs); iv) Retirement Benefits Strength (the company has a
notably strong retirement benefits program); v) Union Relations (the company has a history of
notably strong union relations); vi) Other Strength (the company has strong employee relations
initiatives not covered by other KLD ratings).
The goal of our paper is to test whether the cost increasing factors related to CSR (and, specifically,
to Domini affiliation) prevail over the factors which should increase workers motivation and lead to
higher productivity. Furthermore, we want to evaluate whether, as it is implicit in its same goals, the
CSR choice may lead to some forms of redistribution of corporate value from shareholders to
stakeholders.
In order to test the impact of Domini affiliation on corporate performance we choose the following
specification:
4
0 1 2 3 4
1 1
log(
)
min
log(
)
Re
m
it i k k t t it
k t
Y
α
u
α
Size
α
Do
i
α
Entry
α
Postexit
β
asexit
δ
Year
ε
= =
= + +
+
+
+
+
∑
+
∑
+
(1)
where Yit is a chosen performance variable (eg. return on equity, return on investment, total sales
per employee), u
iis the time invariant firm idiosyncratic effect, Size is the number of firm
employees, Domini is a dummy for affiliation to the Domini 400 index; Entry is a dummy which
takes the value of one in the year of entry into the Domini 400 index; Postexit is a variable
measuring the number of years following exit from the Domini 400 index; Reasexit
kare k dummies
taking the value of one in the year of exit when the exit rationale (Military, Environment,
Productquality, Badgovnce and Badlabour) applies, Year
tare dummies picking up year effects.
In our estimate we therefore try to disentangle the effects of corporate social responsibility (proxied
by Domini affiliation) from business cycle effects (year dummies) and idiosyncratic characteristics
(e.g. management quality) of each firm (proxied by the fixed effect measured through the firm
specific intercept component u
i). To give an example, it may be that the association of Domini
affiliation with a positive performance in a given dependent variable depends from the fact that high
performers are more likely to search for Domini affiliation than low performers. In this case the
causation would be reversed with good performance causing Domini affiliation and not vice versa.
In our estimate fixed effects should capture differences in ex ante characteristics and the Domini
variable should measure just the net effect of CSR.
The use of fixed effect controls for measurement errors arising from the use of industry dummies as
well. The identification of firm specific characteristics goes in fact deeper than the identification of
industry characteristics, since industry classifications are becoming always more imperfect
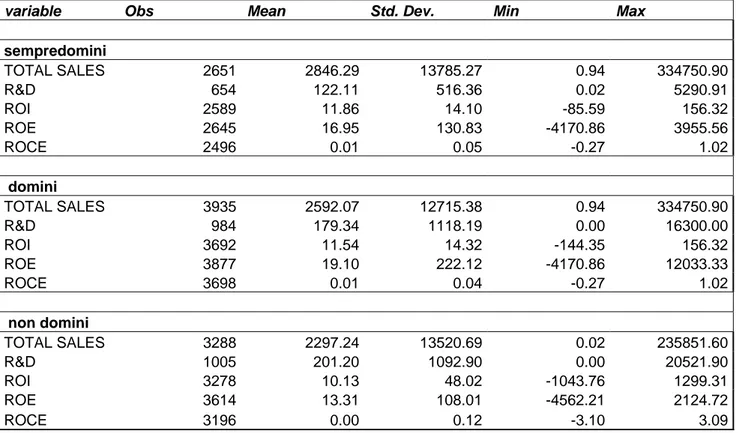
Descriptive findings on the variable used for the econometric analysis show that the median value
for ROI (ROE) is around 10 (15) percent and that more than 5 (10) percent of ROI (ROE)
observations are negative [CHECK R&D ZERO]. When we look at descriptive findings on the
difference between Domini and non Domini constituents we find that the former have higher mean
values for total sales, return on equity and return on investment (??).
A first important result of the estimates presented in table 3.1 shows that the joint insignificance of
the fixed effects is rejected, confirming that idiosyncratic factors matter and their omission is likely
to bias empirical findings.
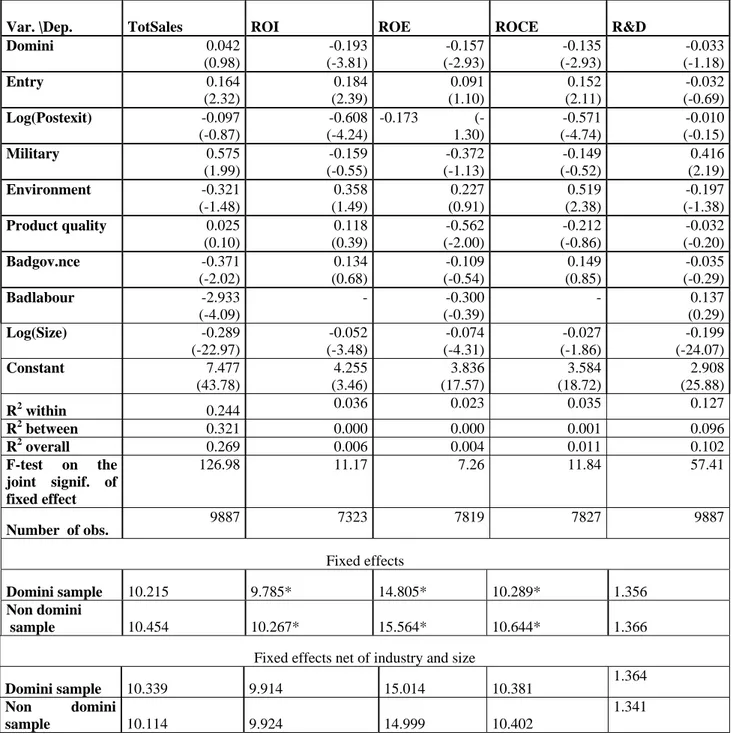
Our empirical findings document that entry into Domini index is associated with 13 percent higher
total sales per employee (16 percent if large capitalisation firms are excluded from the sample, see
table 3.2) after controlling for size, business cycle effects and idiosyncratic firm characteristics. The
positive total sales performance is consistent (even though not coincident) with findings from
Stanwick and Stanwick (1998), Verschnoor (1998) and Ruf et al. (2001) mentioned in section 3. In
the same estimate we find that doubling the years after Domini exit reduces total sales per employee
by 22 percent in the overall sample (but not when large capitalisation firms are excluded) and is
associated with a significantly reduced performance (around 26 percent for each of the three
profitability indicators, ROI, ROE and ROCE).
Moreover, exit for non compliance with the criteria on governance reduces total sales per employee
by 31 percent in general (table 3.1) and by 37 percent if large capitalisation firms are excluded from
sample (table 3.2), while the opportunity of obtainin higher (lower) total sales per employee when
abandoning military (labour) social responsibility criteria seems to be available only when large
capitalisation firms are excluded.
Columns 2 to 4 show that Domini affiliation is associated with a reduction of return on investment,
return on equity and return on capital employed of around 10 percent (the effect is stronger if large
compensated by the positive impact of entry into Domini index on ROI and ROCE in the estimate
in which large caps are excluded from the sample (table 3.2)
General negative post exit effects on profitability indicators seem to exist (and to be stronger) for
non large capitalisation firms (around 57 percent lower return on capital invested and 61 percent
lower return on investment).
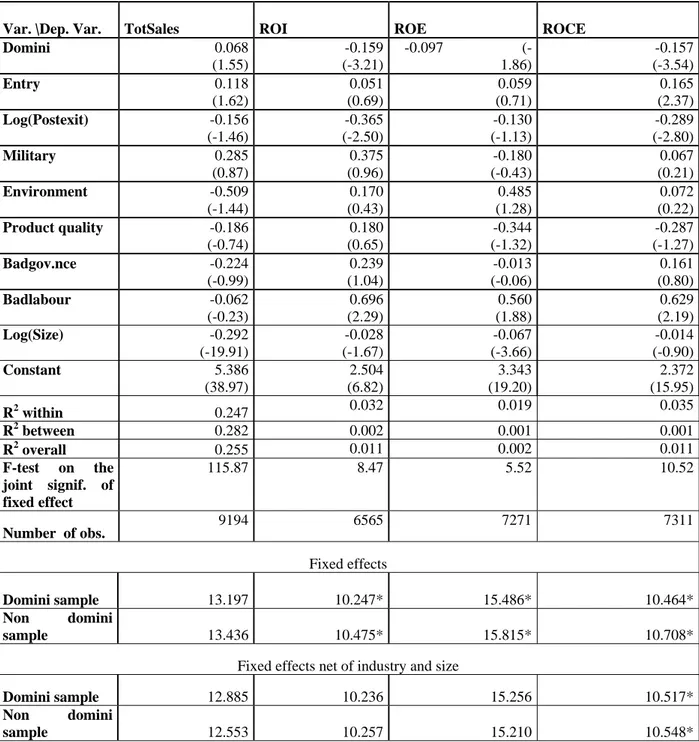
When we reestimate the model for non R&D investing firms only the results of the overall sample
are confirmed with some slight differences: i) the positive effects of entry into the Domini index on
total sales per worker are significant at 10 percent and only for large capitalisation firms in this
subsample (tables 3.3 and 3.4); ii) there is evidence of weak positive significance of Domini
affiliation on total sales per worker (tables 3.3 and 3.4); iii) the negative effects of Domini
affiliation and post-exit on profitability indicators are stronger in this subsample (tables 3.3 and
3.4).
We finally report estimates of the model for the subsample of R&D investing firms (about ¼ of the
total sample, tables 3.5 and 3.6). We find again a significant and positive effect of entry into the
Domini index on total sales per worker and a negative effect of Domini affiliation on ROI, ROE and
ROCE which is compensated by a positive entry effect on ROI and ROCE. Hence, once again, the
indicator which is more negatively affected by social responsibility is the one measuring
shareholders returns.
On the overall, findings reported in tables 3.1-3.6 outline a picture in which SR is associated to a
transfer of wealth from shareholders to stakeholders. SR firms productivity is equal or, in some
cases, significantly higher than in the control sample while, at the same time, return on equity is
significantly lower. These findings clearly match with our interpretation of SR criteria described in
section 4. Such criteria are shown to increase transfers to stakeholders and workers, but are also
interpreted as having the potential effect of increasing workers motivation and productivity.
To control further for endogeneity and reverse causation we wonder whether some permanent
firms which will be included in the Domini index are idiosyncratically different in quality with
respect to the control sample.
We therefore test whether average fixed effects for the control sample and for firms which are in the
Domini index at some time of our sample interval are significantly different. On the overall, our
findings (tables 3.1-3.6) show that SR firms have lower returns on equity and on investment before
controlling for size and industry effects (in all of the six estimated samples), while they tend to
have significantly higher total sales per worker after controlling for size and industry effects (non
R&D investing firms with and without large caps, and R&D investing without large caps). Our
interpretation is that Domini affiliation significantly reinforces traits of corporate identity which
were already in place before entry. Therefore, i) SR firms have ex ante higher total sales per worker
and belong to industries with relatively lower return on investment and equity, ii) their entry into
the Domini index generates a new significant independent effect in the two directions (higher total
sales per worker and lower return on equity).
6. Domini affiliation and conditional stock return volatility
The relatively lower ROE of SR firms does not necessarily mean that SR stocks are a good
business. The comparative performance of equities must be obviously evaluated on the risk-return
perspective. In this perspective, relatively lower returns on equity of SR firms may be compensated
by relatively lower risk. Following Boccardelli and De Santo (2005) we test the relative risk of
holding CSR stocks vis a vis those of our control sample by building an index of stock returns for
the two subsamples and estimate their conditional volatility with a simple GARCH (1,1) (Nelson,
1989; Engle, 1990; Engle and Ng, 1993).
The chosen specification for stock return behaviour (mean equation) is:
t j j j i i t i t
R
DW
DJ
R
=
∂
0+
∑
γ
−∑
β
+
δ
+
ε
(2)
where
R
tis the average subgroup (SR or control sample) one-day compounded return,
DW are
jthe dummies for “day of the week” effects,
DJ is the dummy for “January” effect and
ε
tis the error
term.
The standard specification adopted for testing the asset market volatility in the second equation of a
GARCH (1,1) model is given by:
1 2 2 1 1 0
+
−+
−=
t t tb
b
b
h
h
ε
(3)
where
h is the conditional variance,
t2 1 − t
ε
are the news about volatility from the previous period,
measured as the lag of the squared residual from the mean equation while
h
t−1is the last period’s
forecast variance.
The base equations for the two (Domini and control sample) indexes (table 4) have some common
elements. One lag daily log returns of the own market have small but significant effects on the
dependent variable. Moreover, the control sample (non SR firms) exhibits also a negative and
significant Monday effect, consistently with several previous results in literature (Taylor, 1986).
Kurtosis and skewness tests, performed on the residuals obtained from the best estimation of the
base equations, show that the distribution is not normal variate. The existence of excess kurtosis
confirms the “stylized fact” of thick tails for financial time series, which was firstly observed by
Mandelbrot (1963 a, b). The sum of the ARCH and GARCH coefficients is very close to one,
indicating that volatility shocks are quite persistent.
The main differences between the two indexes are that the Monday effect is significant and negative
only in the control sample index and that the intercept in the second equation is significantly lower
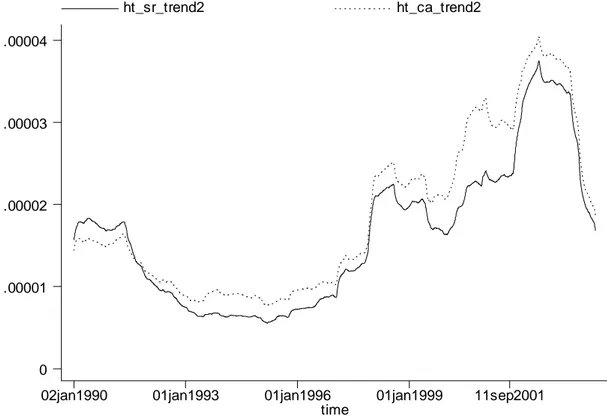
(at 90 percent) for the Domini index. Figure 1 plots conditional volatility for the two indexes and
confirms that the conditional volatility of the Domini index is almost always lower than that of the
control sample index.
The quality of the SR index is not just that of having relatively lower conditional volatility but also
reestimated by adding a dummy which tests the change in conditional volatility after the burst of the
Nasdaq stock market bubble in March 2000. The findings show that the impact is significantly
lower in the social responsibility index.
6. Conclusions
Corporate social responsibility is a multifaceted complex phenomenon involving a set of actions
which are expected to affect significantly cost structures and workers participation to productive
activity. As a consequence, the scope of empirical investigations on the effects of CSR on corporate
performance must be such that the highest number of hidden dimensions of the problem can be
discovered and analysed.
This paper tries to do so by enlarging the observed estimation period, by discriminating among
different reasons for entry or exit from a selected measure of CSR and by controlling for business
cycle effects and for time invariant idiosyncratic characteristics of the observed firms.
Our empirical approach allows us to disclose many unexplored dimensions of the CSR/corporate
performance relationship and provides rationales for some of the empirical puzzles of the previous
empirical literature.
Our findings identify the existence of a “transfer of wealth” effect which appears to be consistent
with the hypothesis that CSR is expected, in principle, to redirect the focus of corporate activity
from the maximization of shareholders to that of stakeholders interests. We observe in fact that CSR
workers produce “larger cakes” (total sales per employee are significantly higher), but a smaller
portion of these cakes goes to shareholders (returns on equity are significantly lower). The
“penalty” that SR responsibility imposes on shareholders (relatively lower return one equity) is
The unobserved, complementary effect, is likely to be that higher slices of the cake must be earned
by other stakeholders (subcontractors, employees, local communities) given that Domini affiliation
is associated with a series of actions going in such direction.
The “transfer of wealth” effect well matches some of the time invariant idiosyncratic characteristics
of CSR and non CSR firms, where the former are relatively more productive firm types (whose
productivity if further enhanced by the CSR choice) and belong to industries and size classes in
which the return on equity is relatively lower.
A second robust finding is the significantly negative impact (both in terms of productivity and
return on equity) of exit from the Domini index. This result documents negative consequences
arising when a CSR stance is abandoned. Given limitations of our information, it is not possible to
verify whether the event reveals an exogenous negative shock on firm competitiveness which also
leads to exclusion from the Domini or whether the shock depends on reduced productivity of
References
Adriani F. Becchetti L., 2002, Fair trade: a “third generation welfare” mechanism to make globalisation sustainable, in J.Whalley (ed.) Globalisation, MIT Press (forthcoming) and CEIS Working Paper, n. 171.
Anderson J., Frankle A. (1980), “Voluntary Social Report: An Iso-Beta Portfolio Analysis”, Accounting Review 55: 468-479
Aupperle K. E., Caroll A.B., Hatfield J.B. (1985), “An empirical examination of the relationship between corporate social responsibility and profitability”, Academy of Management Journal 28: 446-463
Boccardelli L. De Santo S., 2004, Social responsibility and reaction to stock market shocks, mimeo
Bowen, R. M., L. DuCharme and D. Shores: 1995, ‘Stakeholders’ Implicit Claims and Accounting Method hoice’, Journal of Accounting and Economics 20, 255–295.
Cornell B., Shapiro A. (1987), “Corporate Stakeholder Theory and Corporate Finance”, Financial Management 16:5-14 Deci E. (1975), “Intrinsic Motivation”, Plenum Press, New York
Engle, R. F. (1990) Stock volatility and the crash of ’87: discussion, Review of Financial Studies, 3(1), 103-6.
Engle, R. F. and Ng, V. (1993) Measuring and testing the impact of news on volatility, Journal of Finance, 48(5) 1749-78. Fehr E., Falk.. (2002), …
Freedman M. and Jaggi B. (1986), “An analysis of the impact of corporate pollution disclosures included in Annual Financials Statements on investors’ decisions”, in Advances in public interest accounting
Freeman R.E. (1984), “Strategic Management”: a Stakeholder approach”, Pitman,Boston Friedman M. (1962),“Capitalism and Freedom”, Chicago University Press
Galor O. and Moav O. (2004), “From Physical to Human capital accumulation: Inequality and the process of Development”, Review of Economic Studies, Blackwell Publishing, vol. 71(4), pages 1001-1026, 10
Ingram, R. and K. Frazier: 1980, ‘Environmental Performance and Corporate Disclosure’, Journal of Accounting Research 18, 614– 622.
Jones, T. M.: 1995, ‘Instrumental Stakeholder Theory: A Synthesis of Ethics and Economics’, Academy of Management Review (April), 404–437.
Mandelbrot B. (1963 a) The variation of certain speculative prices, Journal of Business, 36, 394-419. Mandelbrot B. (1963 b) New methods in statistical economics, Journal of Political Economy, 71, 421-440.
McWilliams A., Siegel D. (2001), “Corporate social responsibility and financial performance: correlation or misspecification?”, Strategic Management Journal 21(5): 603-609
Nelson, D. B. (1989) Price volatility, international market links, and their implications for regulatory policies: commentary, Journal of Financial Services Research, 3(2- 3), 247- 54.
Pava L., Krausz J. (1996), “The association between corporate social responsibility and financial performance, Journal of Business Ethics 15: 321-357
Preston L., O’Bannon D. (1997), “The corporate social-financial performance relationship”, Business and Society 36(1): 5-31
Ruf, B. M., Muralidhar K., Brown R. M., Janney J.J. and Paul K. (2001), An Empirical Investigation of the Relationship Between Change in Corporate Social Performance and Financial Performance: A Stakeholder Theory Perspective, Journal of Business Ethics 32, 143–156.
Simpson W.G. and Kohers T., (2002), The Link Between Corporate Social and Financial Performance: Evidence from the Banking Industry, Journal of Business Ethics, 35, 97-109.
Stanwick P.A. and Stanwick S.D. (1998), The Relationship Between Corporate Social Performance, and Organizational Size, Financial Performance, and Environmental Performance: An Empirical Examination, Journal of Business Ethics, 17, 195-204. Taylor D. (1986), Modelling Financial Time Series, Wiley and Sons, London
Tirole J. (2001), “Corporate Governance”, Econometrica, 69 (1) Verschnoor (1998)
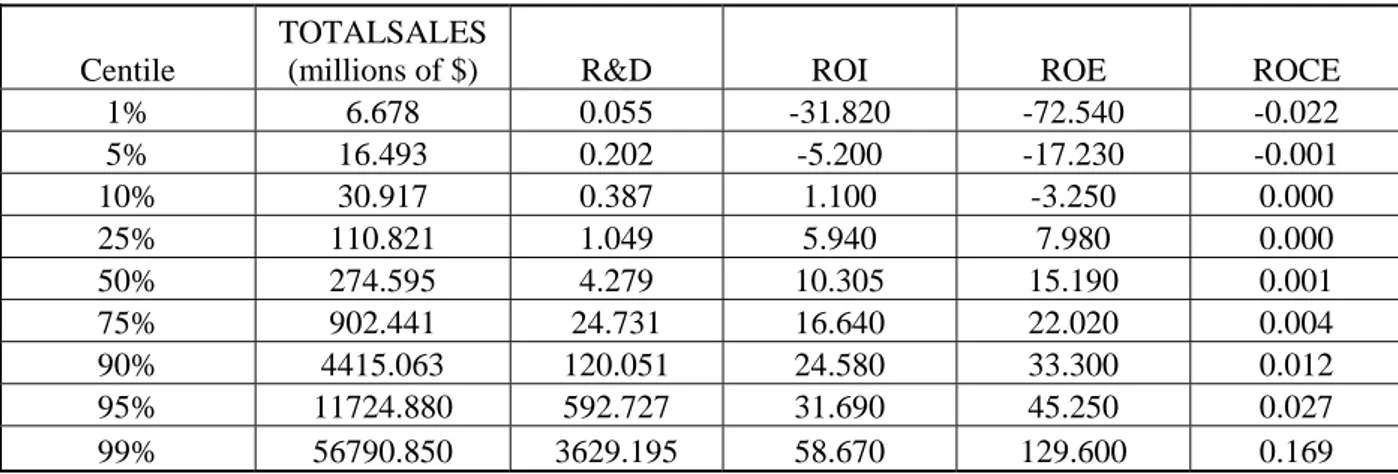
Table 1 Distribution of variables selected for the empirical analysis
Centile
TOTALSALES
(millions of $) R&D ROI ROE ROCE
1% 6.678 0.055 -31.820 -72.540 -0.022 5% 16.493 0.202 -5.200 -17.230 -0.001 10% 30.917 0.387 1.100 -3.250 0.000 25% 110.821 1.049 5.940 7.980 0.000 50% 274.595 4.279 10.305 15.190 0.001 75% 902.441 24.731 16.640 22.020 0.004 90% 4415.063 120.051 24.580 33.300 0.012 95% 11724.880 592.727 31.690 45.250 0.027 99% 56790.850 3629.195 58.670 129.600 0.169
Legend of variables: TOTALSALES: total sales per employee; R&D: Research and Development per employee; ROI: Return on Investment; ROE: Return on Equity; ROCE: Return on Capital Employed.
Table 2 Descriptive statistics of variables used in the empirical analysis
variable Obs Mean Std. Dev. Min Max
sempredomini TOTAL SALES 2651 2846.29 13785.27 0.94 334750.90 R&D 654 122.11 516.36 0.02 5290.91 ROI 2589 11.86 14.10 -85.59 156.32 ROE 2645 16.95 130.83 -4170.86 3955.56 ROCE 2496 0.01 0.05 -0.27 1.02 domini TOTAL SALES 3935 2592.07 12715.38 0.94 334750.90 R&D 984 179.34 1118.19 0.00 16300.00 ROI 3692 11.54 14.32 -144.35 156.32 ROE 3877 19.10 222.12 -4170.86 12033.33 ROCE 3698 0.01 0.04 -0.27 1.02 non domini TOTAL SALES 3288 2297.24 13520.69 0.02 235851.60 R&D 1005 201.20 1092.90 0.00 20521.90 ROI 3278 10.13 48.02 -1043.76 1299.31 ROE 3614 13.31 108.01 -4562.21 2124.72 ROCE 3196 0.00 0.12 -3.10 3.09
Legend of the dependent variables: TOTALSALES: total sales per employee; R&D: Research and Development
Table 3.1 The impact of Domini affiliation on performance indicators
Var. \Dep. TotSales ROI ROE ROCE R&D
Domini 0.033 (0.97) -0.106 (-2.70) -0.075 (-1.73) -0.106 (-2.90) 0.021 (0.93) Entry 0.131 (2.29) 0.043 (0.72) 0.051 (0.76) 0.077 (1.33) -0.053 (-1.42) Log(Postexit) -0.219 (-3.34) -0.251 (-3.30) -0.270 (-3.44) -0.269 (-4.00) -0.026 (-0.61) Military 0.331 (1.42) 0.005 (0.02) -0.025 (-0.09) 0.155 (0.67) 0.276 (1.81) Environment -0.237 (-1.22) 0.222 (1.08) 0.315 (1.41) 0.317 (1.63) -0.040 (-0.32) Product quality 0.128 (0.70) 0.030 (0.15) -0.242 (-1.15) -0.181 (-1.02) -0.130 (-1.08) Badgov.nce -0.311 (-1.67) 0.163 (0.84) -0.036 (-0.18) 0.138 (0.80) 0.020 (0.17) Badlabour -0.238 (-1.41) 0.385 (2.14) 0.462 (2.17) 0.461 (2.59) 0.037 (0.34) Log(Size) -0.305 (-27.06) -0.048 (-3.72) -0.075 (-4.99) -0.028 (-2.30) -0.199 -(26.94) Constant 8.943 (59.75) 3.468 (3.25) 3.664 (19.64) 3.438 (21.21) 3.119 (31.79) R2 within 0.263 0.032 0.020 0.033 0.119 R2 between 0.267 0.001 0.001 0.000 0.083 R2 overall 0.243 0.006 0.002 0.010 0.091 F-test on the joint signif. of fixed effect 187.87 12.85 8.55 14.25 70.99 Number of obs. 13179 9817 10385 10499 13179 Fixed effects Domini sample 13.197 10.247* 15.496* 10.464 1.398 Non domini sample 13.435 10.475* 15.815* 10.709 1.378
Fixed effects net of industry and size
Domini sample 13.355 10.309 15.595 10.534 1.399*
Non domini
sample 13.025 10.299 15.533 10.537
1.374*
Legend of the dependent variables: Totsales: total sales per worker; R&D: Research and Development per worker; ROI: return on investment; Roe Return on Equity, Roce: Return on Capital Employed.
Legend of the regressors: Domini: dummy for affiliation in the Domini 400 index; Entry: dummy for entri into the Domini 400 index; lAfter- number of years after exit from the Domini 400 index; Military, Environment, Productquality, Badgov.nce and Badlabour: dummies taking value of one the year of exit when the exit rationale applies, Size: number of firm employees.
Table 3.2 The impact of Domini affiliation on performance indicators (large capitalisation
firms excluded from the sample)
Var. \Dep. TotSales ROI ROE ROCE R&D
Domini 0.042 (0.98) -0.193 (-3.81) -0.157 (-2.93) -0.135 (-2.93) -0.033 (-1.18) Entry 0.164 (2.32) 0.184 (2.39) 0.091 (1.10) 0.152 (2.11) -0.032 (-0.69) Log(Postexit) -0.097 (-0.87) -0.608 (-4.24) -0.173 (-1.30) -0.571 (-4.74) -0.010 (-0.15) Military 0.575 (1.99) -0.159 (-0.55) -0.372 (-1.13) -0.149 (-0.52) 0.416 (2.19) Environment -0.321 (-1.48) 0.358 (1.49) 0.227 (0.91) 0.519 (2.38) -0.197 (-1.38) Product quality 0.025 (0.10) 0.118 (0.39) -0.562 (-2.00) -0.212 (-0.86) -0.032 (-0.20) Badgov.nce -0.371 (-2.02) 0.134 (0.68) -0.109 (-0.54) 0.149 (0.85) -0.035 (-0.29) Badlabour -2.933 (-4.09) - -0.300 (-0.39) - 0.137 (0.29) Log(Size) -0.289 (-22.97) -0.052 (-3.48) -0.074 (-4.31) -0.027 (-1.86) -0.199 (-24.07) Constant 7.477 (43.78) 4.255 (3.46) 3.836 (17.57) 3.584 (18.72) 2.908 (25.88) R2 within 0.244 0.036 0.023 0.035 0.127 R2 between 0.321 0.000 0.000 0.001 0.096 R2 overall 0.269 0.006 0.004 0.011 0.102 F-test on the joint signif. of fixed effect 126.98 11.17 7.26 11.84 57.41 Number of obs. 9887 7323 7819 7827 9887 Fixed effects Domini sample 10.215 9.785* 14.805* 10.289* 1.356 Non domini sample 10.454 10.267* 15.564* 10.644* 1.366
Fixed effects net of industry and size
Domini sample 10.339 9.914 15.014 10.381 1.364
Non domini
sample 10.114 9.924 14.999 10.402
1.341
Legend of the dependent variables: Totsales: total sales per worker; R&D: Research and Development per worker; Roi return on investment; Roe Return on Equity, Roce: Return on Capital Employed.
Legend of the regressors: Domini: dummy for affiliation in the Domini 400 index; Entry: dummy for entri into the Domini 400 index; lAfter- number of years after exit from the Domini 400 index; Military, Environment, Productquality, Badgov.nce and Badlabour: dummies taking value of one the year of exit when the exit rationale (Military, Environment, Productquality, Badgov.nce and Badlabour) applies, Size. Number of firm employees.
Table 3.3 The impact of Domini affiliation on performance indicators (non R&D investing
firms)
Var. \Dep. Var. TotSales ROI ROE ROCE
Domini 0.068 (1.55) -0.159 (-3.21) -0.097 (-1.86) -0.157 (-3.54) Entry 0.118 (1.62) 0.051 (0.69) 0.059 (0.71) 0.165 (2.37) Log(Postexit) -0.156 (-1.46) -0.365 (-2.50) -0.130 (-1.13) -0.289 (-2.80) Military 0.285 (0.87) 0.375 (0.96) -0.180 (-0.43) 0.067 (0.21) Environment -0.509 (-1.44) 0.170 (0.43) 0.485 (1.28) 0.072 (0.22) Product quality -0.186 (-0.74) 0.180 (0.65) -0.344 (-1.32) -0.287 (-1.27) Badgov.nce -0.224 (-0.99) 0.239 (1.04) -0.013 (-0.06) 0.161 (0.80) Badlabour -0.062 (-0.23) 0.696 (2.29) 0.560 (1.88) 0.629 (2.19) Log(Size) -0.292 (-19.91) -0.028 (-1.67) -0.067 (-3.66) -0.014 (-0.90) Constant 5.386 (38.97) 2.504 (6.82) 3.343 (19.20) 2.372 (15.95) R2 within 0.247 0.032 0.019 0.035 R2 between 0.282 0.002 0.001 0.001 R2 overall 0.255 0.011 0.002 0.011 F-test on the joint signif. of fixed effect 115.87 8.47 5.52 10.52 Number of obs. 9194 6565 7271 7311 Fixed effects Domini sample 13.197 10.247* 15.486* 10.464* Non domini sample 13.436 10.475* 15.815* 10.708*
Fixed effects net of industry and size
Domini sample 12.885 10.236 15.256 10.517*
Non domini
sample 12.553 10.257 15.210 10.548*
Legend of the dependent variables: Totsales: total sales per worker; R&D: Research and Development per worker; Roi return on investment; Roe Return on Equity, Roce: Return on Capital Employed.
Legend of the regressors: Domini: dummy for affiliation in the Domini 400 index; Deletion, dummy for exit from the Domini 400 index; Entry: dummy for entri into the Domini 400 index; lAfter- number of years after exit from the Domini 400 index; Military, Environment, Productquality, Badgov.nce and Badlabour: dummies taking value of one the year of exit when the exit rationale (Military, Environment, Productquality, Badgov.nce and Badlabour) applies, Size. Number of firm employees.
[spiegaz estesa]
Table 3.4 The impact of Domini affiliation on performance indicators (non R&D investing
firms -large capitalisation firms are excluded from the sample)
Var. \Dep. TotSales ROI ROE ROCE
Domini 0.089 (1.71) -0.230 (-3.90) -0.194 (-3.11) -0.167 (-3.17) Entry 0.121 (1.43) 0.211 (2.36) 0.090 (0.95) 0.197 (2.42) Log(Postexit) 0.058 (0.39) -0.429 (-2.33) 0.039 (0.22) -0.489 (-3.56) Military 0.495 (1.25) 0.381 (0.99) -0.267 (-0.64) -0.070 (-0.19) Environment -0.725 (-1.74) 3 0.251 (0.57) 0.162 (0.43) Product quality -0.337 (-1.07) 0.052 (0.15) -0.568 (-1.75) -0.383 (-1.37) Badgov.nce -0.286 (-1.28) 0.179 (0.77) -0.124 (-0.53) 0.201 (1.00) Badlabour - - - -Log(Size) -0.260 (-15.89) -0.052 (-2.64) -0.062 (-2.91) -0.024 (-1.31) Constant 4.879 (31.90) 2.510 (6.01) 3.283 (16.37) 2.450 (14.25) R2 within 0.228 0.038 0.021 0.040 R2 between 0.363 0.002 0.000 0.002 R2 overall 0.285 0.009 0.005 0.014 F-test on the joint signif. of fixed effect 84.13 8.06 4.88 9.89 Number of obs. 7101 5094 5625 5654 Fixed effects Domini sample 10.381 10.084* 14.894* 10.559* Non domini sample 10.464 10.538* 15.736* 10.913*
Fixed effects net of industry and size
Domini sample 10.496* 10.206 15.119 10.644*
Non domini
sample 10.175* 10.247 15.165 10.708*
Legend of the dependent variables: Totsales: total sales per worker; R&D: Research and Development per worker; Roi return on investment; Roe Return on Equity, Roce: Return on Capital Employed.
Legend of the regressors: Domini: dummy for affiliation in the Domini 400 index; Entry: dummy for entri into the Domini 400 index; lAfter- number of years after exit from the Domini 400 index; Military, Environment, Productquality, Badgov.nce and Badlabour: dummies taking value of one the year of exit when the exit rationale (Military, Environment, Productquality, Badgov.nce and Badlabour) applies, Size. Number of firm employees.
Coefficients and t-stats of year dummies are omitted for reasons of space and available upon request.
Table 3.5 The impact of Domini affiliation on performance indicators (R&D investing firms
only)
Var. \Dep. TotSales ROI ROE ROCE
Domini 0.042 (0.97) -0.193 (-3.81) -0.157 (-2.93) -0.135 (-2.92) R&D 0.000 (5.68) -0.000 (-1.54) -0.000 (-0.10) -0.000 (-1.19) Entry 0.164 (2.32) 0.184 (2.39) 0.091 (1.10) 0.151 (2.09) Log(Postexit) -0.096 (-0.86) -0.609 (-4.25) -0.173 (-1.30) -0.572 (-4.76) Military 0.571 (1.98) -0.157 (-0.54) -0.372 (-1.13) -0.148 (-0.51) Environment -0.324 (-1.49) 0.359 (1.49) 0.227 (0.91) 0.521 (2.39) Product quality 0.023 (0.09) 0.119 (0.39) -0.562 (-2.00) -0.211 (-0.86) Badgov.nce -0.372 (-2.02) 0.135 (0.68) -0.109 (-0.54) 0.148 (0.85) Badlabour -2.956 (-4.13) - -0.299 (-0.39) -Log(Size) -0.283 (-22.47) -0.055 (-3.61) -0.074 (-4.31) -0.028 (-1.96) Constant 5.156 (43.71) 2.510 (6.33) 3.378 (20.90) 2.482 (18.28) R2 within 0.246 0.036 0.023 0.036 R2 between 0.320 0.000 0.000 0.001 R2 overall 0.269 0.006 0.004 0.011 F-test on the joint signif. of fixed effect 123.45 10.79 6.96 11.89 Number of obs. 9887 7323 7819 7827 Fixed effects Domini sample 10.665 9.984* 15.104* 10.433* Non domini sample 10.891 10.339* 15.721* 10.697*
Fixed effects net of industry and size
Domini sample 10.826* 10.084 15.302 10.506
Non domini
sample 10.506* 10.104 15.286 10.538
Legend of the dependent variables: Totsales: total sales per worker;R&D: Research and Development per worker; Roi return on investment; Roe Return on Equity, Roce: Return on Capital Employed.
Legend of the regressors: Domini: dummy for affiliation in the Domini 400 index; Entry: dummy for entri into the Domini 400 index; lAfter- number of years after exit from the Domini 400 index; Military, Environment, Productquality, Badgov.nce and Badlabour: dummies taking value of one the year of exit when the exit rationale (Military, Environment, Productquality, Badgov.nce and Badlabour) applies, Size. Number of firm employees.
Coefficients and t-stats of year dummies are omitted for reasons of space and available upon request.
Table 3.6 The impact of Domini affiliation on performance indicators (R&D investing firms
only –large capitalisation firms excluded from the sample)
ROI ROE ROCE Domini 0.042 (0.97) -0.193 (-3.81) -0.157 (-2.93) -0.135 (-2.92) R&D 0.000 (5.68) -0.001 (-1.54) -0.001 (-0.10) -0.001 (-1.19) Entry 0.164 (2.32) 0.184 (2.39) 0.091 (1.10) 0.151 (2.09) Log(Postexit) -0.096 (-0.86) -0.609 (-4.25) -0.173 (-1.30) -0.572 (-4.76) Military 0.571 (1.98) -0.157 (-0.54) -0.372 (-1.13) -0.148 (-0.51) Environment -0.324 (-1.49) 0.359 (1.49) 0.227 (0.91) 0.521 (2.39) Product quality 0.023 (0.09) 0.119 (0.39) -0.562 (-2.00) -0.211 (-0.86) Badgov.nce -0.372 (-2.02) 0.135 (0.68) -0.109 (-0.54) 0.148 (0.85) Badlabour -2.956 (-4.13) - -0.299 (-0.39) -Log(Size) -0.283 (-22.47) -0.055 (-3.61) -0.074 (-4.31) -0.028 (-1.96) Constant 5.156 (43.71) 2.510 (6.33) 3.378 (20.90) 2.482 (18.28) R2 within 0.246 0.036 0.023 0.036 R2 between 0.320 0.000 0.000 0.001 R2 overall 0.269 0.006 0.004 0.011 F-test on the joint signif. of fixed effect 123.45 10.73 6.96 11.89 Number of obs. 9887 7323 7819 7827 Fixed effects Domini sample 10.655* 9.984* 15.140* 10.433* Non domini sample 10.891* 10.339* 15.731* 10.697*
Fixed effects net of industry and size
Domini sample 10.825* 10.084 15.285 10.505
Non domini
sample 10.505* 10.104 15.225 10.539
Legend of the dependent variables: Totsales: total sales per worker; R&D: Research and Development per worker; Roi return on investment; Roe Return on Equity, Roce: Return on Capital Employed.
Legend of the regressors: Domini: dummy for affiliation in the Domini 400 index; Entry: dummy for entri into the Domini 400 index; lAfter- number of years after exit from the Domini 400 index; Military, Environment, Productquality, Badgov.nce and Badlabour: dummies taking value of one the year of exit when the exit rationale (Military, Environment, Productquality, Badgov.nce and Badlabour) applies, Size. Number of firm employees.
Table 4. GARCH (1,1) estimated conditional volatility for SR firms and the
control sample
MEAN RETURN EQUATION DEPENDENT: RT
VARIABLES DOMINI INDEX
CONSTITUENTS VARIABLES CONTROL GROUP
Rt-1 0.1283** Rt-1 0.1250**
[7.4931] [7.0795]
DJUN -7.75E-05 DJUN -0.0002
[-0.4258] [-0.8587]
DMONDAY -0.0002 DMONDAY -0.0004**
[-1.2607] [-2.3157]
DTHURSDAY -0.0002 DTHURSDAY -0.0003*
[-1.3785] [-1.6532]
DWEDNESDAY 7.80E-05 DWEDNESDAY 0.0002
[0.4824] [1.0250]
DFRIDAY -4.60E-05 DFRIDAY -4.35E-05
[0.3026] [-0.2566] constant 0.0003** constant 0.0004** [2.9580] [3.4081] VARIANCE EQUATION DEPENDENT:
h
t VARIABLES DOMINI INDEXCONSTITUENTS VARIABLES CONTROL GROUP
2 1 − t
ε
-SR 0.0883** [5.9167] 2 1 − tε
-CA 0.0864** [13.699] 1 − th
-SR 0.9026** [147.909]h
t−1 -CA 0.8979** [126.947]Constant-SR 1.84E-07** Constant-CA 2.97E-07**
[5.9168] [7.2819]
R2 adjusted 0.0028 R2 adjusted 0.0048
Skewness -0.5080 Skewness -0.5241
Kurtosis 5.4774 Kurtosis 5.3890
Obs 3651 Obs 3651
Legend of the variables: ht: conditional variance estimated in the GARCH (1,1) model;
ε
t2−1: arch term;h
t−1 : garch term.T-stats are in square brackets. ** 95 percent significance, * 90 percent significance. Source: Boccardelli-De Santo (2005)Figure 1 Conditional variance (SR firms vs control sample)
Legend: ht_sr_trend2: conditional variance of Domini constituents index stock returns ; ht_ca_trend2: conditional variance of control group index stock returns. Source: Boccardelli-De Santo (2005)
time
ht_sr_trend2 ht_ca_trend2
02jan1990 01jan1993 01jan1996 01jan1999 11sep2001
0 .00001 .00002 .00003 .00004
Table 5 The impact of the speculative bubble burst on stock volatility in a GARCH model (the event date is March 10, 2000)
DEPENDENT:
R
tVARIABLES SR-MR SR-PI CA-MR CA-PI
1 − t
R
0.1315** 0.1349** 0.1281** 0.1510**[7.3757] [7.5870] [7.0439] [8.3195]
DJanuary -5.89E-05 8.93E-06 -0.0001 6.26E-05
[-0.3212] [0.0491] [-0.7688] [0.3160] DMonday -0.0001 -0.0001 -0.0003** -0.0003* [-1.1273] [-1.0777] [-2.1652] [-1.8530] DThuesday -0.0001 -0.0001 -0.0002* -0.0002 [-1.3059] [-1.2504] [-1.6288] [-1.4463] DWednesday 9.50E-05 0.0001 0.0002 0.0001 [0.5886] [0.7490] [1.1074] [0.8124]
DFriday -3.67E-05 -5.71E-05 -3.41E-05 -3.56E-05
[-0.2425] [-0.3714] [-0.2019] [-0.2008]
Constant 0.0003** 0.0002** 0.0004** 0.0003**
[2.7696] [2.6070] [3.2301] [2.9178]
DEPENDENT:
h
tVARIABLES SR-MR SR-PI CA-MR CA-PI
2 1 − t
ε
0.0914** 0.0934** 0.0926** 0.1073** [14.0605] [14.0964] [12.7800] [12.6796] 1 − th
0.8870** 0.8822** 0.8678** 0.8422** [106.9555] [100.4197] [75.5598] [61.2127]DBUBBLE 4.16E-07** 4.47E-07** 8.31E-07** 1.29E-06
[4.9226] [4.8992] [5.0562] [5.2481]
Constant 2.55E-07** 2.88E-07** 4.90E-07** 6.51E-07
[6.0761] [6.2784] [6.9037] [7.1147]
R2 adjusted 0.0023 0.0027 0.0043 0.0034
F-test on the significance in the difference of DBUBBLE coefficient in the SR and non SR sample (p-value)
(.01) (.01)
Skewness -0.4797 -0.4587 -0.5064 -0.4176
Kurtosis 5.2076 5.2618 5.1698 6.0061
Obs 3651 3651 3651 3651
Legend of the model specifications: SR-MR: analysis on mean returns for the social responsibility sample; SR-PI: analysis on price index for the social responsibility sample; CA-MR: analysis on mean returns for the alternative non social responsibility sample; CA-PI: analysis on price index for the alternative non social responsibility sample.
Legend of the variables: ht: conditional variance estimated in the GARCH (1,1) model;
ε
t2−1: arch term;h
t−1 : garch term; DBUBBLE: dummy which takes value of 1 after the March 10 2000 and zero otherwise.T-stats are in square brackets. ** 95 percent significance, * 90 percent significance. Source: Boccardelli-De Santo (2005)
Appendix 1
Criteria of KLD social ratings
SOCIAL ISSUE RATINGS
COMMUNITY
STRENGTHS Charitable Giving. The company has consistently given over 1.5% of trailing hree-year net earnings before taxes (NEBT) to charity [dopo o prima il ROI], or has otherwise been notably generous in its giving. Innovative Giving. The company has a notably innovative giving program that supports nonprofit organizations, particularly those promoting self-sufficiency among the economically disadvantaged. Companies that permit nontraditional federated charitable giving drives in the workplace are often noted in this section as well. Non-US Charitable Giving. The company has made a substantial effort to make charitable contributions abroad, as well as in the U.S. To qualify, a company must make at least 20% of its giving, or have taken notably innovative initiatives in its giving program, outside the U.S. Support for Housing. The company is a prominent participant in public/private partnerships that support housing initiatives for the economically disadvantaged, e.g., the National Equity Fund or the Enterprise Foundation. Support for Education. The company has either been notably innovative in its support for primary or secondary school education, particularly for those programs that benefit the economically disadvantaged, or the company has prominently supported job-training programs for youth. Other Strength. The company has either an exceptionally strong volunteer program, in-kind giving program, or engages in other notably positive community activities.
CONCERNS Investment Controversies. The company is a financial institution whose lending or investment practices have led to controversies, particularly ones related to the Community Reinvestment Act. Negative Economic Impact. The company’s actions have resulted in major controversies concerning its economic impact on the community. These controversies can include issues related to environmental contamination, water rights disputes, plant closings, "put-or-pay" contracts with trash incinerators, or other company actions that adversely affect the quality of life, tax base, or property values in the community. Other Concern. The company is involved with a controversy that has mobilized community opposition, or is engaged in other noteworthy community controversies.
CORPORATE GOVERNANCE
STRENGTHS Limited Compensation. The company has recently awarded notably low levels of compensation to its top management[ migliora bilancio ma quale effetto incentivo ?] or its board members. The limit for a rating is total compensation of less than $500,000 per year for a CEO or $30,000 per year for outside directors. Ownership Strength. The company owns between 20% and 50% of another company KLD has cited as having an area of social strength, or is more than 20% owned by a firm that KLD has rated as having social strengths. When a company owns more than 50% of another firm, it has a controlling interest, and KLD treats the second firm as if it is a division of the first.
Other Strength. The company has an innovative compensation plan for its board or executives, a unique and positive corporate culture, or some other initiative not covered by other KLD ratings.
CONCERNS High Compensation. The company has recently awarded notably high levels of compensation to its top management or its board members. The limit for a rating is total compensation of more than $10 million per year for a CEO or $100,000 per year for outside directors. Tax Disputes. The company has recently been involved in major tax disputes involving more than $100 million with the Federal, state, or local authorities. Ownership Concern. The company owns between 20% and 50%of a company KLD has cited as having an area of social concern, or is more than 20% owned by a firm KLD has rated as having areas of concern. When a company owns more than 50% of another firm, it has a controlling interest, and