POLITECNICO DI MILANO
D
EPARTMENT OFE
NERGYDOCTORAL PROGRAMME IN
E
NERGY AND NUCLEAR SCIENCE AND TECHNOLOGYA
MULTI-DIMENSIONAL
APPROACH
TO
THE
MODELLING
OF
POWER
PLANT
FLEXIBILITY
Doctoral Dissertation of:
Francesco Gardumi
Supervisor:
Prof. Emanuela Colombo
Tutor:
Prof. Fabio Inzoli
Chair of the Doctoral Program:
Prof. Carlo Bottani
“Here some one thrust these cards into these old hands of mine, swears that I
must play them, and no others.
[…] Ahab, but thou actest right, live in the game, and die in it.”
Herman Melville
Moby Dick, 1851Acknowledgements
In the first place, I express my gratitude to prof. Emanuela Colombo and prof. Fabio Inzoli for supporting this research from the very beginning. From our discussions the idea came to look at the issues in the Italian energy market from a wider perspective, diving into the principles of Game Theory and energy systems analysis. Thanks to their advice, my experiences with a number of research groups at Politecnico and abroad became possible.
I thank prof. Roberto Lucchetti and prof. Nicola Gatti for orienting my first steps in the field of Game Theory and starting with our group the search for new mathematical tools in energy modelling. The numerous chats with Nicola opened my mind to this fascinating world, and the discussions we had, armed with pen and paper, were some of the most genuine experiences of this research.
I express very special thanks to Eleonora Della Bartolomea, Mauro Fiale, all the staff and the Direction of Enel La Casella power plant, for constantly providing me with their support and expertise and working side by side during two years.
I thank prof. Mohammad Hesamzadeh, for leading me in the study of electricity markets and working at my side in developing the Game Theory model. I owe him my satisfaction for seeing the core of this work realised on this paper.
Finally, I thank prof. Mark Howells, Abhishek Shivakumar, Constantinos Taliotis and all the staff at KTH division of Energy System Analysis. Their supervision on my work during the period I spent in Stockholm allowed this thesis to bring a value added in the field of energy system analysis. However, not only was my period there a highly valuable professional experience, but also a wonderful and funny human experience among friends.
Contents
List of figures 11 List of tables 15 General nomenclature 17 Summary 19 PART I - Introduction 23PART II - Understanding the multi-dimensional nature of power plant flexibility 25
1. Context 27
1.1. The energy policy in Europe 27
1.1.1. Pathways for the decarbonisation of the electricity sector 29 1.1.2. Present and future role of gas-fired electricity generation in Europe 31
1.2. A country insight: the case of Italy 34
1.2.1. The National Energy Strategy 34
1.2.2. Present and future role of gas-fired electricity generation in Italy 36 2. Assessing the current impact of flexibility: review of the existing data 41
2.1. Power plant costs of flexibility 42
2.1.1. Decisions at the power plant scale 45
2.2. Electricity market costs of flexibility 46
2.2.1. Features of the Italian electricity market 46
2.2.2. Costs of flexibility in the electricity market 48
2.2.3. Decisions at the electricity market scale 50
2.3. Energy system costs of flexibility 52
2.3.1. Decisions at the energy system scale 53
2.4. Interaction between the three scales 54
3. Predicting the future impact of flexibility: review of the existing models 57
Nomenclature 57
3.1. Power plant models 58
3.1.1. State of the art modelling of power plants in flexible operation 58
3.1.2. Needs in power plant modelling 61
3.1.3. Tools for power plant modelling 63
3.2. Electricity market models 69
3.2.1. State of the art modelling of electricity markets 69
3.2.2. Needs in electricity market modelling 75
3.2.3. Tools for electricity market modelling 77
3.3. Energy system models 78
3.3.3. Tools for energy system modelling 80
3.4. Summary of the modelling needs 82
3.5. Objectives of the modelling activity 82
PART III - Modelling the multi-dimensional nature of power plant flexibility 85
4. Power plant model 87
Nomenclature 87
4.1. Thermodynamic model of a power plant in flexible operation 88
4.1.1. Design 89
4.1.2. Off-design control logics 92
4.1.3. Validation 94
4.2. Outputs of the thermodynamic model 97
4.2.1. Global outputs 97
4.2.2. Nodal outputs 100
4.3. Mathematical formulation of global performance indices 102
4.3.1. Fuel consumption at partial load 103
4.3.2. Cycling performance as a function of the power plant configuration 106
4.3.3. Cost of the starts 107
4.4. Power plant model: conclusions 109
5. Electricity market model 111
Nomenclature 111
5.1. A Game Theory model of a flexible electricity market 113
5.1.1. Reduction to a one-level problem 120
5.1.2. Treating the nonlinear terms 123
5.2. Outputs of the electricity market model 126
6. Energy system model 129
Nomenclature 129
6.1. An enhanced OSeMOSYS model for power plant flexibility 130
6.1.1. Original structure of OSeMOSYS 130
6.1.2. Derivation of the enhanced model 132
6.2. Outputs of the energy system model 144
7. Case studies 147
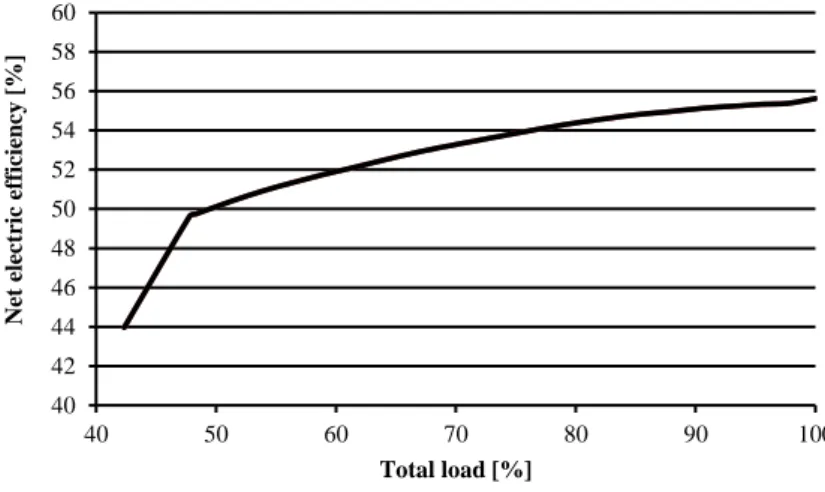
7.1. Power plant model: the costs of flexibility at La Casella CCGT 147
7.1.1. Computation of the fuel consumption 148
7.1.2. Computation of the cycling performance 151
7.1.3. Computation of nodal performance indices and their interrelation 156
7.2. Energy system model: a test case study 161
7.2.1. Introduction of the cost of the starts and the fuel consumption at partial load 161
7.2.2. Introduction of the cycling capability as a function of the power plant
7.3. Energy system model: the long-term energy planning of Cyprus 171
7.3.1. Scenario settings 172
7.3.2. Results and discussion 176
PART IV - Conclusions 181
Relevance and contributions in PART II 181
Relevance and contributions in PART III 182
Power plant model 182
Electricity market model 183
Energy system model 184
Final remarks 185
PART V - Appendices 187
Appendix A - Validation of the CCGT off-design model 187
Appendix B - Extended form of the electricity market model 189
B.1. Reduction to one-level nonlinear problem 189
B.2. Final structure of the model 190
Appendix C - OSeMOSYS 193
Appendix D - GNU MathProg formulation of the modifications to OSeMOSYS 213
D.1. Fuel consumption at partial load 213
D.2. Cycling performance as a function of the power plant configuration 213
D.3. Cost of the starts 214
List of figures
Figure 1. Shares of electricity generation [TWh] in three decarbonisation pathways.
Source: [7]. ... 29
Figure 2. Electricity generation and cumulative installed capacity in the EU according to the New Policies Scenario. ... 30
Figure 3. Electricity generation and cumulative installed capacity in the EU according to the Current Policies Scenario. ... 31
Figure 4. Electricity generation and cumulative installed capacity in the EU according to the 450 Scenario. ... 31
Figure 5. Gas-fired power plants capacity factors. Source: IEA, 2014 [12]. ... 32
Figure 6. Final electricity consumption in the EU. ... 33
Figure 7. Projections for the electricity generation in Italy by source for the Roadmap Scenario and global projections for the Reference Scenario. Source: [18]. ... 35
Figure 8. Final electricity consumption in Italy [TWh]. ... 37
Figure 9. Average wholesale day-ahead prices on gas hubs in the EU. Source: [22]. ... 37
Figure 10. Annual fossil-fuel fired generation in Italy [TWh]. ... 38
Figure 11. Sample load profile of a CCGT power plant in northern Italy in 2006 and 2013. ... 38
Figure 12. Net electric efficiency of a CCGT. Source: [38]. ... 42
Figure 13. NOx and CO emissions of a gas turbine as functions of the load. Source: [40]. ... 43
Figure 14. Load ramps of different fossil-fuel fired power plants. Source: [12]. ... 46
Figure 15. Example of derivation of the Market Clearing Price. ... 47
Figure 16. Shifting of the merit order and decrease of the MCP due to the penetration of renewable energy sources... 49
Figure 17. Historic trends of the PUN in years 2012 to 2014. ... 49
Figure 18. Interactions between the power plant, electricity market and energy system scales. ... 54
Figure 19. Scheme of the HRSG modelled in Flownex®. ... 64
Figure 20. Dynamic load profiles during an unloading ramp. ... 64
Figure 21. Comparison between a dynamic and a quasi-stationary model during a load ramp. ... 65
Figure 22. View of a CCGT from the interface of the online monitoring system. ... 67
Figure 23. View of a CCGT from the interface of Thermoflex simulation environment. ... 67
Figure 24. Possible situations in decision making. Source: [117]. ... 70
Figure 25. Matrix representation of the Prisoner’s Dilemma. ... 71
Figure 26. Structure of OSeMOSYS. ... 81
Figure 27. Outputs specifically linking the models with one another. ... 86
Figure 28. Scheme of La Casella CCGT power plant. ... 90
Figure 29. Temperature-Heat Transfer diagram of La Casella CCGT at full load. ... 92
Figure 30. Set point of the corrected TOT as a function of the gas turbine load. ... 93
Figure 31. Pressure set point in the IP drum... 94
Figure 32. Exergy flows across the components of the CCGT. ... 101
Figure 33. Net electric efficiency of a CCGT as a function of the load. ... 104
Figure 34. Comparison between the curves of the efficiency as from the mathematical formulation, models in literature, and a real CCGT. Case 1. ... 105 Figure 35. Comparison between the curves of the efficiency as from the mathematical
Figure 36. Sample subdivision of a day in time slices. ... 108
Figure 37. Three-level Game Theory setting of the electricity market. ... 113
Figure 38. Sample three-node network. ... 115
Figure 39. Stepwise constant curve of the generation cost. ... 116
Figure 40. Relation between the main variables related to the generation capacity. ... 132
Figure 41. Sample results when all the new constraints are correctly added to the source code. ... 136
Figure 42. Sample results when (6.9) is not added to the source code. ... 136
Figure 43. Sample results when (6.10) is not added to the source code. ... 137
Figure 44. Sample results when all the constraints are correctly added to the source code and both versions of the technology have non-null ResidualCapacity. ... 138
Figure 45. Net electric efficiency of La Casella CCGT as a function of the total load. ... 148
Figure 46. Relative error between computed and released correction factors as a function of the temperature. ... 150
Figure 47. Relative error between computed and released correction factors as a function of the pressure. ... 150
Figure 48. Sketch of the backward by-pass duct. ... 151
Figure 49. Sketch of the forward by-pass duct. ... 152
Figure 50. Sketch of the combined by-pass ducts... 152
Figure 51. Comparison between the measured and the calculated CO emissions. ... 153
Figure 52. GT Minimum Environmental Load as a function of the % by-pass on the backward and forward ducts. ... 154
Figure 53. Efficiency as a function of the % by-pass on the backward and forward ducts. ... 155
Figure 54. Steam by-pass flow as a function of the % by-pass on the backward and forward ducts. ... 155
Figure 55. Exergy destruction ratios in the HRSG as functions of the CCGT load. ... 158
Figure 56. Variation of the exergy destruction of components of the HRSG when the heat transfer coefficient of the LP-ECO is halved. ... 160
Figure 57. Annual generation with the original OSeMOSYS code. ... 164
Figure 58. Annual generation by time slice in one sample year with the original OSeMOSYS code. ... 164
Figure 59. Annual reserve with the original OSeMOSYS code. ... 165
Figure 60. Annual reserve by time slice in one sample year with the original OSeMOSYS code. ... 165
Figure 61. Annual generation when the cost of the starts is introduced. ... 166
Figure 62. Annual generation in one sample year when the cost of the starts is introduced. ... 166
Figure 63. Annual reserve in one sample year when the fuel consumption at partial load is introduced. ... 167
Figure 64. Assumed ResidualCapacity for the CCGT technology. ... 168
Figure 65. Total capacity in the modified scenario, with the original OSeMOSYS code. ... 169
Figure 66. Total capacity in the modified scenario, when the cycling capability is introduced. ... 170
Figure 67. Numerical results of the total capacity year by year. ... 171
Figure 68. Energy demand projections for the Cyprus case study. ... 173
Figure 69. Projections of the fuel prices for the Cyprus case study. ... 174
Figure 70. Projections of the carbon price for the Cyprus case study... 174
Figure 71. Results of total capacity in Cyprus from 2013 to 2040 with the original OSeMOSYS code. ... 176
Figure 72. Results of storage capacity in Cyprus from 2013 to 2040 with the original
OSeMOSYS code... 177
Figure 73. Results of annual generation with the original OSeMOSYS code. ... 178
Figure 74. Results of annual reserve with the original OSeMOSYS code. ... 178
List of tables
Table 1. Features of the World Energy Outlook scenarios. ... 30
Table 2. Frequency and mechanisms of damage in the main components of a CCGT... 44
Table 3. Cost of starts and ramps for state of the art and Best Available Technology CCGTs. ... 45
Table 4. Summary and grouping of the referenced thermodynamic models. ... 59
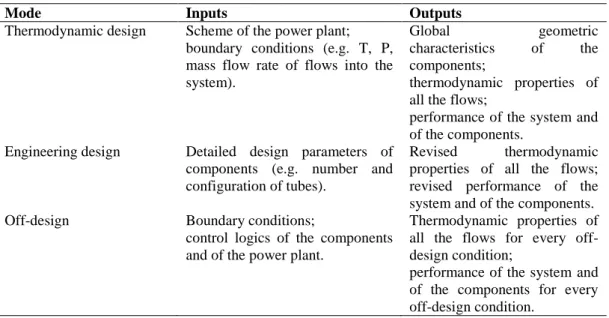
Table 5. Inputs and outputs to the thermodynamic, engineering, off-design modes of Thermoflex. ... 68
Table 6. Main design parameters of the modelled power plant. ... 89
Table 7. Main design characteristics of the gas turbine. ... 89
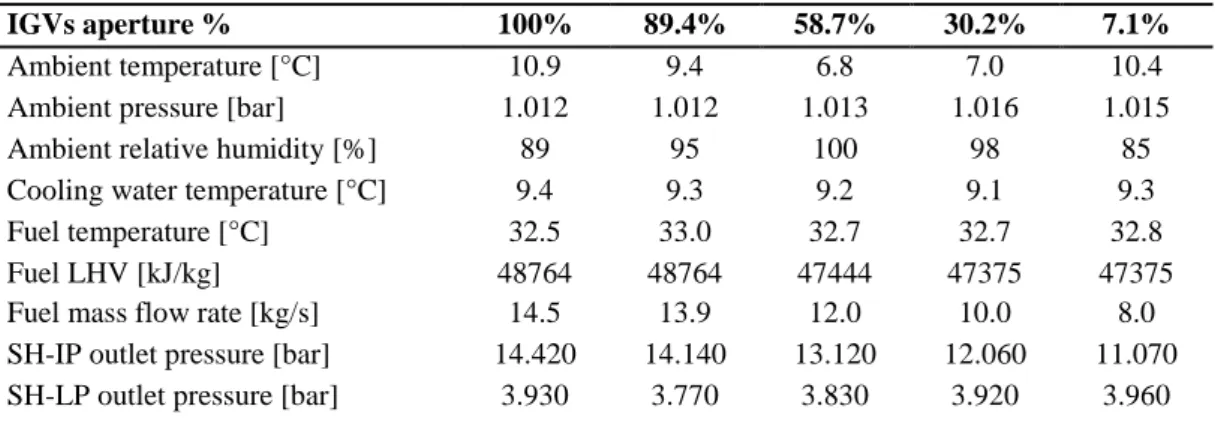
Table 8. Numerical inputs for the validation of the thermodynamic model. ... 95
Table 9. Outputs of the validation at 100% aperture of the IGVs. ... 96
Table 10. Outputs of the validation at 7.1% aperture of the IGVs. ... 96
Table 11. Resource – product – loss assumptions for the components of the CCGT. ... 101
Table 12. Sets in OSeMOSYS. ... 131
Table 13. Main parameters in OSeMOSYS... 131
Table 14. Main variables in OSeMOSYS. ... 132
Table 15. Summary of the new features in the enhanced model of OSeMOSYS. ... 144
Table 16. Nodal outputs of La Casella case study. ... 156
Table 17. Component results with different degrees of fouling on the LP-ECO. ... 159
Table 18. Main scenario assumptions for the test case study. ... 162
Table 19. Main cost and technology assumptions of the test case study scenario. ... 163
Table 20. Additional assumptions for the introduction of the modification for the cycling capability. ... 168
Table 21. Main scenario assumptions for the Cyprus case study. ... 172
Table 22. Current status of the energy system of Cyprus. ... 175
Table 23. Comparison of the real data and the model outputs at 89.4% aperture of the IGVs. ... 187
Table 24. Comparison of the real data and the model outputs at 58.7% aperture of the IGVs. ... 187
Table 25. Comparison of the real data and the model outputs at 30.2% aperture of the IGVs. ... 188
General nomenclature
In this section, only the acronyms and abbreviations employed in the whole dissertation are illustrated. The nomenclature specific to the models is listed at the beginning of Chapters 3, 4, 5 and 6.
Acronyms, abbreviations
CAES Compressed Air Energy Storage
CCGT Combined Cycle Gas Turbine
CCS Carbon Capture and Sequestration CSP Concentrated Solar Power DSC Direct Specific Consumption EOH Equivalent Operating Hours
GenCO Generation Company
GHG Greenhouse Gas
HRSG Heat Recovery Steam Generator
ICE Internal Combustion Engine
IGVs Inlet Guide Vanes
ISC Indirect Specific Consumption
KKT Karush-Kuhn-Tucker
MCP Market Clearing Price MGP Mercato del Giorno Prima MI Mercato Infragiornaliero
MILP Mixed-Integer Linear Program
MINLP Mixed-Integer Non Linear Program
MSD Mercato dei Servizi di Dispacciamento
OCGT Open Cycle Gas Turbine
PHS Pumped-Hydro Storage
PUN Prezzo Unico Nazionale
PV Solar Photovoltaic
TCL Technical Control Load TIT Turbine Inlet Temperature TOT Turbine Outlet Temperature TSO Transmission System Operator
Summary
In light of the challenges of a fast developing world and an increasing need for energy, the energy supply system of the European Union suffers from structural weaknesses. To address them, the European Commission issued long-term strategies for the development of the energy system: the Climate and Energy Package and the Energy Roadmap identify the pathways to 2020 and 2050, respectively. According to these strategies, one of the keys to achieve higher levels of sustainability, security and competitiveness is to decarbonise the energy system, i.e. to reduce the reliance on fossil fuels and increase the penetration of renewable sources.
A number of mathematical models have been designed, to turn these generic indications into a more concrete energy technology and generation mix. These models seek for the mix which complies with the decarbonisation objectives set by the European Commission and guarantees the system’s adequacy at the minimum global cost. The European Union, in response, issues policies and directives for this mix to be pursued. All of the models tend to agree over one point: the future energy system, and particularly the electricity grid, will have to become more flexible.
A flexible electricity system must integrate storage technologies, demand response technologies and fast ramping fossil-fuel fired units. A relevant amount of research work is produced about the integration of storage and demand-side technologies in the future electricity system. However, these are still at a development stage, while flexible fossil-fuel fired units are already commercially widespread. Therefore, at present, the flexibility of the energy system relies almost only on such power plants. In order to balance the fluctuations of renewables, these power plants are gradually shifting their operation profiles from base- to peak-load, reducing the average load factor and increasing the number and slope of deep ramps and starts. This change is deepened by the interaction of two more factors: the decrease of the final electricity consumptions due to the financial crisis and the fluctuation of the gas prices.
The shift towards peak-load operation brings about a set of new problems and a chain reaction in the whole electricity supply system: power plant cycling has a cost; this causes the price bids of the companies on the market to increase and their share and revenues to decrease; this, in turn, may cause a number of companies to decommission or relocate several power plants at the same time, thus undermining the adequacy of the system. The models employed to predict the optimal long-term energy technology and generation mix do not take into account these dynamics of flexibility. Consequently, there is a risk the policies of the European Union aimed at pursuing this mix will be ineffective: the actual mix may happen to be different, the costs of the system higher, the adequacy undermined. The research of the author had an overall objective to address this risk and this doctoral dissertation describes how such objective was pursued.
The first part of the dissertation provides an introduction to the whole work. In the first place, it briefly discusses how the need for flexible energy and electricity systems arose from the new paradigm of sustainable energy supply. Subsequently, it states the overall objectives of this PhD research and how they are intended to contribute to the scientific literature.
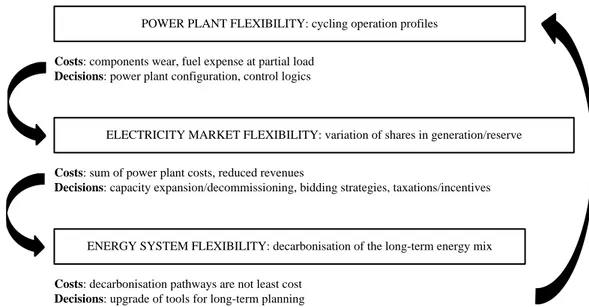
The second part looks into the issue of power plant flexibility and synthesizes its main features. The author analyses how the need for flexible operation of fossil-fuel fired power plants arises, stemming from the European and national long-term strategies. Thereafter, the implications of power plant flexibility on the energy supply are described. It emerges there are implications on three scales: the power plant, the electricity market and the whole energy system. At each one of these scales the requirement for flexible electricity supply causes costs and reactions of the actors to reduce these costs.
At the power plant scale, the operators experience higher costs for components wear and decreased efficiency. Their decisions to lower these costs involve power plant modifications, actions on the control systems and new O&M practices.
At the electricity market scale, the companies see the costs of the power plants increase, and they are forced into making higher bids. This reduces their market share and, therefore, their revenues. The decisions to regain competitiveness range from decommissioning or relocating capacity to trying new opportunities for revenues, such as the reserve capacity markets.
At the energy system scale, the costs arise when the dynamics related to flexibility are not taken into account and the energy mix ends up different from what envisaged by the planners. The decisions at this scale consist in anticipating the costs and reactions to flexibility at a power plant and electricity market scale, and update the forecasts and pathways to decarbonisation.
As can be seen, these three scales are related to one another and they involve dynamic interactions between power plant operators, companies and energy system planners. In order for these dynamics to be fully captured, an interdisciplinary research had to be carried out. It ranged from Thermodynamics and power plant Engineering, to Decision Support and Macroeconomics. The author considers the elaboration of a multi-dimensional picture of the impact of flexibility on the energy system as the very innovative core of this PhD research.
In the third part of the dissertation, the weaknesses of the models for long-term energy system planning are discussed and addressed. If the flexibility of the electricity supply impacts the system on three scales, mathematical models to represent this impact at the three scales are needed. The author designed models to meet these needs.
The costs of flexibility and the reactions of the operators at a power plant scale are represented through two kinds of models: a thermodynamic model of a fossil-fuel fired power plant, set up with the help of Thermoflex simulation environment, and an analytical formulation of global performance indices, embeddable in electricity market and energy system models.
The thermodynamic model consists in a quasi-stationary off-design model, featuring all the relevant control logics employed in real operation. It was set up in collaboration with the operators of a power plant in the North of Italy. Its purpose is to provide the operators with an interface for predicting the thermodynamic costs of flexibility and evaluating feasible solutions for increasing the ramping capability. In line with such objective, the output of the model is indices about the off-design performance of the power plant and of the individual components, through First and Second Law of Thermodynamics quantities, respectively. The power plant model is applied to an industrially relevant case study, which is the detailed off-design performance prediction of the whole cycle and the individual components of a CCGT operating in the North of Italy, as a function of different control logics. This allowed the operators to evaluate new strategies for enhancing the cycling capability of the power plant, such as the decrease of the minimum load of the power plant.
The analytical formulation consists in equations for computing aggregate performance indices of the power plant in flexible operation. Specifically, the cost of the starts, the fuel cost for decreased efficiency at partial load and the cycling capability as a function of the power plant configuration are modelled. These equations provide the link between the power plant scale and the electricity market or energy system scales: when embedded into electricity market or energy system planning models, they allow the global thermodynamic costs computed with power plant models to be fed into the electricity market or energy system models.
The costs of flexibility and the reactions of the companies at the electricity market scale are represented through a model based on Game Theory. Among the decision making methodologies, Game Theory is the most suitable in all problems where several objectives and several decision makers are involved. The proposed electricity market model is, in Game Theory terms, a
Stackelberg stochastic game. It is a nonlinear two-level optimisation program, which is reduced, thanks to the duality theory, to a one-level mixed-integer linear program. In addition to traditional generation dispatch models, it endogenously computes the quantity and price bids and the generation expansion strategies which guarantee each company the maximum profit, given the decisions of the other companies. The novelty of the model developed by the author with respect to others in literature lies in three major characteristics:
A number of features of flexible electricity markets are gathered and represented together in the model, while in literature they are represented separately, by different models.
The costs of flexibility are accounted, through the equations formulated at the power plant scale.
The demand for electricity, the demand for capacity reserve and the cycling costs are considered stochastic and not deterministic quantities.
Only the theoretical formulation of the model is presented. Its application to a country-wide electricity system and its translation into a formulation to be embedded in energy system planning models turned out to be long-term research activities. They were not finalised during the PhD research.
Finally, the cost of flexibility at an energy system scale is computed by modifying an existing open source energy system planning model, OSeMOSYS. This is a partial equilibrium model, consisting in a multi-period, multi-regional linear program. The mathematical formulation derived for the cost of the starts, the costs for decreased efficiency and the cycling capability at a power plant scale is introduced into the model with proper adaptations. As other energy system models, OSeMOSYS computes the least cost long-term energy technology and generation mix, subject to constraints dictated by the European decarbonisation objectives. In addition, the introduced modifications allow the costs and dynamics of flexibility to be accounted. The risk for European energy planners to face unforeseen shifts and costs of the energy mix due to flexibility is thus reduced when employing this model.
The modified energy system model is applied to a test case study and to a real case study. The test case study proves that the impact of power plant flexibility on the energy system planning can be relevant; the real case study, the long-term energy planning of Cyprus, provides a small scale example of how flexibility may impact a larger system like Europe. The costs of flexibility computed through the power plant model are given as inputs to the energy system case studies. When taken into account, they cause the optimal long-term energy mix to be sensibly different from the reference case where they are not taken into account. This proves the power plant and the energy system scales are dynamically related and the energy policies must be informed with the impact of flexibility.
PART I - Introduction
For centuries, primary energy resources were extensively deployed to foster the industrial development of a limited number of countries. Recently, with the steeper growth of the global population, the demand for energy has begun to increase faster than ever experienced. The Governments are faced with problems related to the energy supply, for in many regions and countries it seems to lack the fundamental requirements of sustainability, secureness and competitiveness.
Energy systems must be sustainable on three dimensions: social, economic, environmental. The social sustainability of an energy system may be identified with its capability to contribute to the development of a society; the economic sustainability looks at the cost of the energy system, including the investment and operation costs as well as the cost of the externalities; the environmental sustainability requires that the availability of primary resources, the availability of renewable resources and the environmental impact of energy conversion systems be cared about. Currently, some of the widest energy systems, like those of the European Union, the United States or the BRIC countries (Brazil, Russia, India, China), particularly lack environmental sustainability: the deployment of non-renewable primary resources for their industrial development implied huge amounts of environmentally harming emissions on one side, and the gradual depletion of the primary resources on the other side.
As far as the secureness of the energy systems is concerned, it is related in large part to the energy independence of the countries. Many economies rely much on the import of primary resources like gas and oil, and this exposes them to the political instability of the regions from where the resources are supplied.
Finally, the competitiveness of the energy systems lies in their capability of meeting the demand at affordable global costs and with least exposure to price fluctuations. The energy supply mix of a country should be diversified enough for its global costs not to depend too much on the affordability of one of the sources. Currently, most energy systems rely heavily on non-renewable primary resources, which are being depleted and are sold at highly fluctuating prices.
If the weaknesses of the energy systems with respect to these three dimensions are not addressed, the development of the remaining part of the world economies may be prevented and the global society may be exposed to severe consequences. Such issue has been brought to the general attention by the political debate in the last decades, starting from COP3 in 1997, when the Kyoto Protocol was signed, down to COP15 and the Copenhagen Agreement, and to the recent COP21. In the frame of these Conferences of Parties, the Governmental Organisations and the individual states started to review the traditional paradigm of energy supply, and to identify long-term pathways for restructuring the energy systems. Most of these pathways envisage a deep twist from a fossil-fuel fired to a renewable-based energy supply mix, in order to increase the environmental sustainability, the energy independence and the competitiveness of the energy systems.
The high penetration of renewable energy sources in the energy supply mix represents a radical change for traditional systems, and it calls for an equally radical mutation of the attitudes of the energy suppliers: it requires that the operators of the energy conversion plants upgrade the operation strategies; it forces the generation companies to reconsider their portfolio investments and decisions; it implies that Transmission System Operators (TSOs), Authorities and Governments, in charge of guaranteeing the security and the adequacy of the energy supply, upgrade the technological level of the supply chains, the rules of the energy markets and the long-term policies.
These dynamics are particularly relevant in the electricity supply sector, where the demand for electricity must be met instantaneously by the supply, but energy can be stored only to a limited amount. Under these conditions, the high penetration of intermittent and non-controllable renewable energy sources in the electricity generation mix forces the planners to consider investments and new technological options for guaranteeing a flexible matching between demand and supply. A need for flexibility of the electricity supply system arises.
Different definitions of flexibility exist. According to planners it describes the extent to which an electricity system can adapt the pattern of electricity generation and consumption in order to balance supply and demand; according to generation companies and power plant operators, it defines the ability of a power plant to vary its generation output as fast as possible, without harming the components. From these definitions, it can be imagined that when the need for flexible electricity supply arises, it carries impacts at different scales, from the individual power plant to the electricity market and the whole system.
In order for the energy system planners to best address the weaknesses of the energy system and draw effective pathways for restructuring it, they need to understand how the need for flexibility at each scale can be met, at what cost and at what consequences. They must consider the demand and supply of flexibility as a multi-dimensional problem, because the impact of flexibility at one scale is likely to be related to the impact at another scale. If they do not develop such perspective, their long-term pathways for restructuring the national or regional energy systems may turn more expensive than they predict, or ineffective.
This research moves one step into the elaboration of a comprehensive, multi-dimensional picture of the flexibility of electricity systems. It specifically aims at identifying and mathematically formulating the impact of the flexible operation of fossil-fuel fired power plants on the energy system at different scales. The core of the research is divided in two parts. In PART II the need for flexible operation of fossil-fuel fired power plants, its causes and its consequences are investigated. A multi-dimensional picture of the impact of flexibility on the energy system is elaborated, starting from information scattered in the scientific literature and industrial datasets. In PART III, models and mathematical formulations of the impact of flexibility are developed, able to capture its multi-dimensional nature. These models are then applied to numerical examples and real case studies, to predict how the decision makers at different scales will change their strategies when updated with the costs and benefits of flexibility.
PART II - Understanding the
multi-dimensional nature of power plant flexibility
In this part of the PhD dissertation, the author presents an in-depth analysis of the issue of power plant flexibility. The analysis aims at gradually bringing to surface that the flexibility of the electricity systems envisaged by the European decarbonisation scenarios has impacts on different temporal and spatial scales. Though not yet entering the modelling details, which are discussed in PART III, this section represents the actual innovative core of the research: in literature, the issue of flexibility has not been looked at from a global perspective, due to its multi-dimensional nature. Mono-thematic researches about issues related either with power plant or market operation are scattered around and the results of studies at a power plant scale do not feed the studies at the electricity market scale. Building all the information together and proposing a 3D view of power plant flexibility and its multi-dimensional impact on the energy system required a wide-spectrum research, diving into diverse scientific disciplines.
In Chapter 1, a context analysis is carried out. The author first explains where the issue of power plant flexibility originates from and what its general features are at a European and national scale. In Chapter 2, the author gathers data existing in literature and details the present impact of flexibility at three scales: the power plant, the electricity market and the energy system. Eventually, in Chapter 3, the models for predicting the future impact of flexibility at the three scales are reviewed, and their weaknesses highlighted. PART II ends with the statement of the needs and objectives which drive the following modelling part of the dissertation.
1.
Context
1.1. The energy policy in Europe
In the introduction to this thesis, it was highlighted that the fast development of the economies worldwide is exposing several energy systems to structural weaknesses in three dimensions: sustainability, secureness and competitiveness. The European Commission has recently discussed why the European energy sector suffers from these weaknesses, separating the causes into the three dimensions [1]:
Sustainability. In the last decades, increasing concerns have been arisen about the
depletion of primary resources and the potentially harmful effect of greenhouse gases (GHGs) and polluting emissions. The Intergovernmental Panel On Climate Change (IPCC), established by the United Nations in 1988, also argue that greenhouse gases emissions may contribute to the global warming [2]. In Europe, 80% of all GHGs emissions are ascribable to energy uses.
Secureness. With business as usual, the energy dependence of Europe from imports is
expected to grow: by 2030, the reliance on imports is projected to grow from 57% to 84% for natural gas, from 82% to 93% for oil. This carries economic and political instability.
Competitiveness. The reliance of the European Union on fossil fuel reserves owned by
few suppliers exposes the countries to the exercise of market power and prevents them from fully benefitting from the liberalisation of the energy markets.
The European Commission argues that failing to address these weaknesses or delaying the action would put unbearable costs on the whole European Union. The first step in creating a competitive environment in the energy sector across Europe was the creation of energy markets by individual Member States since the mid ‘90s. However, the liberalisation process was not enough for the necessary levels of sustainability, secureness and competitiveness to be reached, for two main reasons: in the first place the national markets of some countries never became fully competitive; in the second place, the decentralisation of the energy planning fragmented the European energy system even more, with the risk of undermining the security of supply in the continent. Based on these considerations, the European Council stated that the energy policy of the Member States had to be given common guidelines and objectives. The Strategic Energy Technology Plan (SET-Plan) [3] served this purpose and set for the first time objectives and guidelines for a long-term European energy strategy. The first operative entailment of the SET-Plan was the Climate and Energy Package [4], which gave birth to the Europe 2020 Strategy [5]. Its well-known targets are:
20% reduction of greenhouse gases emissions by 2020, compared to 1990 levels. This addresses the scarce environmental sustainability of the energy system, on both the demand and supply sides.
Increase of the production from renewable energy sources, in order for renewable energy to achieve 20% share in the overall EU energy consumption. This mostly promotes the security of supply, and consequently the political and economic stability of the region. 20% reduction in the primary energy consumption, compared to 2020 projections,
making the consumers less energy-dependent. It also contributes to reducing the environmental harm due to local emissions.
The SET-Plan also introduced a longer-term vision to 2050, with the aim of nearly decarbonising the energy sector. This vision was embodied into the Energy Roadmap 2050 [6], which set an objective of abating the energy-related GHGs emissions by 80 to 95% by 2050.
Introducing such long-term time horizon brought a totally new perspective in energy system planning and raised the question of how to meet the 2050 goals. The decarbonisation envisaged by the Energy Roadmap 2050 is much more ambitious than the objectives set by Europe 2020. These last can be reached through many pathways and every Member State has many degrees of freedom in their choice. On the contrary, the possible pathways to reach full decarbonisation by 2050 are much less than those to reach the 2020 targets, so they must be firmly negotiated among the States far in advance. Apart from huge diplomacy efforts, this also calls for high resolution energy system forecasting and planning models, and for the elaboration of a number of energy scenarios at the European scale. These scenarios must give insights about the possible energy technology and energy production mix until 2050. In [6], the European Commission identifies a number of scenarios, based on different assumptions about the commitment of the Member States in the future:
High Energy Efficiency: it reflects a political commitment on reducing final
consumptions through energy efficiency measures and establishment of saving obligations.
Diversified Supply Technologies: all the energy technologies compete in markets with no
specific support measures. Carbon pricing is applied and Carbon Capture and Sequestration (CCS) is considered.
High Renewable Energy Sources: it accounts for strong incentives to renewable energy
technologies, which would lead them to reach 97% share in electricity consumption.
Delayed CCS: similar to the Diversified Supply Technologies scenario, but with delay in
the employment of CCS, assuming its learning curve is longer.
Low Nuclear: again similar to Diversified Supply Technologies scenario, but assuming
no new nuclear is built, due to the concerns about nuclear security after Fukushima incident.
The preliminary predictions for these scenarios agree on some qualitative conclusions. The first and most relevant change envisaged to reach decarbonisation is the highly increasing role of electricity in the energy mix. This implies that particular care will have to be taken for low carbon electricity generation technologies. Linked to this, the penetration of renewable sources in the energy and, particularly, electricity supply must increase by great amount. Since most of the renewable energy technologies have not reached grid parity, yet, they shall be still financially supported for a number of years. With time, however, the investments should shift towards the integration of new markets, development of the grid and development of storage technologies. Gas-fired electricity generation will play an increasing role in all scenarios and it will be critical for the transformation of the electricity sector at least until 2030. Gas-fired power plants will have a chance to become low-carbon technologies if equipped with CCS, provided it turns competitive. Also nuclear-fired generation will play a fundamental role in driving towards a low-carbon energy system, unless the safety concerns lead most countries to ban this technology. The role of nuclear will be more significant, the more the transport sector is electrified. Eventually, and linked to this all, the energy system will have to become smarter, more decentralised and more interconnected. Though the European Commission is clear about the possible pathways to the decarbonisation of the energy sector, their preliminary predictions do not identify the possible configurations of the energy technology and production mix, needed to meet the decarbonisation objectives.
1.1.1.
Pathways for the decarbonisation of the electricity sector
In view of the energy policy set by the Energy Roadmap 2050, the analysts started studying which pathways would allow the European Union to meet the decarbonisation objectives. Such pathways are typically based on an economic cost minimisation criterion: they aim at finding the energy technology and production mix which minimises the discounted global cost of the energy system in the timeframe considered, given the constraints on emissions and the predicted costs of the technologies.
The pathways identified upon the objectives of the Energy Roadmap 2050 describe the technological implications of the policy framework designed by the European Commission. In the following, a focus is made on the electricity sector, which is the object of this thesis. In [7] the feasibility and the challenges of realising 80% GHG emissions abatement in Europe by 2050, as envisaged in the Energy Roadmap, are discussed. Three pathways are investigated, with 40, 60, 80% share of renewable energy sources in the electricity generation, respectively. In Figure 1 the share of different technologies in the electricity generation [TWh] from 2010 to 2050 according to the three pathways is shown. In all cases, meeting an 80% decarbonisation objective means 95% GHG abatement in the power sector. Nonetheless, fossil-fuel fired generation, in particular gas-fired generation, maintains a key role in the transition in all the scenarios. Even in the 80% renewables scenario, it is forecasted that in 2050 part of the generation will still be in charge to gas-fired power plants, equipped with CCS. Most of this generation, in such high renewables scenario, will be supplied by backup power plants, which are expected to share around 14% of the installed capacity and 5 to 8% of the total generation. According to the authors, the backup power plants should be mostly highly flexible power plants like Open Cycle Gas Turbines (OCGTs), because Combined Cycle Gas Turbines (CCGTs) equipped with CCS are expected to require too long warm start-up times. Similar conclusions are drawn in other studies focussing on the infrastructure needed to support the high renewables scenarios [8–10].
Figure 1. Shares of electricity generation [TWh] in three decarbonisation pathways. Source: [7].
Another authoritative insight about the possible long-term energy technology and generation mix is provided by the IEA World Energy Outlook [11]. The study makes projections to 2040,
the scenarios are listed in Table 1. Scenario 450 mirrors the 80% GHG abatement scenario by the European Commission.
Current Policies New Policies 450
Rationale Comply with Europe 2020 strategy; included policies formally adopted until mid-2014
Partial implementation of Europe 2020 strategy; policies formally adopted until mid-2014 and relevant new proposals
Keep the increase in global average temperature within 2 °C, with 50% probability Key measures 20% reduction of GHGs by 2020; 20% increase of RES in final energy consumption by 2020;
20% reduction of final energy consumption by 2020;
Current ETS scheme;
partial implementation of 20% reduction of consumption target; partial implementation of EU Energy Efficiency Directive; National Energy Efficiency Action Plans;
30% reduction of GHGs by 2030; reinforcement of ETS scheme; full implementation of EU Energy Efficiency Directive; Common Measures
financial support to RES; financial support to CCS; Industrial Emissions Directive; removal of barriers to CHP; retirement of all nuclear in Germany by 2022.
Table 1. Features of the World Energy Outlook scenarios.
In Figure 2 through Figure 4, the results of the forecasting models, in terms of installed capacity and electricity generation, are presented for each of the three scenarios.
Figure 2. Electricity generation and cumulative installed capacity in the EU according to the New
Policies Scenario. 0 500 1000 1500 2000 2500 3000 3500 4000 4500 1990 2012 2020 2025 2030 2035 2040 E lec tr icity ge n er at ion [TWh ] 0 200 400 600 800 1000 1200 1400 2020 2030 2040 Cum . in stalled cap ac ity [G W] Solar PV Wind Bioenergy Hydro Nuclear Gas Oil Coal
Figure 3. Electricity generation and cumulative installed capacity in the EU according to the
Current Policies Scenario.
Figure 4. Electricity generation and cumulative installed capacity in the EU according to the 450
Scenario.
It is clear from the graphs that the generation from renewables is expected to grow in all cases, little in the Current Policies Scenario, by great amount in the other two. Nuclear power remains quite a big player as well. On the contrary, most uncertainty is cast over the role of natural gas: in the New Policies Scenario its weigh increases, both in terms of absolute values and of share. On the contrary, in the 450 Scenario, which draws on the recommendations of the Energy Roadmap 2050 (80% GHG abatement by 2050), the gas-fired generation is expected to decrease, while the installed capacity will increase. This means that gas-fired power plants would be operating with much lower load factors, as backup power plants for intermittent renewables.
1.1.2.
Present and future role of gas-fired electricity generation in Europe
IEA considers the New Policies Scenario the most likely to occur, given the direction the national and international policies are taking. This entails that the ambitious objectives set by the Energy Roadmap 2050 are unlikely to be met. However, one feature is common through all the scenarios, independently from the assumptions they build on. With increasing penetration of renewables, the electricity supply must gradually become more flexible. According to the definition by IEA, ‘flexibility describes the extent to which an electricity system can adapt the pattern of electricity generation and consumption in order to balance supply and demand’. Generically, system flexibility can be pursued in four ways: integration of electricity networks, electricity storage, demand response and generation from dispatchable power plants. Several technologies can provide either of these services, and IEA makes a deep review about their maturity in [12].0 500 1000 1500 2000 2500 3000 3500 4000 4500 2020 2030 2040 E lec tr icity ge n er at ion [TWh ] 0 200 400 600 800 1000 1200 1400 2020 2030 2040 Cum . in stalled cap ac ity [G W] Solar PV Wind Bioenergy Hydro Nuclear Gas Oil Coal 0 500 1000 1500 2000 2500 3000 3500 4000 4500 2020 2030 2040 El ec tr ic ity ge ner at ion [ TWh] 0 200 400 600 800 1000 1200 1400 2020 2030 2040 C um . in st alled capac ity [ G W] Solar PV Wind Bioenergy Hydro Nuclear Gas Oil Coal
The integration of electricity networks can bring benefits only in the long term, since it requires investments in new interconnectors and new market rules. Moreover, the need for investments may be mitigated if storage, demand response and dispatchable generation technologies are developed. As for storage technologies, IEA underlines that they are not in general mature enough to be addressed as game changers in the short and medium term. To date, storage shares 3% of the total installed capacity worldwide. 99% of it is Pumped-Hydro Storage (PHS), almost all of the remaining part is Compressed Air Energy Storage (CAES). Both are medium-term storage options (hours to weeks). Most of the sites eligible for PHS have been deployed, therefore PHS is not expected to grow, while its costs are. Current CAES technology has 50-60% efficiency, comparable to CCGTs. It is claimed the only big potential may come from adiabatic or isothermal CAES, still far to be commercially widespread. Research effort is still needed for hydrogen storage, suitable for seasonal storage. Batteries have potential for small appliances, off-grid small scale generation and the transport sector.
As far as demand response is concerned, the technology which is expected to contribute most is smart grids. To date, the rate of dissemination of smart grids is unlikely to meet the 450 scenario targets, but their penetration is growing steadily. In 2013, the global penetration of smart meters was 20%, projected to rise to 55% by 2020.
The generation from dispatchable fossil-fuel fired power plants is, at present, the most competitive option for meeting the requirements of flexibility in the electricity network. Therefore, they are expected to contribute significantly to the adequacy of the system in the next decades, while they will probably compete with the other flexible technologies in the longer term. Currently, these thermal units are increasingly called upon to balance the fluctuations of intermittent renewables, and their operation becomes flexible under several respects:
The average load factors, defined as the ratio between the effective Equivalent Operating Hours and the hours in one year, decrease, as shown in Figure 5. This means that: on one side the power plants operate more time at highly partial load; on the other side they are awarded generation on the markets for less time.
The number of start-up cycles increases up to daily, and the load ramps become deeper.
Figure 5. Gas-fired power plants capacity factors. Source: IEA, 2014 [12].
IEA does not draw univocal conclusions about which technology, among the fossil-fuel fired, is the best candidate for backing up intermittent renewables in the long term. Either OCGTs, CCGTs or Internal Combustion Engines (ICEs) are generally suitable for cycling and off-design operation, mostly due to their ramping characteristics. However, which one would allow for flexible electricity supply at the minimum cost of the system also depends on other factors. Among them,
0% 20% 40% 60% 80% 100% 2008 2011
the most relevant are the price of the fuels, the carbon taxes, the efficiency of the technologies and the pattern of the final electricity consumption.
Price of fuels and carbon taxes
With a current price of coal of around 12 €/MWh, the Levelised Cost of Electricity (LCOE) of CCGTs is on average lower than that of coal-fired power plants for a gas price lower than 28 €/MWh [12], as happened throughout the early 2000s until 2012. This means that CCGTs are more competitive also for base-load generation. If the price of coal lowers or the price of gas increases, the figure turns upside down, and the competitiveness of CCGTs might be limited to the supply of peak-load. At present, this element casts great uncertainty over which technology will be most convenient and for which kind of operation, given the wide fluctuations of the gas prices on the wholesale market in the last decade. However, in the long term the gas prices are expected to grow, on average, and this is going to reduce the share of gas-fired power plants as base-load suppliers.
Also the carbon tax plays a role in determining whether shifting from coal to gas is convenient, LCOE-wise. At recent gas prices of around 30 €/MWh, a carbon price higher than 10 €/tCO2 is
sufficient for the LCOE of CCGTs to be lower. Since the carbon price is forecasted to grow through the next decades, it should favour gas-fired generation, counterbalancing the effect of the fuel prices.
Efficiency of the technologies
CCGTs have the highest efficiency among the fossil-fuel fired power plants. The Best Available Technology efficiency outreaches 60% and is expected to increase up to 65% in the next five years [12]. However, at small scales or at highly partial loads the efficiency decays below that of some ICEs or OCGTs. For this reason, the last two technologies may be preferred in case the power plants are expected to operate mostly with low load factors. However, the turbine suppliers currently put much effort in increasing the full-load efficiency of the machinery, while the power plant operators are considering retrofits to increase the part-load and minimum-load efficiency of CCGTs. These elements, together with retrofits to increase the ramping capability of CCGTs, may turn these plants competitive in the whole range of load factors.
Historic trend of the electricity consumption
At the beginning of the 2000s, when most electricity sectors in Europe were liberalised, the final electricity consumption was steadily increasing in the Union, as shown in Figure 6 [13].
Figure 6. Final electricity consumption in the EU.
0 200 400 600 800 1,000 1,200 1,400 1,600 1,800 2,000 2 0 0 2 2 0 0 3 2 0 0 4 2 0 0 5 2 0 0 6 2 0 0 7 2 0 0 8 2 0 0 9 2 0 1 0 2 0 1 1 2 0 1 2 2 0 1 3 F ina l El . co ns um ptio n E U2 8 [ G Wh]
At the same time, the wholesale price of natural gas was low. This conjuncture raised large interest in big sized gas-fired generation, i.e. CCGTs, since it represented the most efficient and most profitable option for generating electricity on large scale. A huge number of CCGTs were built or repowered from old coal- or oil-fired boilers. However, when the financial crisis came, the electricity consumption dropped, mostly due to the decrease of the industrial consumption (blue columns in Figure 6). Suddenly, many national electricity systems turned out to be highly oversized. This contributed, together with the increasing penetration of renewables, to decrease the load factor of the CCGTs and relegate them to peak-load or backup power plants. This situation is not expected to change deeply, since the European energy policies aim at reducing the final consumption. With this perspective, many companies started decommissioning part of their installed capacity, and they still do. This is a natural consequence, in competitive markets. However, with increasing penetration of renewables the energy system may require in the long-term a consistent backup capacity of gas-fired power plants, as described above. Part of the present overcapacity of CCGTs may take on this role. If too much capacity is dismissed now, this may affect the adequacy of the electricity systems in the future.
From the context analysis a scenario emerges where the European energy system is facing a deep change. Many of the challenges will have to be played on the electricity system, where strict objectives of decarbonisation were set out: the penetration of renewables is due to increase more than ever experienced, the need for flexible electricity supply is urgent. Since flexibility is a new requirement in the planning of energy systems, it must be still understood which technological mix will allow the highest degree of flexibility to be reached at the lowest cost. Among the fossil-fuel fired technologies, CCGTs, OCGTs, ICEs may all have a prominent role as peak-load or backup units, depending on their prospective costs, possibilities of retrofit, capability to cycle and operate at partial loads. Moreover, their competitiveness in the future electricity systems is highly sensitive to external conditions, such as the prices of the fuels, the carbon taxes and the final electricity consumption. More reliable predictions about the expected future energy technology mix may be obtained if more specific contexts are considered, such as individual countries.
1.2. A country insight: the case of Italy
With some exceptions (such as Norway, which relies on hydroelectric by almost 97% [14]), many European countries are expected to face the transformations predicted for the Union as a whole. The most critical situations are already occurring in United Kingdom, France and Italy [15]. In the following sections, the case of Italy is briefly introduced, as it is fully representative of the issues brought about by the flexibility in the electricity sector.
1.2.1.
The National Energy Strategy
It is useful to start from the performance of Italy with respect to the three core weaknesses of the European energy system. Despite being virtuous on the sustainability point of view, with higher energy efficiency than the European average, Italy is weaker on the security and competitiveness sides [16]:
84% of the primary energy demand relies on imports, compared to an average 53% in the European Union. This is also due to the peculiar electricity mix, with no nuclear and almost all the fossil-fuel fired generation provided by gas-fired power plants.
The energy mix is not competitive: the price of energy, particularly of electricity, to the final consumers is significantly higher than the European average. The spot prices of electricity are on average 70% higher than in Spain, France and Germany. This is due to
several factors. The first one is the electricity generation mix, mainly based on renewables and on gas-fired generation: the incentives to renewables have been up to 100% higher than the European average, while the wholesale prices of gas have been 25% higher. The second factor is related to many extra expenses charged onto the bills, like the dismissal of nuclear plants, incentives for certain categories of consumers, incentives to some kind of non-renewable generation, bottlenecks in the electricity grid. In response to these weaknesses and in compliance with the guidelines of the Climate and Energy Package, the Italian Government elaborated in 2010 the ‘Piano di Azione Nazionale’ [17], which was embodied in the National Energy Strategy [16]. In the first place, the Strategy raises on the objectives of the Climate and Energy Package:
24% reduction of the primary energy consumption with respect to what predicted by 2020.
21% GHG emissions abatement with respect to 1990 levels.
Increase of the production from renewables so as to achieve 23% share of the final gross energy consumption.
In addition, it also sets objectives for 2050:
Reduction of the primary energy consumption by 17% to 26% in 2050 with respect to 2010.
Increase of the penetration of renewables so as to achieve 60% in final gross consumption, and 85 to 90% in final electricity consumption.
Extensive electrification of the energy sector, with focus on the transportation sector. Fostering gas-fired electricity generation as a bridge towards a decarbonised electricity
sector.
The pathway for meeting such goals does not differ significantly from those identified at a European level, but for the absence of nuclear generation, as a consequence of the Referendum in 1987, which banned nuclear production in Italy. Ministero per lo Sviluppo Economico and ENEA predicted the least cost energy technology and generation mix which would allow these long-term objectives to be fulfilled. The key conclusions are presented in [18] and illustrated in Figure 7. The projections for the global electricity generation in a Reference Scenario and the electricity generation by source in a Roadmap Scenario are shown.
Figure 7. Projections for the electricity generation in Italy by source for the Roadmap Scenario
In Figure 7, the Reference Scenario is a current policies scenario, which assumes that the Europe 2020 objectives are met, while the Roadmap Scenario is set so as to achieve 80% in GHGs emissions, as envisaged by the Energy Roadmap 2050. In line with the predictions at a European scale, also in Italy renewables will increase their share until they cover nearly the whole electricity generation in 2050. Gas-fired CCGTs currently cover most of the electricity supply. With time, their share will decrease and they will bridge the transition towards a decarbonised electricity system, while in 2050 they will serve only as backup capacity. Also coal-fired power plants, equipped with CCS, will contribute as backup capacity.
1.2.2.
Present and future role of gas-fired electricity generation in Italy
For the deep restructuring of the electricity system envisaged by the National Energy Strategy to effectively take place, it had to start as soon as possible. This is why the Italian Government put in place mechanisms for incentivising the generation from renewable sources, and fostered the penetration of renewable energy technologies into the market. Thereafter, in the last decade the generation profiles of fossil-fuel fired power plants began to shift from base- to peak-load, and they started taking up the role of bridging technology towards a decarbonised electricity system. This occurred particularly for CCGTs, because in Italy they have traditionally shared most of the installed capacity and electricity generation.This bridging role is confirmed by studies about the implications of the penetration of renewable energy technologies on the adequacy of the grid. Apart from fossil-fuel fired generation, smart grids and storage technologies could take up the role of backup for the intermittent renewables. Italy is pioneer in the diffusion of the smart grid technology, with an almost full penetration of smart meters in the residential sector [19]. However, smart grids are still prevented from turning into a solid market structure for demand response, able to contribute to the adequacy of the system, due to limited investments, scarce responsiveness of the consumers, and the absence of an integrated European market. As far as storage is concerned, the most significant source is PHS, with 7 GW installed capacity in 2013. Nonetheless, this storage is not competitive now and it is not expected to be, at least until 2020 [18]. No other technology is expected to give a relevant contribution to storage [20]. Therefore, gas-fired generation is expected to be essential for the adequacy of the electricity system at least in the medium term [16].
The shift of combined cycles towards a role of peaking and backup power plants is intensified by the overlapping of other dynamics recently occurred in the Italian electricity system. First of all, the peculiar history of the national generation portfolio plays a role. Until the early 90s the fossil-fuel fired power plants fleet in Italy consisted mainly of heavy oil-fired boilers. Since around 1990, the low prices of gas and, later on, the liberalisation of the electricity market induced companies to invest in CCGTs, either of new construction or repowered from the oil-fired power plants. Around 40 GW new thermal units were built from 1990 to 2012, making CCGTs the main generation technology in the country. With the sudden penetration of renewables since 2006, the installed thermal capacity started to be redundant. This led to substantial overcapacity of the electricity system: the available capacity in 2013 was around 78 GW (out of 130 GW globally installed), face a peak demand of 54 GW [21].
Also the trend of the final electricity consumption played a role in the recent evolution of the pattern of the electricity supply. While it increased steadily until around 2007, it started decreasing thereafter, mostly due to the financial crisis, in line with most of the European Union [13]. The trend of the final electricity consumption, as from data recorded by the Italian TSO, Terna S.p.A, is shown in Figure 8 [21].


![Figure 9. Average wholesale day-ahead prices on gas hubs in the EU. Source: [22].](https://thumb-eu.123doks.com/thumbv2/123dokorg/7499473.104383/37.892.190.754.569.852/figure-average-wholesale-day-ahead-prices-hubs-source.webp)

![Figure 14. Load ramps of different fossil-fuel fired power plants. Source: [12].](https://thumb-eu.123doks.com/thumbv2/123dokorg/7499473.104383/46.892.131.722.304.513/figure-load-ramps-different-fossil-fired-plants-source.webp)