POLITECNICO DI MILANO
Facoltà di Ingegneria
Scuola di Ingegneria Industriale e dell’Informazione
Dipartimento di Scienze e Tecnologie Aerospaziali
Corso di Laurea Magistrale in
Aeronautical Engineering
A new methodology for Risk Assessment:
validation of a weighted Risk Matrix in the analysis
of the Bird Strike event
Relatore:
PROF. ITALO ODDONE
Controrelatore:
PROF. PIETRO CARLO CACCIABUE
Tesi di Laurea Magistrale di
DANIELE ALBANESE
875483
Anno Accademico 2017-2018
2
CONTENTS
LIST OF TABLES ... 7 LIST OF FIGURES ... 12 ABSTRACT ... 13 SOMMARIO ... 14 1 INTRODUCTION ... 152 RISK ASSESSMENT ON THE BIRD STRIKE EVENT ... 23
1. IDENTIFICATION OF THE SCENARIOS ... 23
1. SCENARIO 1: BIRD STRIKE UNDER 300 FT TAKE-OFF ... 23
1.1 HAZARDS IDENTIFICATION ... 23 1.2 THREATS IDENTIFICATION ... 23 1.2.1. ESCALATING FACTORS ... 23 1.3. CONSEQUENCES IDENTIFICATION ... 24 1.3.2. MID-TERM CONSEQUENCES ... 25 1.3.3. RESULTING CONSEQUENCES ... 25
1.4 BOW TIE DIAGRAM ... 27
2. SCENARIO 2: BIRD STRIKE UNDER 300 FT LANDING ... 28
2.1 HAZARDS IDENTIFICATION ... 28 2.2 THREATS IDENTIFICATION ... 29 2.2.1. ESCALATING FACTORS... 29 2.3. CONSEQUENCES IDENTIFICATION ... 29 2.3.1. IMMEDIATE CONSEQUENCES ... 29 2.3.2. MID-TERM CONSEQUENCES ... 30 2.3.3. RESULTING CONSEQUENCES ... 30
2.4. BOW TIE DIAGRAM ... 30
3. SCENARIO 3: BIRD STRIKE OVER 300 FT ... 32
3.1. HAZARDS IDENTIFICATION ... 32 3.2.1. ESCALATING FACTORS ... 32 3.3. CONSEQUENCES IDENTIFICATION ... 33 3.3.1. IMMEDIATE CONSEQUENCES ... 33 3.3.2. MID-TERM CONSEQUENCES ... 33 3.3.3. RESULTING CONSEQUENCES ... 34
3
4. SCENARIO 4: BIRD STRIKE AND ONE ENGINE INOPERATIVE ... 37
4.1. HAZARDS IDENTIFICATION ... 37 4.2. THREATS IDENTIFICATION ... 37 4.2.1. ESCALATING FACTORS ... 38 4.3. CONSEQUENCES IDENTIFICATION ... 39 4.3.1. IMMEDIATE CONSEQUENCES ... 39 4.3.2. MID-TERM CONSEQUENCES ... 39
4.4. BOW TIE DIAGRAM ... 40
5. SCENARIO 5: BIRD STRIKE AND AIRCRAFT DAMAGE... 41
5.1. HAZARDS IDENTIFICATION ... 41 5.2. THREATS IDENTIFICATION ... 41 5.2.1. ESCALATING FACTORS ... 41 5.3. CONSEQUENCES IDENTIFICATION ... 42 5.3.1 IMMEDIATE CONSEQUENCES ... 42 5.3.2. MID-TERM CONSEQUENCES ... 42 5.3.3. RESULTING CONSEQUENCES ... 42
5.4. BOW TIE DIAGRAM ... 43
2. SEVERITY AND PROBABILITY ... 44
0. EVALUATION METHOD ... 44
0.1. THREATS, CONSEQUENCES RISK LEVEL CALCULATION ... 44
0.2. ESCALATING FACTORS RISK LEVEL CALCULATION ... 45
0.3. BARRIERS MITIGATION CALCULATION ... 46
1. SCENARIO 1: BIRD STRIKE UNDER 300 FT TAKE OFF ... 47
1.1. THREATS ... 47 1.1.1. ESCALATING FACTORS ... 47 1.2. CONSEQUENCES ... 48 1.2.1. IMMEDIATE CONSEQUENCES ... 48 1.2.2. MID-TERM CONSEQUENCES ... 49 1.2.3. RESULTING CONSEQUENCES ... 49
1.3. OVERVIEW OF SINGLE CONSEQUENCES RISK LEVEL ... 51
1.4. CHAIN OF EVENTS PROBABILITY AND SEVERITY ... 52
2. SCENARIO 2: BIRD STRIKE UNDER 300 FT LANDING ... 53
1.1. THREATS ... 53
4
2.2. CONSEQUENCES ... 54
2.2.2. MID-TERM CONSEQUENCES ... 54
2.2.3. RESULTING CONSEQUENCES ... 54
2.3. OVERVIEW OF SINGLE CONSEQUENCES RISK LEVEL ... 55
2.4. CHAIN OF EVENTS PROBABILITY AND SEVERITY ... 55
3. SCENARIO 3: BIRD STRIKES OVER 300 FT ... 57
3.1. THREATS ... 57 3.1.1. ESCALATING FACTORS ... 57 3.2. CONSEQUENCES ... 57 3.2.1. IMMEDIATE CONSEQUENCES ... 57 3.2.2. MID-TERM CONSEQUENCES ... 57 3.2.3. RESULTING CONSEQUENCES ... 58
3.3. OVERVIEW OF SINGLE CONSEQUENCES RISK LEVEL ... 58
3.4. CHAIN OF EVENTS PROBABILITY AND SEVERITY ... 59
4. SCENARIO 4: BIRD STRIKE AND ONE ENGINE INOPERATIVE ... 62
4.1. THREATS ... 62 4.1.1. ESCALATING FACTORS ... 63 4.2. CONSEQUENCES ... 64 4.2.1. IMMEDIATE CONSEQUENCES ... 64 4.2.2. MID-TERM CONSEQUENCES ... 64 4.2.3. RESULTING CONSEQUENCES ... 64
4.3. OVERVIEW OF SINGLE CONSEQUENCES RISK LEVEL ... 65
4.4. CHAIN OF EVENTS PROBABILITY AND SEVERITY ... 66
5. SCENARIO 5: BIRD STRIKE AND A/C DAMAGE ... 67
5.1. THREATS ... 67 5.1.1. ESCALATING FACTORS ... 67 5.2. CONSEQUENCES ... 67 5.2.1. IMMEDIATE CONSEQUENCES ... 67 5.2.2. MID-TERM CONSEQUENCES ... 67 5.2.3. RESULTING CONSEQUENCES ... 67
5.3. OVERVIEW OF SINGLE CONSEQUENCES RISK LEVEL ... 68
5.4. CHAIN OF EVENTS PROBABILITY AND SEVERITY ... 68
3. SAFETY BARRIERS IDENTIFICATION AND EFFECTIVENESS EVALUATION... 70
5
1.1. PREVENTIVE BARRIERS ... 70
1.2. CONSEQUENTIAL BARRIERS ... 72
1.3. RECOVERY BARRIERS ... 74
2. ALLOCATION OF BARRIERS IN EACH SCENARIO ... 75
3. RISK REDUCTION ... 77
3.1. SINGLE CONSEQUENCES RISK REDUCTION ... 77
3.1.1. SCENARIO 1: BIRD STRIKE UNDER 300 FT TAKE-OFF ... 77
3.1.2. SCENARIO 2: BIRD STRIKE UNDER 300 FT LANDING ... 79
3.1.3. SCENARIO 3: BIRD STRIKE OVER 300 FT ... 80
3.1.4. SCENARIO 4: BIRD STRIKE AND ONE ENGINE INOPERATIVE ... 81
3.1.5. SCENARIO 5: BIRD STRIKE AND A/C DAMAGE ... 82
3.2. EVENTS CHAINS RISK REDUCTION ... 83
3.2.1. SCENARIO 1: BIRD STRIKE UNDER 300 FT TAKE-OFF ... 83
3.2.1.1. THREAT TO HAZARD CHAIN RISK REDUCTION ... 83
3.2.1.2. HAZARD TO CONSEQUENCES CHAIN RISK REDUCTION ... 85
3.2.2. SCENARIO 2: BIRD STRIKE UNDER 300 FT LANDING ... 87
3.2.2.1. THREAT TO HAZARD CHAIN RISK REDUCTION ... 87
3.2.2.2. HAZARD TO CONSEQUENCES CHAIN RISK REDUCTION ... 88
3.2.3. SCENARIO 3: BIRD STRIKE OVER 300 FT ... 89
3.2.3.1. THREAT TO HAZARD CHAIN RISK REDUCTION ... 89
3.2.3.2. HAZARD TO CONSEQUENCES CHAIN RISK REDUCTION ... 92
3.2.4. SCENARIO 4: BIRD STRIKE AND ONE ENGINE INOPERATIVE ... 95
3.2.4.1. THREAT TO HAZARD CHAIN RISK REDUCTION ... 95
3.2.4.2. HAZARD TO CONSEQUENCES CHAIN RISK REDUCTION ... 96
3.2.5. SCENARIO 5: BIRD STRIKE AND A/C DAMAGE ... 97
3.2.5.1. THREAT TO HAZARD CHAIN RISK REDUCTION ... 97
3.2.5.2. HAZARD TO CONSEQUENCES CHAIN RISK REDUCTION ... 98
3 RISK MATRICES VALIDATION ... 101
1. USE OF THE MATRIX ... 108
1.1. FLIGHT CREW ... 109
1.2. MAINTENANCE STAFF ... 113
2. VALIDATION ... 117
2.1. VALIDATION PROCESSES DESCRIPTIONS ... 117
6 2.1.2. SECOND VALIDATION ... 117 2.1.3. THIRD VALIDATION ... 118 2.2. RESULTS ... 118 2.2.1 5x5 MATRIX ... 118 2.2.1.1. FIRST VALIDATION ... 118 2.2.1.2. SECOND VALIDATION ... 121 2.2.1.3. THIRD VALIDATION ... 122 2.2.2. 5x6 MATRIX ... 132 2.2.2.1. FIRST VALIDATION ... 132 2.2.2.2. SECOND VALIDATION ... 135 2.2.2.3. THIRD VALIDATION ... 136 2.3. COMMENTS ... 140 3. FURTHER VALIDATION ... 140
3.1. VALIDATION METHODS DESCRIPTION ... 141
3.1.1. FIRST VALIDATION ... 141 3.1.2. SECOND VALIDATION ... 141 3.2. VALIDATION RESULTS... 143 3.2.1. FIRST VALIDATION ... 143 3.2.1.1. CURRENT MATRIX ... 143 3.2.1.2. NEW 5x5 MATRIX ... 156 3.2.1.3. NEW 6X5 MATRIX ... 158 3.2.2. SECOND VALIDATION ... 161 3.2.2.1. 5x5 MATRIX ... 161 3.2.2.2. 6x5 MATRIX ... 164 4 CONCLUSIONS ... 168 BIBLIOGRAPHY ... 169 APPENDIX A ... 170 APPENDIX B ... 180
7
LIST OF TABLES
Table 1: Hazard scenario 1 Table 2: Threat scenario 1
Table 3: Escalating factors scenario 1
Table 4: Immediate consequences scenario 1 Table 5: Mid-term consequences scenario 1 Table 6: Resulting consequences scenario 1 Table 7: Event chains scenario 1
Table 8: Hazard scenario 2 Table 9: Threat scenario 2
Table 10: Escalating factors scenario 2
Table 11: Immediate consequences scenario 2 Table 12: Mid-term consequences scenario 2 Table 13: Resulting consequences scenario 2 Table 14: Event chains consequences scenario 2 Table 15: Hazard scenario 3
Table 16: Threat scenario 3
Table 17: Escalating factors scenario 3
Table 18: Immediate consequences scenario 3 Table 19: Mid-term consequences scenario 3 Table 20: Resulting consequences scenario 3 Table 21: Event chains scenario 3
Table 22: Hazard scenario 4 Table 23: Threat scenario 4
Table 24: Escalating factors scenario 4
Table 25: Immediate consequences scenario 4 Table 26: Mid-term consequences scenario 4 Table 27: Resulting consequences scenario 4 Table 28: Event chains scenario 4
Table 29: Hazard scenario 5 Table 30: Threat scenario 5
Table 31: Escalating Factors scenario 5
Table 32: Immediate consequences scenario 5 Table 33: Mid-term consequences scenario 5 Table 34: Resulting consequences scenario 5 Table 35: Event chains scenario 5
Table 36: Risk level event chains scenario 1 Table 37: Risk level escalating factors scenario 1
Table 38: Risk level immediate consequences scenario 1 Table 39: Risk level mid-term consequences scenario 1 Table 40: Risk level resulting consequences scenario 1 Table 41: Consequences Risk Matrix scenario 1 Table 42: Risk level event chains scenario 1 Table 43: Risk matrix scenario 1
8
Table 44: Risk level threat scenario 2
Table 45: Risk level escalating factors scenario 2
Table 46: Risk level immediate consequences scenario 2 Table 47: Risk level mid-term consequences scenario 2 Table 48: Risk level resulting consequences scenario 2 Table 49: Consequences Risk Matrix scenario 2 Table 50: Risk level event chains scenario 2 Table 51: Risk matrix scenario 2
Table 52: Risk level threat scenario 3
Table 53: Risk level escalating factors scenario 3
Table 54: Risk level immediate consequences scenario 3 Table 55: Risk level mid-term consequences scenario 3 Table 56: Risk level resulting consequences scenario 3 Table 57: Consequences Risk Matrix scenario
Table 58: Risk level event chains scenario 3 Table 59: Risk matrix scenario 3
Table 60: Risk level threat scenario 4
Table 61: Risk level escalating factors scenario 4
Table 62: Risk level immediate consequences scenario 4 Table 63: Risk level mid-term consequences scenario 4 Table 64: Risk level resulting consequences scenario 4 Table 65: Consequences Risk Matrix scenario 4 Table 66: Risk level event chains scenario 4 Table 67: Risk matrix scenario 4
Table 68: Risk level threat scenario 5
Table 69: Risk level escalating Factors scenario 5
Table 70: Risk level immediate consequences scenario 5 Table 71: Risk level mid-term consequences scenario 5 Table 72: Risk level resulting consequences scenario 5 Table 73: Consequences Risk Matrix scenario 5 Table 74: Risk level event chains scenario 5 Table 75: Risk matrix scenario 5
Table 76: Effectiveness of barriers Table 77: Preventive barriers Table 78: Consequential barriers Table 79: Recovery barriers Table 80: Barriers scenario 1 Table 81: Barriers scenario 2 Table 82: Barriers scenario 3 Table 83: Barriers scenario 4 Table 84: Barriers scenario 5
Table 85: Consequences Risk Level after mitigations scenario 1 Table 86: Consequences Risk Matrix after mitigations scenario 1 Table 87: Consequences Risk Level after mitigations scenario 2 Table 88: Consequences Risk Matrix after mitigations scenario 2 Table 89: Consequences Risk Level after mitigations scenario 3
9 Table 90: Consequences Risk Matrix after mitigations scenario 3
Table 91: Consequences Risk Level after mitigations scenario 4 Table 92: Consequences Risk Matrix after mitigations scenario 4 Table 93: Consequences Risk Level after mitigations scenario 5 Table 94: Consequences Risk Matrix after mitigations scenario 5 Table 95: Event chains first mitigation scenario 1
Table 96: Risk matrix first mitigation scenario 1 Table 97: Event chains second mitigation scenario 1 Table 98: Risk matrix second mitigation scenario 1 Table 99: Event chains first mitigation scenario 2 Table 100: Risk matrix first mitigation scenario 2 Table 101: Event chains second mitigation scenario 2 Table 102: Risk matrix second mitigation scenario 2 Table 103: Event chains first mitigation scenario 3 Table 104: Risk matrix first mitigation scenario 3 Table 105: Event chains second mitigation scenario 3 Table 106: Risk matrix second mitigation scenario 3 Table 107: Event chains first mitigation scenario 4 Table 108: Risk matrix first mitigation scenario 4 Table 109: Event chains second mitigation scenario 4 Table 110: Risk matrix second mitigation scenario 4 Table 111: Event chains first mitigation scenario 5 Table 112: Risk matrix first mitigation scenario 5 Table 113: Event chains second mitigation scenario 5 Table 114: Risk matrix second mitigation scenario 5 Table 115: Actual Risk Matrix
Table 116: Severity and Probability values 5x5 Table 117: New 5x5 Risk Matrix
Table 118: Severity and Probability values 5x6 Table 119: New 5x6 Risk Matrix
Table 120: Frequency Levels 50000 movements per year Table 121: NEOS S.p.A. Probability Levels
Table 122: Severity and Probability Levels question 1 FC Table 123: Severity Level question 2 FC
Table 124: Severity Level question 3 FC Table 125: Severity Level question 4 FC Table 126: Probability Level question 5 FC Table 127: Severity Level question 6 FC Table 128: Probability Level question 7 FC Table 129: Probability Level question 8 FC Table 130: Probability Level question 9 FC Table 131: Probability Level question 10 FC Table 132: Severity intervals FC
Table 133: 5x5 Matrix Probability intervals FC Table 134: 6x5 Matrix Probability intervals FC Table 135: Severity Level question 1 MS
10
Table 136: Severity Level question 2 MS Table 137: Probability Level question 3 MS Table 138: Probability Level question 4 MS Table 139: Probability Level question 5 MS Table 140: Severity Level question 6 MS Table 141: Severity Level question 7 MS Table 142: Severity intervals MS
Table 143: 5x5 Matrix Probability intervals MS Table 144: 6x5 Matrix Probability intervals MS Table 145: Risk Level first validation FC Table 146: Risk Matrix first validation FC Table 147: Risk Level first validation MS Table 148: Risk Matrix first validation MS Table 149: Risk Matrix first validation overall Table 150: Second validation
Table 151: Risk Matrix third validation Check-list Table 152: Risk Levels third validation
Table 153: Risk Matrix each consequences third validation Table 154: Barriers third validation
Table 155: Action of each barrier third validation
Table 156: Risk Levels after barriers mitigation third validation Table 157: Risk Matrix after barriers mitigation third validation Table 158: Risk Level first validation FC
Table 159: Risk Matrix first validation FC Table 160: Risk Level first validation MS Table 161: Risk Matrix first validation MS Table 162: Second validation
Table 163: Risk Matrix third validation Check-list Table 164: Risk Levels third validation
Table 165: Risk Matrix each consequences third validation Table 166: Risk Levels third validation
Table 167: Risk Matrix each consequences third validation Table 168: Severity Level question 1
Table 169: Severity Level question 2 Table 170: Severity Level question 3 Table 171: Severity Level question 4 Table 172: Severity intervals
Table 173: Risk Level first validation
Table 174: Risk Matrix first validation single consequences Table 175: Events chains description
Table 176: Risk Level first validation
Table 177: Risk Matrix first validation events chains Table 178: Barriers description first validation Table 179: Barriers action first validation
Table 180: Risk Level each consequences after mitigations Table 181: Risk Level events chains after mitigations
11 Table 182: Risk Matrix each consequences first validation
Table 183: Risk Matrix events chains first validation Table 184: Risk Level first validation new 5x5
Table 185: Risk Level each consequences after mitigations new 5x5 Table 186: Risk Matrix each consequences first validation new 5x5 Table 187: Risk Level first validation new 6x5
Table 188: Risk Level each consequences after mitigations new 6x5 Table 189: Risk Matrix each consequences first validation new 6x5 Table 190: Risk Level second validation new 5x5
Table 191: Risk Matrix second validation new 5x5 Table 192: Risk Level second validation new 6x5 Table 193: Risk Matrix second validation new 6x5
12
LIST OF FIGURES
Figure 1: Map of migrations
Figure 2: Bird Strikes/movements ratio
Figure 3: Month-by-month ratio Bird Strike/movements Figure 4: Bird Strikes per month
Figure 5: Bird Strikes per moment of the day Figure 6: Bird Strikes per bird species Figure 7: Bird Strikes per flight phase Figure 8: Bird Strike per altitude Figure 9: Bird Strikes per altitude Figure 10: Bird Strikes per struck part
Figure 11: Percentage of Bird Strikes with damage Figure 12: Damaged part/events with damage Figure 13: Damaged part/Bird Strikes
Figure 14: Percentage of bird ingestions when the engine was struck Figure 15: Effects on flight of Bird Strike
Figure 16: Hyperbolic distribution of the weights
Figure 17: Shift of the curve in case of a barrier on Severity Figure 18: Shift of the curve in case of a barrier on Probability
Figure 19: Shift of the curve in case of a barrier on Severity and Probability Figure 20: Example of the effectiveness of a weighted Matrix
Figure A1: Bow Tie Scenario 1 Figure A2: Bow Tie Scenario 2 Figure A3: Bow Tie Scenario 3 Figure A4: Bow Tie Scenario 4 Figure A5: Bow Tie Scenario 5
Figure A6: Bow Tie Scenario 1 with barriers Figure A7: Bow Tie Scenario 2 with barriers Figure A8: Bow Tie Scenario 3 with barriers Figure A9: Bow Tie Scenario 4 with barriers Figure A10: Bow Tie Scenario 5 with barriers Figure B1: Bow Tie Technical reports
13
ABSTRACT
The aim of this Thesis is the evaluation and the consequent validation of an effective Risk Matrix modification to be standardised within Aviation Industry. At the moment, the Risk Matrix used by any Airline is based on the matrix proposed by ICAO (International Civil Aviation Organization). The modification that is going to be validated in the Thesis has been proposed by Professors Italo Oddone and Pietro Carlo Cacciabue. Their purposes were multiple, in particular: (i) give a mathematical-based approach in the use of the matrix in order not to have ambiguity in the positioning, (ii) try to reduce the need for expert judgement in the evaluation of the Risk Level by designing objective methods for the evaluation of Probability and Severity and, finally, (iii) allow Airlines or International Organizations to make effective comparisons between Risk Levels for the same aspect, even if the considered Airlines have different number of movements and/or destinations served. This validation effort is detailed in Chapter 3 of this Thesis. The Thesis has been developed starting from a Risk Assessment on the Bird Strike issue within NEOS S.p.A. operations, which is detailed in Chapter 2. In fact, the Bird Strike is an already identified safety issue for NEOS S.p.A. and spread in Aviation Industry, thus it has been elected as a valuable starting point for this Final Thesis. It would be more correct to refer to the term Wildlife Strike, since not only birds, but also terrestrial animals living inside airports fields can interfere with Airlines’ operations. In its 16-year-long history, NEOS S.p.A. experienced several impacts with birds per year, but very few occurrences with other kinds of animals. For this reason, the Risk Assessment only focused on Bird Strikes.
To identify and locate regions concerned by the seasonal migration of birds where airports served by NEOS S.p.A. are present, a preliminary study has been performed. It is based on Ornithological and European Aviation Organizations papers, as well as data collected by NEOS S.p.A. in the period January 2016 – August 2018. Results are presented in Chapter 1.
Note: The development of the Thesis and all the related calculations have been carried out based on real data gathered from occurrences experienced during NEOS S.p.A.' operations.
In order to ensure the protection from divulgation of sensible data, property of NEOS S.p.A., all data, graphs and tables have been modified, ensuring an effective presentation in this document, congruent with the analysis carried out, but without infringing the confidentiality obligation towards the Airline.
14
SOMMARIO
Lo scopo di questa Tesi è la valutazione e la conseguente validazione di una efficace modifica della Matrice di Rischio così da essere standardizzata nell’Industria Aeronautica. Al momento, la Matrice di Rischio usata da ogni Compagnia Aerea è una elaborazione di quella proposta da ICAO (International Civil Aviation Organization). La modifica che sarà validata nella Tesi è stata ideata e proposta dai Professori Italo Oddone e Pietro Carlo Cacciabue. Le loro linee guide erano molteplici, in particolare: (i) fornire un approccio matematico nell’uso della matrice per non avere ambiguità nel posizionamento sulla stessa, (ii) cercare di ridurre la necessità e la dipendenza dal giudizio di esperti nella stima del Livello di Rischio tramite lo studio di metodi oggettivi per la valutazione di Probabilità e Severità e, infine, (iii) permettere alle Compagnie Aeree e agli Enti Internazionali di comparare in maniera efficace i Livelli di Rischio di Compagnie Aeree diverse per numero di movimenti o destinazioni servite riguardo allo stesso evento. La validazione è dettagliata nel Capitolo 3 della Tesi.
La Tesi è stata sviluppata a partire da un Documento di Valutazione del Rischio, o Risk Assessment, sul Bird Strike (l’impatto con volatili) all’interno delle operazioni di NEOS S.p.A. che è stato dettagliato nel Capitolo 2. Infatti, l’evento Bird Strike è una problematica di sicurezza per NEOS S.p.A. e ampiamente diffusa nell’Industria Aeronautica, quindi è stata scelta come un efficace punto di partenza per la Tesi in questione. Sarebbe più corretto fare riferimento al termine Wildlife Strike (l’impatto con fauna selvatica), poiché non solo volatili, ma anche fauna terrestre che vive all’interno del sedime aeroportuale può interferire con le normali operazioni di una Compagnia Aerea. Dalla sua fondazione 16 anni fa, NEOS S.p.A. ha avuto diversi Bird Strike all’anno, ma esigui con altre specie di animali. Per questo motivo, il Risk Assessment è focalizzato esclusivamente sui Bird Strike.
Per identificare le regioni interessate dalla migrazione stagionale degli uccelli e allocare gli aeroporti interessati dall’evento e serviti da NEOS S.p.A., è stato svolto uno studio preliminare basato su documenti ornitologici e di Organizzazioni Aeronautiche a livello nazionale ed Europeo, assieme ai dati raccolti da NEOS S.p.A. nel periodo Gennaio 2016 – Agosto 2018. I risultati di questa analisi sono riportati nel Capitolo 1.
Nota Bene: Lo sviluppo della Tesi e tutti i relativi calcoli sono stati effettuati utilizzando i dati reali delle occorrenze registrate durante le operazioni di NEOS S.p.A.
Dal momento che questi dati sono di proprietà di NEOS S.p.A. e di natura sensibile, in accordo all'obbligo di riservatezza nei confronti della Compagnia Aerea, tutti i dati, grafici e tabelle sono stati modificati, garantendo un'efficace presentazione nel presente documento, congruente con le analisi effettuate, ma senza infrangere tale obbligo.
15
1
INTRODUCTION
It is in birds’ nature to move, even for long distances, from a place to another to search for food or to find a suitable area and climate for their reproduction. These needs lead to the possibility of a higher concentration of animals in a restricted area, generating a dangerous environment for flight operations. Severe consequences can derive by an event of this type and they must be avoided as much as possible.
Birds can be found both at low and high altitudes, so each part of the flight can be affected by a strike. Regulations [1] state that under the altitude of 300ft, the airport is competent for the presence of birds and responsible for occurrences related to them. Moreover, the airport handler must put into action all possible operations to reduce the presence of wildlife in the area and cooperate with the local authorities to check, identify and, if necessary, close all the activities or endeavours that can attract animals and affect the airport operations. Mainly, birds fly for two reasons:
To search for food. It is usually at low altitude and in correspondence of green areas, lakes, coasts and points of interest like dumps or harbours.
To migrate from nest region to winter zone and vice versa. It is usually a high-altitude flight with a large number of birds, often of bigger size, that move together. It is focused in determined periods, mainly spring and late summer. The moment of the day is another aspect that influences the movements of birds. Ornithologists [2] assert that peak hour for birds’ activity when in search of food is the morning, especially at dawn. Their activity slightly reduces during the afternoon and it is almost null at night. On the contrary, migrant birds focus their journeys at night, except when close to the mountains, since they use hot air streams to gain altitude. Yearly, when migrating, birds follow the same path. Scientists have tracked the animals for years, producing precise maps. Focusing the attention on southern Europe, where most of NEOS S.p.A. flights are, Greece, Spain and Italy are the most affected nations.
16
Figure 1: Map of migrations
As Figure 1 shows, each route is covered by different species, each of which is differently dangerous if impacted by an airplane. The white line is the path of the Stork (Cicogna), a highly dangerous bird for its dimensions and weight. It usually flies northbound over mainland Greece during spring and southbound in September, but it can choose Greek islands to rest. The other lines are related to Swallows (Rondini) in blue, Herons (Aironi e Garze) in red and yellow. Swallows are the smallest between migrant birds and they are very light, so less dangerous than the previous species. On the other hand, Herons are bigger but lighter with respect to Storks, but equally dangerous.
A statistic for triennium January 2016 – August 2018 based on occurrences related to Bird Strikes has been performed. During this period, Neos faced 48 Bird Strikes, shared between the three years as follows.
17
Considering that NEOS S.p.A. experienced an increased number of flights per day, thanks to the introduction of two new aircraft in 2018 (B787s EI-NEO and EI-NEW), Figure 2 gives a good idea of the trend. It clearly shows that the relative index for Bird Strikes in 2018 is constant with respect to the previous year. The ratio Bird Strikes over number of flights has been chosen since, as furtherly explained later, the event occurs mostly during take-off and landing, so dividing for the hours flown is not significant. A month-by-month picture is reported in Figure 3.
Figure 3: Month-by-month ratio Bird Strike/movements
As previously stated, the presence of birds in regions served by NEOS S.p.A. is not constant during the year. Mostly, it depends on the periods in which migrant birds are present and the path that they follow. Even during the day, it is possible to show a different density of animals. This is since birds, like humans, have a daily biological cycle, in which they alternate rest and the search for food. Graphs that show these two facts are reported below.
18
Figure 5: Bird Strikes per moment of the day
Figure 4 shows that the highest concentration of birds is in summertime, when the peak of the presence of birds in Europe is. Spring is the other period for birds to move and interfere with airplanes operations. From Figure 5, it is evident that the day is the moment when animals search for food, especially in green areas of airports. The second highest percentage of Bird Strikes is at night, when birds return to nests. In this moment, some of the migrant birds choose to move, with the result of impacts, usually at higher altitudes.
The major part of the occurrences is discovered during line maintenance. At the end of each flight, Flight Crew and/or Maintenance Staff must perform a “Walk-around”, a closed path around the aircraft to control whether it is integer and ready for the following operation. If a Bird Strike occurred during the previous flight, they can spot on fuselage remains of bird, like blood or feathers, or dents. Usually, Flight Crew notice if the occurrence happened in flight. Sometimes, though, for high speeds or small dimensions of animals, they realise what happened only at this moment. In case the aircraft is not compliant to the safety standards, Maintenance Staff performs checks as per established procedures. For the same reasons, it is hard to establish the species of birds involved, as Figure 6 shows.
19
The few species recognized are aligned with the ones present in Europe, where most of NEOS S.p.A. operations are, and those mentioned in [3]. The assessment of altitude and phase where the impact occurred is hard too. In fact, the 55% of Bird Strike reports have been submitted by Maintenance Staff, so it is not possible to evaluate altitude of the impact. The others are submitted by Flight Crew. When compiling the Bird Strike Report, they have to specify altitude of the occurrence and flight speed at the moment of the impact. In order to assess the Risk Level for the Bird Strike event, the most critical situation where flying has to be identified. For this reason, the airspace has been divided into different altitude intervals. The thresholds have been chosen following these criteria:
50 ft: threshold between ILS categories 3B and 3A 100 ft: threshold between ILS categories 3A and 2
300 ft: threshold for airport authority in case of a Bird Strike 500 ft: threshold for the aircraft in visual approach to be stabilised
1000 ft: threshold for the aircraft in instrumental approach to be stabilised 19000 ft: threshold altitude between FIR and UIR in Italy
Results are presented in Figures 7, 8 and 9.
Figure 7: Bird Strikes per flight phase
20
Figure 9: Bird Strikes per speed (Kn)
Another aspect to analyse when assessing risk of a Bird Strike is the damage inflicted to the aircraft by the impact. Of course, the parts subjected to Bird Strikes are those exposed to front airflow. The statistic of the considered period (Jan 2016 – Aug 2018) indeed confirms that the struck components are the ones in front of the aircraft (windshield, nose/radome), plus wings and the engine. Engines can be analysed both in case of inlet struck by birds and in case of bird ingestion. This second case is worse, since the ingestion can damage fan or compressors blades and generate substantial damage to the power plant. Results are shown in Figures 10, 11, 12, 13, 14 and 15.
Figure 10: Bird Strikes per struck part
21
Figure 12: Damaged part/events with damage
Figure 13: Damaged part/Bird Strikes
22
Figure 15: Effects on flight of Bird Strike
From the statistic, it turns out that most of the occurrences are without damage to the aircraft and, if the damage occurs, it is not severe, and it does not affect the normal continuation of the flight.
23
2
RISK ASSESSMENT ON THE BIRD STRIKE EVENT
Basing on the previous statistics and considerations, five different scenarios have been developed, considering Bird Strike as the hazard first (scenarios 1, 2 and 3) and then as the threat (scenarios 4 and 5).
1. IDENTIFICATION OF THE SCENARIOS
1. SCENARIO 1: BIRD STRIKE UNDER 300 FT TAKE-OFF
1.1 HAZARDS IDENTIFICATION
The hazard identified during the chain of events review process is listed in the following table.
Hazard ID Description
H-1 Bird Strike
Table 1: Hazard scenario 1
Detailed description is provided as follows.
H-1 Bird Strike
Birds are present during every operation and the possibility of an impact cannot be deleted. A Bird Strike has the potential to cause a reduction of ability to perform the flight and to generate dangerous operational conditions.
1.2 THREATS IDENTIFICATION
The hazard identified during the chain of events review process is listed in the following table.
Threat ID Description
T-1 Airport in an urban environment or coastline
Table 2: Threat scenario 1
Detailed description is provided as follows.
T-1 Airport in an urban environment or coastline
Almost each of the airports in which NEOS S.P.A. S.p.A. operates (86%) is characterised by the proximity to a big city or sea. In the first case, the airport is seen by birds as the only possible hunting area, since urban environment is interrupted by airport fields. In the second option, coastline hosts a high number of bird species that can interfere with the normal operations of the aerodrome.
1.2.1. ESCALATING FACTORS
Although threatened by a single, major condition, each chain of events leading to the hazard could be boosted by undesirable contributing, or escalating, factors. Those perturbation to the system cannot be considered as real threats, because they do not possess the potential to generate the hazard by themselves. However, if combined to the threatening condition, they could escalate the hazard development and thus they shall be mitigated. Escalating Factors are presented in the following table.
24
Escalating Factors ID Description
EF-1 Landfill or waste disposal
EF-2 Poor conservation of green areas
EF-3 Seasonal migration
EF-4 Poor management of airport food courts waste
EF-5 Lack of wildlife control at the airport
Table 3: Escalating factors scenario 1
Detailed description is provided as follows.
EF-1 Landfill or waste disposal
They are a huge point of interest for birds, since they can find much food. They are very dangerous for flight operations, since very big flocks of animals are present at the same time flying around it continuously.
EF-2 Poor conservation of green areas
Another factor that can attract many birds. When the grass is too tall, it can host small animals or insects that are preys for birds. Moreover, during the cutting process, all this fauna moves, representing another reason for birds to come.
EF-3 Seasonal migration
This aspect has been furtherly developed in Chapter 1.
EF-4 Poor management of airport food courts waste
As well as escalating factor EF-1, any kind of waste is a source of food for birds, especially the ones which are used to live in urban environment. Often, food courts employees leave waste in plastic bags outside airport main building, attracting animals.
EF-5 Lack of wildlife control at the airport
As regulation ADR.OPS.B.020 related AMC states [4], each airport needs a Wildlife Control Unit to monitor the presence of fauna inside airport competence area. This unit is useful to reduce the impact on normal operations of flights. It is worth noting that this rule is applicable in EASA environment only.
1.3. CONSEQUENCES IDENTIFICATION
The event tree development of cause-action is various and not easy to be described. Then, consequences have been identified according to three subsequent levels: Immediate, Mid-term and Resulting. Their detailed description follows.
1.3.1. IMMEDIATE CONSEQUENCES
Immediate consequences are listed in table below. Immediate
consequences ID
Description
CI-1 Loss of situational awareness
CI-2 A/C damage
CI-3 Engine in-flight shut down
25
Detailed description is provided as follows.
CI-1 Loss of situational awareness
The lack for pilots of the awareness of what is happening inside and outside the aircraft is a great problem that has to be avoided. In general, they are trained to know exactly what to do and foresee what will happen in every situation. An impact on the windshield, for example, can provoke a temporary loss of situational awareness, considering the high speed at which operations are performed.
CI-2 A/C damage
An operational state that has to be avoided from both the safety and economical point of view. Several shades of damage can happen after a Bird Strike with different severity.
CI-3 Engine in-flight shut down
This event is typical of an engine bird ingestion. In this case, the animal hits fan blades and some of their pieces are sucked by the compressors and ruin the core engine. Its control system detects the anomaly and shuts it down. The consequences can be serious, both economical and for safety.
1.3.2. MID-TERM CONSEQUENCES
Mid-term consequences are listed in table below. Mid-term consequences ID Description
CM-1 Runway excursion
CM-2 Rejected take off
CM-3 Loss of control in-flight
Table 5: Mid-term consequences scenario 1
Detailed description is provided as follows.
CM-1 Runway excursion
An excursion from runway is a major occurrence that can occur in case of a Bird Strike during take-off run. Especially when at high speed, leaving the runway for grass can procure serious damage to aircraft systems.
CM-2 Rejected take-off
This occurrence is much less dangerous than the previous, since is the interruption of the acceleration in case of necessity. When a Bird Strike occurs in the early stage of the run, acceleration is blocked and the aircraft returns to the apron for a safety check.
CM-3 Loss of control in-flight
Very dangerous situation that can follow an engine shut down. In this scenario, pilots are no more able to control the aircraft that falls. A Bird Strike is hardly able to provoke an occurrence like this, but it can generate from an immediate consequence of an impact, like an engine shut down.
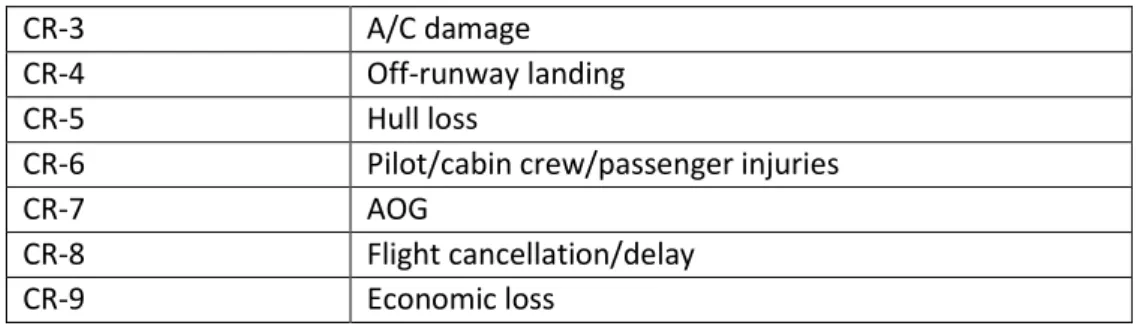
1.3.3. RESULTING CONSEQUENCES
26
Resulting consequences ID Description
CR-1 Hull loss
CR-2 Pilot/cabin crew/passenger injuries
CR-3 A/C damage CR-4 AOG CR-5 Emergency landing/diversion CR-6 Uncontrolled descent CR-7 Flight cancellation/delay CR-8 Unstabilised approach CR-9 Runway excursion CR-10 Off-runway landing CR-11 Economic loss
Table 6: Resulting consequences scenario 1
Detailed description is provided as follows. In case of previously mentioned items, their description is not reported again.
CR-1 Hull loss
The complete loss of the aircraft due to too severe damage. It is a resulting consequence since a Bird Strike cannot directly produce such a damage, but the series of following events can lead to this catastrophic event.
CR-2 Pilot/cabin crew/passenger injuries
Like the previous consequence, it derives from the series of event that can occur after a Bird Strike. Pilots and crew members are used to deal with emergencies, passengers can panic and can injure themselves whilst evacuating the aircraft. Injuries can also occur as the consequence of a runway excursion.
CR-4 AOG
The temporary stop of the operations for an aircraft due to maintenance issues can derive from a Bird Strike. Recovery period on ground has to be as short as possible to limit the economic impact.
CR-5 Emergency landing/diversion
It is the typical procedure in case of an emergency: cruise is left and a rapid descent towards the alternate, the closest airport or the departure aerodrome is performed.
CR-6 Uncontrolled descent
Following the loss of control, the aircraft falls for gravity without any possibility of recovery by the pilots. It is a catastrophic event that needs to be avoided.
CR-7 Flight cancellation/delay
Following a Bird Strike, maintenance checks or reparations can last longer than turnaround time, leading to a delay or cancellation of the following movement and the need for passengers reprotection.
27
CR-8 Unstabilised approach
A Bird Strike can damage pivotal components for aircraft balance, like a control surface or the engine. For this reason, approach phase becomes riskier.
CR-10 Off-runway landing
When the aircraft is performing an emergency landing, in case an alternate airport is too far to be reached, the only chance is to land on the ground or sea. It is a highly risk manoeuvre and the consequences can be catastrophic.
CR-11 Economic loss
As a consequence of anything that can happen outside the foreseen and scheduled timeline of events, extra costs are present. This loss of earnings can affect the stability of the airline.
1.4 BOW TIE DIAGRAM
In order to clarify the described Threat-Hazard-Consequences chains, Bow Tie diagram approach has been chosen. The Bow Tie diagram referred to the current scenario is reported in Appendix A, Figure A1. However, for calculation purpose, single chains have been identified and formalized as per table below.
Chain ID Threat Escalating factors Hazard Immediate consequences Mid-term consequences Resulting consequences Ch-1 T-1 EF-1/EF-2/EF-3/EF-4/EF-5 H-1 CI-1 CM-1 CR-1/CR-11 Ch-2 T-1 EF-1/EF-2/EF-3/EF-4/EF-5 H-1 CI-1 CM-1 CR-1/CR-7/CR-11 Ch-3 T-1 EF-1/EF-2/EF-3/EF-4/EF-5 H-1 CI-1 CM-1 CR-2/CR-7/CR-11 Ch-4 T-1 EF-1/EF-2/EF-3/EF-4/EF-5 H-1 CI-1 CM-1 CR-3/CR-7/CR-11 Ch-5 T-1 EF-1/EF-2/EF-3/EF-4/EF-5 H-1 CI-1 CM-1 CR-3/CR-11 Ch-6 T-1 EF-1/EF-2/EF-3/EF-4/EF-5 H-1 CI-2 CM-2 CR-4/CR-7/CR-11 Ch-7 T-1 EF-1/EF-2/EF-3/EF-4/EF-5 H-1 CI-2 CM-2 CR-7/CR-11 Ch-8 T-1 EF-1/EF-2/EF-3/EF-4/EF-5 H-1 CI-3 - CR-5/CR-8/CR-4/CR-11 Ch-9 T-1 EF-1/EF-2/EF-3/EF-4/EF-5 H-1 CI-3 - CR-5/CR-8/CR-7/CR-11 Ch-10 T-1 EF-1/EF-2/EF-3/EF-4/EF-5 H-1 CI-3 - CR-5/CR-8/CR-1/CR-11 Ch-11 T-1 EF-1/EF-2/EF-3/EF-4/EF-5 H-1 CI-3 - CR-5/CR-9/CR-4/CR-11 Ch-12 T-1 EF-1/EF-2/EF-3/EF-4/EF-5 H-1 CI-3 - CR-5/CR-9/CR-7/CR-11
28 Ch-13 T-1 EF-1/EF-2/EF-3/EF-4/EF-5 H-1 CI-3 - CR-5/CR-9/CR-1/CR-11 Ch-14 T-1 EF-1/EF-2/EF-3/EF-4/EF-5 H-1 CI-3 - CR-5/CR-9/CR-2/CR-11 Ch-15 T-1 EF-1/EF-2/EF-3/EF-4/EF-5 H-1 CI-3 - CR-5/CR-3/CR-4/CR-11 Ch-16 T-1 EF-1/EF-2/EF-3/EF-4/EF-5 H-1 CI-3 - CR-5/CR-3/CR-7/CR-11 Ch-17 T-1 EF-1/EF-2/EF-3/EF-4/EF-5 H-1 CI-3 - CR-5/CR-3/CR-1/CR-11 Ch-18 T-1 EF-1/EF-2/EF-3/EF-4/EF-5 H-1 CI-3 - CR-5/CR-3/CR-2/CR-11 Ch-19 T-1 EF-1/EF-2/EF-3/EF-4/EF-5 H-1 CI-3 CM-3 CR-5/CR-8/CR-4/CR-11 Ch-20 T-1 EF-1/EF-2/EF-3/EF-4/EF-5 H-1 CI-3 CM-3 CR-5/CR-8/CR-7/CR-11 Ch-21 T-1 EF-1/EF-2/EF-3/EF-4/EF-5 H-1 CI-3 CM-3 CR-5/CR-8/CR-1/CR-11 Ch-22 T-1 EF-1/EF-2/EF-3/EF-4/EF-5 H-1 CI-3 CM-3 CR-5/CR-9/CR-4/CR-11 Ch-23 T-1 EF-1/EF-2/EF-3/EF-4/EF-5 H-1 CI-3 CM-3 CR-5/CR-9/CR-7/CR-11 Ch-24 T-1 EF-1/EF-2/EF-3/EF-4/EF-5 H-1 CI-3 CM-3 CR-5/CR-9/CR-1/CR-11 Ch-25 T-1 EF-1/EF-2/EF-3/EF-4/EF-5 H-1 CI-3 CM-3 CR-5/CR-9/CR-2/CR-11 Ch-26 T-1 EF-1/EF-2/EF-3/EF-4/EF-5 H-1 CI-3 CM-3 CR-5/CR-3/CR-4/CR-11 Ch-27 T-1 EF-1/EF-2/EF-3/EF-4/EF-5 H-1 CI-3 CM-3 CR-5/CR-3/CR-7/CR-11 Ch-28 T-1 EF-1/EF-2/EF-3/EF-4/EF-5 H-1 CI-3 CM-3 CR-5/CR-3/CR-1/CR-11 Ch-29 T-1 EF-1/EF-2/EF-3/EF-4/EF-5 H-1 CI-3 CM-3 CR-5/CR-3/CR-2/CR-11 Ch-30 T-1 EF-1/EF-2/EF-3/EF-4/EF-5 H-1 CI-3 CM-3 CR-6/CR-10/CR-1/CR-11 Ch-31 T-1 EF-1/EF-2/EF-3/EF-4/EF-5 H-1 CI-3 CM-3 CR-6/CR-10/CR-2/CR-11
Table 7: Event chains scenario 1
2. SCENARIO 2: BIRD STRIKE UNDER 300 FT LANDING
2.1 HAZARDS IDENTIFICATION
The hazard identified during the chain of events review process is listed in the following table.
29
Hazard ID Description
H-1 Bird Strike
Table 8: Hazard scenario 2
Detailed description is provided in paragraph 1.1.
2.2 THREATS IDENTIFICATION
The identified hazard is threatened by some conditions. A summary is presented in the following table.
Threat ID Description
T-1 Airport in an urban environment or coastline
Table 9: Threat scenario 2
Detailed description is provided in paragraph 1.2. 2.2.1. ESCALATING FACTORS
Although threatened by a single, major condition, each chain of events leading to the hazard could be boosted by undesirable contributing, or escalating, factors. Those perturbation to the system cannot be considered as real threats, because they do not possess the potential to generate the hazard by themselves. However, if combined to the threatening condition, they could escalate the hazard development and thus they shall be mitigated. Escalating Factors are presented in the following table.
Escalating factor ID Description
EF-1 Landfill or waste disposal
EF-2 Poor conservation of green areas
EF-3 Seasonal migration
EF-4 Poor management of airport food courts waste EF-5 Lack of wildlife control at the airport
Table 10: Escalating factors scenario 2
Detailed description is provided in paragraph 1.2.1.
2.3. CONSEQUENCES IDENTIFICATION
The event tree development of cause-action is various and not easy to be described. Consequences have been identified according to three subsequent levels: Immediate, Mid-term and Resulting. Their detailed description follows.
2.3.1. IMMEDIATE CONSEQUENCES
Immediate consequences are listed in table below. Immediate
consequences ID
Description
CI-1 Loss of situational awareness
CI-2 A/C damage
CI-3 Engine in-flight shut down
30
Detailed description is provided in paragraph 1.3.1. 2.3.2. MID-TERM CONSEQUENCES
Mid-term consequences are listed in table below. Mid-term
consequences ID
Description
CM-1 Runway excursion
CM-2 AOG
CM-3 Loss of control in-flight
Table 12: Mid-term consequences scenario 2
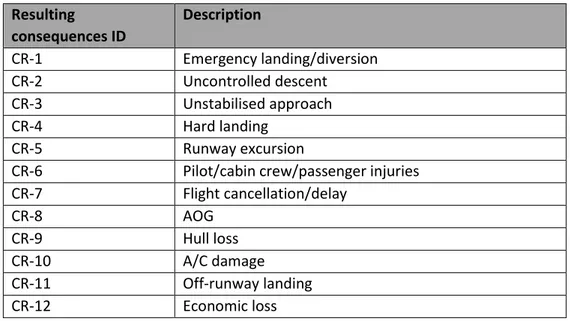
Detailed description is provided in paragraph 1.3.2. 2.3.3. RESULTING CONSEQUENCES
Resulting consequences are listed in table below. Resulting
consequences ID
Description
CR-1 Hull loss
CR-2 Pilot/cabin crew/passenger injuries
CR-3 A/C damage CR-4 Flight cancellation/delay CR-5 Emergency landing/diversion CR-6 Uncontrolled descent CR-7 Economic loss CR-8 Unstabilised approach CR-9 Runway excursion CR-10 Off-runway landing CR-11 AOG
Table 13: Resulting consequences scenario 2
Detailed description is provided in paragraph 1.3.3.
2.4. BOW TIE DIAGRAM
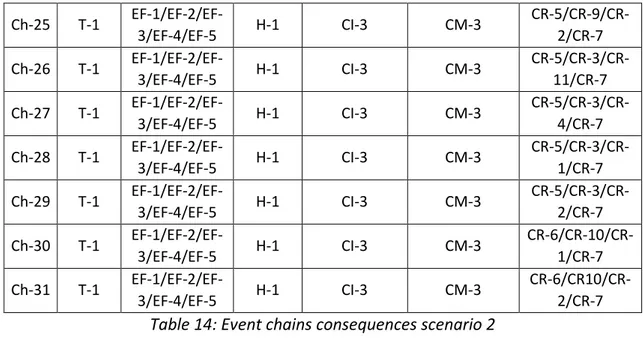
In order to clarify the described Threat-Hazard-Consequences chains, Bow Tie diagram approach has been chosen. The Bow Tie diagram referred to the current scenario is reported in Appendix A, Figure A2. However, for calculation purpose, single chains have been identified and formalized as per table below.
Chain ID Threat Escalating factors Hazard Immediate consequences Mid-term consequences Resulting consequences Ch-1 T-1 EF-1/EF-2/EF-3/EF-4/EF-5 H-1 CI-1 CM-1 CR-1/CR-7 Ch-2 T-1 EF-1/EF-2/EF-3/EF-4/EF-5 H-1 CI-1 CM-1 CR-1/CR-4/CR-7
31 Ch-3 T-1 EF-1/EF-2/EF-3/EF-4/EF-5 H-1 CI-1 CM-1 CR-2/CR-4/CR-7 Ch-4 T-1 EF-1/EF-2/EF-3/EF-4/EF-5 H-1 CI-1 CM-1 CR-3/CR-4/CR-7 Ch-5 T-1 EF-1/EF-2/EF-3/EF-4/EF-5 H-1 CI-1 CM-1 CR-3/CR-7 Ch-6 T-1 EF-1/EF-2/EF-3/EF-4/EF-5 H-1 CI-2 CM-2 CR-4/CR-7 Ch-7 T-1 EF-1/EF-2/EF-3/EF-4/EF-5 H-1 CI-2 - CR-4/CR-7 Ch-8 T-1 EF-1/EF-2/EF-3/EF-4/EF-5 H-1 CI-3 - CR-5/CR-8/CR-11/CR-7 Ch-9 T-1 EF-1/EF-2/EF-3/EF-4/EF-5 H-1 CI-3 - CR-5/CR-8/CR-4/CR-7 Ch-10 T-1 EF-1/EF-2/EF-3/EF-4/EF-5 H-1 CI-3 - CR-5/CR-8/CR-1/CR-7 Ch-11 T-1 EF-1/EF-2/EF-3/EF-4/EF-5 H-1 CI-3 - CR-5/CR-9/CR-11/CR-7 Ch-12 T-1 EF-1/EF-2/EF-3/EF-4/EF-5 H-1 CI-3 - CR-5/CR-9/CR-4/CR-7 Ch-13 T-1 EF-1/EF-2/EF-3/EF-4/EF-5 H-1 CI-3 - CR-5/CR-9/CR-1/CR-7 Ch-14 T-1 EF-1/EF-2/EF-3/EF-4/EF-5 H-1 CI-3 - CR-5/CR-9/CR-2/CR-7 Ch-15 T-1 EF-1/EF-2/EF-3/EF-4/EF-5 H-1 CI-3 - CR-5/CR-3/CR-11/CR-7 Ch-16 T-1 EF-1/EF-2/EF-3/EF-4/EF-5 H-1 CI-3 - CR-5/CR-3/CR-4/CR-7 Ch-17 T-1 EF-1/EF-2/EF-3/EF-4/EF-5 H-1 CI-3 - CR-5/CR-3/CR-1/CR-7 Ch-18 T-1 EF-1/EF-2/EF-3/EF-4/EF-5 H-1 CI-3 - CR-5/CR-3/CR-2/CR-7 Ch-19 T-1 EF-1/EF-2/EF-3/EF-4/EF-5 H-1 CI-3 CM-3 CR-5/CR-8/CR-11/CR-7 Ch-20 T-1 EF-1/EF-2/EF-3/EF-4/EF-5 H-1 CI-3 CM-3 CR-5/CR-8/CR-4/CR-7 Ch-21 T-1 EF-1/EF-2/EF-3/EF-4/EF-5 H-1 CI-3 CM-3 CR-5/CR-8/CR-1/CR-7 Ch-22 T-1 EF-1/EF-2/EF-3/EF-4/EF-5 H-1 CI-3 CM-3 CR-5/CR-9/CR-11/CR-7 Ch-23 T-1 EF-1/EF-2/EF-3/EF-4/EF-5 H-1 CI-3 CM-3 CR-5/CR-9/CR-4/CR-7 Ch-24 T-1 EF-1/EF-2/EF-3/EF-4/EF-5 H-1 CI-3 CM-3 CR-5/CR-9/CR-1/CR-7
32 Ch-25 T-1 EF-1/EF-2/EF-3/EF-4/EF-5 H-1 CI-3 CM-3 CR-5/CR-9/CR-2/CR-7 Ch-26 T-1 EF-1/EF-2/EF-3/EF-4/EF-5 H-1 CI-3 CM-3 CR-5/CR-3/CR-11/CR-7 Ch-27 T-1 EF-1/EF-2/EF-3/EF-4/EF-5 H-1 CI-3 CM-3 CR-5/CR-3/CR-4/CR-7 Ch-28 T-1 EF-1/EF-2/EF-3/EF-4/EF-5 H-1 CI-3 CM-3 CR-5/CR-3/CR-1/CR-7 Ch-29 T-1 EF-1/EF-2/EF-3/EF-4/EF-5 H-1 CI-3 CM-3 CR-5/CR-3/CR-2/CR-7 Ch-30 T-1 EF-1/EF-2/EF-3/EF-4/EF-5 H-1 CI-3 CM-3 CR-6/CR-10/CR-1/CR-7 Ch-31 T-1 EF-1/EF-2/EF-3/EF-4/EF-5 H-1 CI-3 CM-3 CR-6/CR10/CR-2/CR-7
Table 14: Event chains consequences scenario 2
3. SCENARIO 3: BIRD STRIKE OVER 300 FT
3.1. HAZARDS IDENTIFICATION
The hazard identified during the chain of events review process is listed in the following table.
Hazard ID Description
H-1 Bird Strike
Table 15: Hazard scenario 3
Detailed description is provided in paragraph 1.1. 3.2. THREATS IDENTIFICATION
The identified hazard is threatened by some conditions. A summary is presented in the following table.
Threat ID Description
T-1 Airport in an urban environment or coastline
Table 16: Threat scenario 3
Detailed description is provided in paragraph 1.2. 3.2.1. ESCALATING FACTORS
Although threatened by a single, major condition, each chain of events leading to the hazard could be boosted by undesirable contributing, or escalating, factors. Those perturbation to the system cannot be considered as real threats, because they do not possess the potential to generate the hazard by themselves. However, if combined to the threatening condition, they could escalate the hazard development and thus they shall be mitigated. Escalating Factors are presented in the following table.
Escalating factor ID Description
EF-1 Landfill or waste disposal
33
EF-3 Seasonal migration
Table 17: Escalating factors scenario 3
Detailed description is provided in paragraph 1.2.1.
3.3. CONSEQUENCES IDENTIFICATION
The event tree development of cause-action is various and not easy to be described. Consequences have been identified according to three subsequent levels: Immediate, Mid-term and Resulting. Their detailed description follows.
3.3.1. IMMEDIATE CONSEQUENCES
Immediate consequences are listed in table below. Immediate
consequences ID
Description
CI-1 Engine in-flight shut down
CI-2 A/C damage
CI-3 Emergency landing/diversion
CI-4 Precautional landing
Table 18: Immediate consequences scenario 3
Detailed description is provided as follows. In case of previously mentioned items, their description is not reported again.
CI-4 Precautional landing
In this case, the scenario is slightly different from the previous, since the reason of the diversion is not necessarily an emergency in action. It is usually performed towards an alternate airport where the airline has maintenance. Pilots decide to do a precautional landing after a Bird Strike when flight parameters are normal but they assume that a damage is present, or in case they are not usual but they refer to non-fundamental components. In any case, when an emergency landing is not necessary.
3.3.2. MID-TERM CONSEQUENCES
Mid-term consequences are listed in table below. Mid-term
consequences ID
Description
CM-1 Loss of control in-flight
CM-2 Emergency landing/diversion CM-3 Precautional landing CM-4 Unstabilised approach CM-5 Hard landing CM-6 Runway excursion CM-7 A/C damage
Table 19: Mid-term consequences scenario 3
Detailed description is provided as follows. In case of previously mentioned items, their description is not reported again.
34
CM-5 Hard landing
When the aircraft reaches the ground with a too high vertical speed, due to windshear or controlling issues. This can cause structural damage and injuries to people on board. Related to Bird Strikes, this event can happen when important control surfaces are struck and damaged by the animal, so a proper balance of forces and moments is no more possible.
3.3.3. RESULTING CONSEQUENCES
Resulting consequences are listed in table below. Resulting consequences ID Description CR-1 Emergency landing/diversion CR-2 Uncontrolled descent CR-3 Unstabilised approach CR-4 Hard landing CR-5 Runway excursion
CR-6 Pilot/cabin crew/passenger injuries
CR-7 Flight cancellation/delay CR-8 AOG CR-9 Hull loss CR-10 A/C damage CR-11 Off-runway landing CR-12 Economic loss
Table 20: Resulting consequences scenario 3
Detailed description is provided in paragraph 1.3.
3.4. BOW TIE DIAGRAM
In order to clarify the described Threat-Hazard-Consequences chains, Bow Tie diagram approach has been chosen. The Bow Tie diagram referred to the current scenario is reported in Appendix A, Figure A3. However, for calculation purpose, single chains have been identified and formalized as per table below.
Chain ID Threat Escalating factors Hazard Immediate consequences Mid-term consequences Resulting consequences Ch-1 T-1 EF-1/EF-2/EF-3 H-1 CI-1 - CR-1/CR-3/CR-8/CR-12 Ch-2 T-1 EF-1/EF-2/EF-3 H-1 CI-1 - CR-1/CR-3/CR-7/CR-12 Ch-3 T-1 EF-1/EF-2/EF-3 H-1 CI-1 - CR-1/CR-3/CR-9/CR-12 Ch-4 T-1 EF-1/EF-2/EF-3 H-1 CI-1 - CR-1/CR-5/CR-8/CR-12 Ch-5 T-1 EF-1/EF-2/EF-3 H-1 CI-1 - CR-1/CR-5/CR-7/CR-12
35 Ch-6 T-1 EF-1/EF-2/EF-3 H-1 CI-1 - CR-1/CR-5/CR-9/CR-12 Ch-7 T-1 EF-1/EF-2/EF-3 H-1 CI-1 - CR-1/CR-5/CR-6/CR-12 Ch-8 T-1 EF-1/EF-2/EF-3 H-1 CI-1 - CR-1/CR-10/CR-8/CR-12 Ch-9 T-1 EF-1/EF-2/EF-3 H-1 CI-1 - CR-1/CR-10/CR-7/CR-12 Ch-10 T-1 EF-1/EF-2/EF-3 H-1 CI-1 - CR-1/CR-10/CR-9/CR-12 Ch-11 T-1 EF-1/EF-2/EF-3 H-1 CI-1 - CR-1/CR-10/CR-6/CR-12 Ch-12 T-1 EF-1/EF-2/EF-3 H-1 CI-1 CM-1 CR-1/CR-3/CR-8/CR-12 Ch-13 T-1 EF-1/EF-2/EF-3 H-1 CI-1 CM-1 CR-1/CR-3/CR-7/CR-12 Ch-14 T-1 EF-1/EF-2/EF-3 H-1 CI-1 CM-1 CR-1/CR-3/CR-9/CR-12 Ch-15 T-1 EF-1/EF-2/EF-3 H-1 CI-1 CM-1 CR-1/CR-5/CR-8/CR-12 Ch-16 T-1 EF-1/EF-2/EF-3 H-1 CI-1 CM-1 CR-1/CR-5/CR-7/CR-12 Ch-17 T-1 EF-1/EF-2/EF-3 H-1 CI-1 CM-1 CR-1/CR-5/CR-9/CR-12 Ch-18 T-1 EF-1/EF-2/EF-3 H-1 CI-1 CM-1 CR-1/CR-5/CR-6/CR-12 Ch-19 T-1 EF-1/EF-2/EF-3 H-1 CI-1 CM-1 CR-1/CR-10/CR-8/CR-12 Ch-20 T-1 EF-1/EF-2/EF-3 H-1 CI-1 CM-1 CR-1/CR-10/CR-7/CR-12 Ch-21 T-1 EF-1/EF-2/EF-3 H-1 CI-1 CM-1 CR-1/CR-10/CR-9/CR-12 Ch-22 T-1 EF-1/EF-2/EF-3 H-1 CI-1 CM-1 CR-1/CR-10/CR-6/CR-12 Ch-23 T-1 EF-1/EF-2/EF-3 H-1 CI-1 CM-1 CR-2/CR-11/CR-9/CR-12 Ch-24 T-1 EF-1/EF-2/EF-3 H-1 CI-1 CM-1 CR-2/CR-11/CR-6/CR-12 Ch-25 T-1 EF-1/EF-2/EF-3 H-1 CI-2 CM-1 CR-1/CR-3/CR-8/CR-12 Ch-26 T-1 EF-1/EF-2/EF-3 H-1 CI-2 CM-1 CR-1/CR-3/CR-7/CR-12 Ch-27 T-1 EF-1/EF-2/EF-3 H-1 CI-2 CM-1 CR-1/CR-3/CR-9/CR-12
36 Ch-28 T-1 EF-1/EF-2/EF-3 H-1 CI-2 CM-1 CR-1/CR-5/CR-8/CR-12 Ch-29 T-1 EF-1/EF-2/EF-3 H-1 CI-2 CM-1 CR-1/CR-5/CR-7/CR-12 Ch-30 T-1 EF-1/EF-2/EF-3 H-1 CI-2 CM-1 CR-1/CR-5/CR-9/CR-12 Ch-31 T-1 EF-1/EF-2/EF-3 H-1 CI-2 CM-1 CR-1/CR-5/CR-6/CR-12 Ch-32 T-1 EF-1/EF-2/EF-3 H-1 CI-2 CM-1 CR-1/CR-10/CR-8/CR-12 Ch-33 T-1 EF-1/EF-2/EF-3 H-1 CI-2 CM-1 CR-1/CR-10/CR-7/CR-12 Ch-34 T-1 EF-1/EF-2/EF-3 H-1 CI-2 CM-1 CR-1/CR-10/CR-9/CR-12 Ch-35 T-1 EF-1/EF-2/EF-3 H-1 CI-2 CM-1 CR-1/CR-10/CR-6/CR-12 Ch-36 T-1 EF-1/EF-2/EF-3 H-1 CI-2 CM-1 CR-2/CR-11/CR-9/CR-12 Ch-37 T-1 EF-1/EF-2/EF-3 H-1 CI-2 CM-1 CR-2/CR-11/CR-6/CR-12 Ch-38 T-1 EF-1/EF-2/EF-3 H-1 CI-2 CM-2 CR-3/CR-9/CR-12 Ch-39 T-1 EF-1/EF-2/EF-3 H-1 CI-2 CM-2 CR-3/CR-8/CR-12 Ch-40 T-1 EF-1/EF-2/EF-3 H-1 CI-2 CM-2 CR-3/CR-7/CR-12 Ch-41 T-1 EF-1/EF-2/EF-3 H-1 CI-2 CM-2 CR-4/CR-9/CR-12 Ch-42 T-1 EF-1/EF-2/EF-3 H-1 CI-2 CM-2 CR-4/CR-8/CR-12 Ch-43 T-1 EF-1/EF-2/EF-3 H-1 CI-2 CM-2 CR-4/CR-7/CR-12 Ch-44 T-1 EF-1/EF-2/EF-3 H-1 CI-2 CM-2 CR-5/CR-9/CR-12 Ch-45 T-1 EF-1/EF-2/EF-3 H-1 CI-2 CM-2 CR-5/CR-8/CR-12 Ch-46 T-1 EF-1/EF-2/EF-3 H-1 CI-2 CM-2 CR-5/CR-7/CR-12 Ch-47 T-1 EF-1/EF-2/EF-3 H-1 CI-2 CM-3 CR-3/CR-9/CR-12 Ch-48 T-1 EF-1/EF-2/EF-3 H-1 CI-2 CM-3 CR-3/CR-8/CR-12 Ch-49 T-1 EF-1/EF-2/EF-3 H-1 CI-2 CM-3 CR-3/CR-7/CR-12 Ch-50 T-1 EF-1/EF-2/EF-3 H-1 CI-2 CM-3 CR-4/CR-9/CR-12 Ch-51 T-1 EF-1/EF-2/EF-3 H-1 CI-2 CM-3 CR-4/CR-8/CR-12 Ch-52 T-1 EF-1/EF-2/EF-3 H-1 CI-2 CM-3 CR-4/CR-7/CR-12 Ch-53 T-1 EF-1/EF-2/EF-3 H-1 CI-2 CM-3 CR-5/CR-9/CR-12 Ch-54 T-1 EF-1/EF-2/EF-3 H-1 CI-2 CM-3 CR-5/CR-8/CR-12 Ch-55 T-1 EF-1/EF-2/EF-3 H-1 CI-2 CM-3 CR-5/CR-7/CR-12 Ch-56 T-1 EF-1/EF-2/EF-3 H-1 CI-3 CM-1 CR-2/CR-11/CR-6/CR-12 Ch-57 T-1 EF-1/EF-2/EF-3 H-1 CI-3 CM-1 CR-2/CR-11/CR-9/CR-12 Ch-58 T-1 EF-1/EF-2/EF-3 H-1 CI-3 CM-4 CR-9/CR-12 Ch-59 T-1 EF-1/EF-2/EF-3 H-1 CI-3 CM-4 CR-8/CR-12 Ch-60 T-1 EF-1/EF-2/EF-3 H-1 CI-3 CM-4 CR-7/CR-12
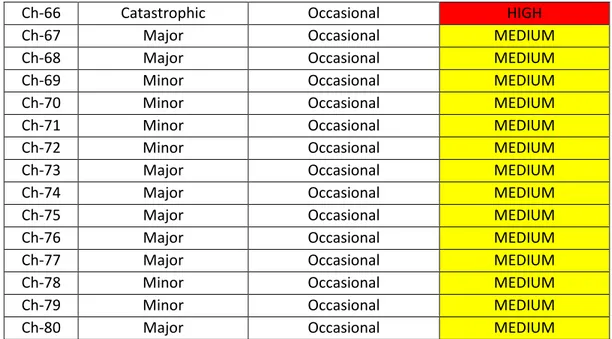
37 Ch-61 T-1 EF-1/EF-2/EF-3 H-1 CI-3 CM-5 CR-9/CR-12 Ch-62 T-1 EF-1/EF-2/EF-3 H-1 CI-3 CM-5 CR-8/CR-12 Ch-63 T-1 EF-1/EF-2/EF-3 H-1 CI-3 CM-5 CR-7/CR-12 Ch-64 T-1 EF-1/EF-2/EF-3 H-1 CI-3 CM-5 CR-6/CR-12 Ch-65 T-1 EF-1/EF-2/EF-3 H-1 CI-3 CM-6 CR-9/CR-12 Ch-66 T-1 EF-1/EF-2/EF-3 H-1 CI-3 CM-6 CR-8/CR-12 Ch-67 T-1 EF-1/EF-2/EF-3 H-1 CI-3 CM-6 CR-7/CR-12 Ch-68 T-1 EF-1/EF-2/EF-3 H-1 CI-3 CM-6 CR-6/CR-12 Ch-69 T-1 EF-1/EF-2/EF-3 H-1 CI-4 - CR-7/CR-12 Ch-70 T-1 EF-1/EF-2/EF-3 H-1 CI-4 CM-5 CR-6/CR-12 Ch-71 T-1 EF-1/EF-2/EF-3 H-1 CI-4 CM-5 CR-7/CR-12 Ch-72 T-1 EF-1/EF-2/EF-3 H-1 CI-4 CM-5 CR-8/CR-12 Ch-73 T-1 EF-1/EF-2/EF-3 H-1 CI-4 CM-5 CR-9/CR-12 Ch-74 T-1 EF-1/EF-2/EF-3 H-1 CI-4 CM-6 CR-6/CR-12 Ch-75 T-1 EF-1/EF-2/EF-3 H-1 CI-4 CM-6 CR-7/CR-12 Ch-76 T-1 EF-1/EF-2/EF-3 H-1 CI-4 CM-6 CR-8/CR-12 Ch-77 T-1 EF-1/EF-2/EF-3 H-1 CI-4 CM-6 CR-9/CR-12 Ch-78 T-1 EF-1/EF-2/EF-3 H-1 CI-4 CM-7 CR-7/CR-12 Ch-79 T-1 EF-1/EF-2/EF-3 H-1 CI-4 CM-7 CR-8/CR-12 Ch-80 T-1 EF-1/EF-2/EF-3 H-1 CI-4 CM-7 CR-9/CR-12
Table 21: Event chains scenario 3
4. SCENARIO 4: BIRD STRIKE AND ONE ENGINE INOPERATIVE
4.1. HAZARDS IDENTIFICATION
The hazard identified during the chain of events review process is listed in the following table.
Hazard ID Description
H-1 One engine inoperative
Table 22: Hazard scenario 4
Detailed description is provided as follows.
H-1 One engine inoperative
It is a peculiar state of the system, which is characterised by the absence of thrust from one engine. It can be accidental, caused e.g. from a malfunction of some components, or desired, as a precautional action in case an improper parameter is noted by pilots. Aircraft are certified to fly in this condition, but it is not a desired state.
4.2. THREATS IDENTIFICATION
The identified hazard is threatened by some conditions. A summary is presented in the following table.
Threat ID Description
T-1 Bird Strike
38
Detailed description is provided in chapter 1.1. 4.2.1. ESCALATING FACTORS
Although threatened by a single, major condition, each chain of events leading to the hazard could be boosted by undesirable contributing, or escalating, factors. Those perturbation to the system cannot be considered as real threats, because they do not possess the potential to generate the hazard by themselves. However, if combined to the threatening condition, they could escalate the hazard development and thus they shall be mitigated. Escalating Factors are presented in the following table.
Escalating factor ID Description
EF-1 PF under pressure due to the emergency
EF-2 Airport staff not able to cope with the emergency
EF-3 Night-time
EF-4 Adverse weather conditions
EF-5 Airport usually not served by the airline
Table 24: Escalating factors scenario 4
Detailed description is provided as follows.
EF-1 PF under pressure due to the emergency
Even if, during training at the simulator, pilots are educated to deal with these scenarios, a real emergency can be a tough issue to face, leading to the possibility to make the wrong choice or to act in an unreasonable way.
EF-2 Airport staff not able to cope with the emergency
Even if airport staff must have certified experience in dealing with emergencies, especially in remote zones, like Africa or Asia, this could not be assured. This event could happen with a higher probability in summertime, when temporary contract workers are employed by airports to face the higher traffic.
EF-3 Night-time
Apart from the natural tiredness that a night shift can produce, it can worsen the consequences of an emergency, since the dark reduces the situational awareness that has to be maximal in an emergency.
EF-4 Adverse weather conditions
The adverse weather is not a significant problem in a normal operational environment. It can become a risky situation in case of an emergency, since aircraft control can become a tough issue.
EF-5 Airport usually not served by the airline
In case of an emergency, a familiar environment can help coping with these issues. Moreover, an already served airport is easier for a rapid recovery from the occurrence.
39
4.3. CONSEQUENCES IDENTIFICATION
The event tree development of cause-action is various and not easy to be described. Consequences have been identified according to three subsequent levels: Immediate, Mid-term and Resulting. Their detailed description follows.
4.3.1. IMMEDIATE CONSEQUENCES
Immediate consequences are listed in table below. Immediate
consequences ID
Description
CI-1 Emergency landing/diversion
CI-2 Controlled flight into terrain
Table 25: Immediate consequences scenario 4
Detailed description is provided as follows. In case of previously mentioned items, their description is not reported again.
CI-2 Controlled flight into terrain
Catastrophic event in which the flying crew does not realise the imminent impact. This lead to the total loss of aircraft, crew and passengers.
4.3.2. MID-TERM CONSEQUENCES
Mid-term consequences are listed in table below. Mid-term consequences ID Description CM-1 Runway excursion CM-2 Hard landing CM-3 AOG
Table 26: Mid-term consequences scenario 4
Detailed description is provided in paragraph 1.3.3. 3.3.1. RESULTING CONSEQUENCES
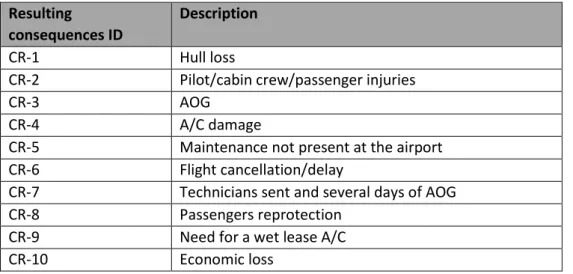
Resulting consequences are listed in table below. Resulting
consequences ID
Description
CR-1 Hull loss
CR-2 Pilot/cabin crew/passenger injuries
CR-3 AOG
CR-4 A/C damage
CR-5 Maintenance not present at the airport
CR-6 Flight cancellation/delay
CR-7 Technicians sent and several days of AOG
CR-8 Passengers reprotection
CR-9 Need for a wet lease A/C
CR-10 Economic loss
40
Detailed description is provided as follows. In case of previously mentioned items, their description is not reported again.
CR-5 Maintenance not present at the airport
In case a Bird Strike lead to a diversion, pilots decide the airport where land. Especially if it is a long-haul flight, e.g. in Africa or Asia, the presence of technicians to repair the aircraft is not ensured.
CR-7 Technician sent and several days of AOG
The previous consequence leads to the necessity to send maintenance staff from home base or the closest airport in which the airline has technicians, worsening the effects of the diversion on passengers.
CR-8 Passengers reprotection
In case of a prolonged maintenance check time or of an AOG (very frequent in case of an AOG), the airline must consider many actions to bring passengers to their planned destination.
CR-9 Need for a wet lease A/C
In case of an AOG and if none of the aircrafts in fleet is available to collect passengers where they are, the airline needs to temporarily rent another airplane to do it.
4.4. BOW TIE DIAGRAM
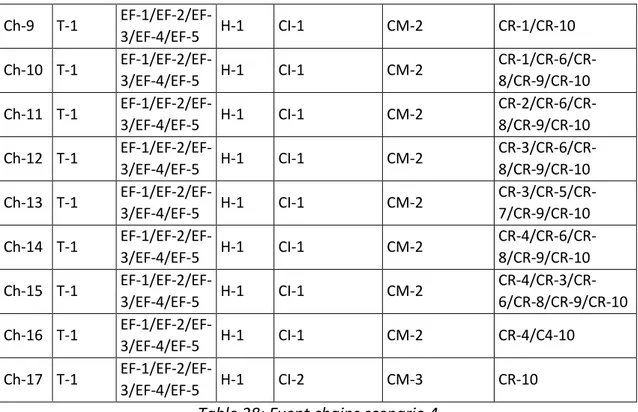
In order to clarify the described Threat-Hazard-Consequences chains, Bow Tie diagram approach has been chosen. The Bow Tie diagram referred to the current scenario is reported in Appendix A, Figure A4. However, for calculation purpose, single chains have been identified and formalized as per table below.
Chain ID Threat Escalating factors Hazard Immediate consequences Mid-term consequences Resulting consequences Ch-1 T-1 EF-1/EF-2/EF-3/EF-4/EF-5 H-1 CI-1 CM-1 CR-1/CR-10 Ch-2 T-1 EF-1/EF-2/EF-3/EF-4/EF-5 H-1 CI-1 CM-1 CR-1/CR-6/CR-8/CR-9/CR-10 Ch-3 T-1 EF-1/EF-2/EF-3/EF-4/EF-5 H-1 CI-1 CM-1 CR-2/CR-6/CR-8/CR-9/CR-10 Ch-4 T-1 EF-1/EF-2/EF-3/EF-4/EF-5 H-1 CI-1 CM-1 CR-3/CR-6/CR-8/CR-9/CR-10 Ch-5 T-1 EF-1/EF-2/EF-3/EF-4/EF-5 H-1 CI-1 CM-1 CR-3/CR-5/CR-7/CR-9/CR-10 Ch-6 T-1 EF-1/EF-2/EF-3/EF-4/EF-5 H-1 CI-1 CM-1 CR-4/CR-6/CR-8/CR-9/CR-10 Ch-7 T-1 EF-1/EF-2/EF-3/EF-4/EF-5 H-1 CI-1 CM-1 CR-4/CR-3/CR-6/CR-8/CR-9/CR-10 Ch-8 T-1 EF-1/EF-2/EF-3/EF-4/EF-5 H-1 CI-1 CM-1 CR-4/C4-10
41 Ch-9 T-1 EF-1/EF-2/EF-3/EF-4/EF-5 H-1 CI-1 CM-2 CR-1/CR-10 Ch-10 T-1 EF-1/EF-2/EF-3/EF-4/EF-5 H-1 CI-1 CM-2 CR-1/CR-6/CR-8/CR-9/CR-10 Ch-11 T-1 EF-1/EF-2/EF-3/EF-4/EF-5 H-1 CI-1 CM-2 CR-2/CR-6/CR-8/CR-9/CR-10 Ch-12 T-1 EF-1/EF-2/EF-3/EF-4/EF-5 H-1 CI-1 CM-2 CR-3/CR-6/CR-8/CR-9/CR-10 Ch-13 T-1 EF-1/EF-2/EF-3/EF-4/EF-5 H-1 CI-1 CM-2 CR-3/CR-5/CR-7/CR-9/CR-10 Ch-14 T-1 EF-1/EF-2/EF-3/EF-4/EF-5 H-1 CI-1 CM-2 CR-4/CR-6/CR-8/CR-9/CR-10 Ch-15 T-1 EF-1/EF-2/EF-3/EF-4/EF-5 H-1 CI-1 CM-2 CR-4/CR-3/CR-6/CR-8/CR-9/CR-10 Ch-16 T-1 EF-1/EF-2/EF-3/EF-4/EF-5 H-1 CI-1 CM-2 CR-4/C4-10 Ch-17 T-1 EF-1/EF-2/EF-3/EF-4/EF-5 H-1 CI-2 CM-3 CR-10
Table 28: Event chains scenario 4
5. SCENARIO 5: BIRD STRIKE AND AIRCRAFT DAMAGE
5.1. HAZARDS IDENTIFICATION
The hazard identified during the chain of events review process is listed in the following table.
Hazard ID Description
H-1 Aircraft damage
Table 29: Hazard scenario 5
Detailed description is provided as follows.
H-1 Aircraft damage
It is an operative condition in which the aircraft presents one or more components in a non-conventional state. It can affect the capability of flying and usually leads to an emergency.
5.2. THREATS IDENTIFICATION
The identified hazard is threatened by some conditions. A summary is presented in the following table.
Threat ID Description
T-1 Bird Strike
Table 30: Threat scenario 5
Detailed description is provided in chapter 1.1. 5.2.1. ESCALATING FACTORS
Although threatened by a single, major condition, each chain of events leading to the hazard could be boosted by undesirable contributing, or escalating, factors. Those
42
perturbation to the system cannot be considered as real threats, because they do not possess the potential to generate the hazard by themselves. However, if combined to the threatening condition, they could escalate the hazard development and thus they shall be mitigated. Escalating Factors are presented in the following table.
Escalating factor ID Description
EF-1 PF under pressure due to the emergency
EF-2 Night-time
EF-3 Adverse weather conditions
Table 31: Escalating Factors scenario 5
Detailed description is provided in chapter 4.2.1.
5.3. CONSEQUENCES IDENTIFICATION
Consequences have been identified according to three subsequent levels: Immediate, Mid-term and Resulting. Their detailed description follows.
5.3.1 IMMEDIATE CONSEQUENCES
Immediate consequences are listed in table below. Immediate
consequences ID
Description
CI-1 Loss of control in-flight
CI-2 Emergency landing/diversion
CI-3 Precautional landing
Table 32: Immediate consequences scenario 5
Detailed description is provided in chapters 1.3.1 and 1.3.2. 5.3.2. MID-TERM CONSEQUENCES
Mid-term consequences are listed in table below. Mid-term consequences ID Description CM-1 Emergency landing/diversion CM-2 Uncontrolled descent CM-3 Unstabilised approach CM-4 Hard landing CM-5 Runway excursion
Table 33: Mid-term consequences scenario 5
Detailed description is provided in chapter 1.3. 5.3.3. RESULTING CONSEQUENCES
Resulting consequences are listed in table below. Resulting
consequences ID
Description
CR-1 Unstabilised approach