A
LMA
M
ATER
S
TUDIORUM
·
U
NIVERSITÀ
DI
B
OLOGNA
Scuola di Scienze
Corso di Laurea Magistrale in Fisica
DEVELOPMENT OF A FLUORESCENT-BASED
SINGLE LIPOSOME ASSAY FOR STUDYING
CALCIUM TRANSPORTER LMCA1
Relatore:
Presentata da:
Prof. Gastone Castellani
Alessandro Guarnieri
Correlatore:
Prof. Dimitrios Stamou
Sessione: III
1
Acknowledgements
The experiments of this work were carried out in the Bio-nanotechnology and Biomedicine Laboratory under the supervision of Prof. Dimitrios Stamou. I would like to thank first Dimitrios for letting me be part of this research for the preparation of the thesis of my degree in Applied Physics. I would like to thank also my Italian supervisor Prof. Gastone Castellani who let me carry out the experiments of my thesis in a foreign country. It is a pleasure to thank my daily supervisor Mads P. Møller for introducing me to the laboratory and for supervising me throughout the entire project with a big amount of patience, professionalism and constant availability. I am thankful also to Garima Ghale for different tips and meaningful discussions along the way. I would like to thank all the members of the “transporter team” and I would also like to acknowledge Artù Breuer and Samuel Walsh for helping me to solve issues with the TIRF microscope and for advising me about Matlab programming. I am grateful to all the members of Stamou Lab for letting me see how you “make science” but also for all the fun moments. It was also a great opportunity to grow up as a person.
Thanks also for the big support from my family in Italy and from my international friends I met in Copenhagen.
2
Abstract
The morphological and functional unit of all the living organisms is the cell. The transmembrane proteins, localized in the plasma membrane of cells, play a key role in the survival of the cells themselves. These proteins perform a variety of different tasks, for example the control of the homeostasis. In order to control the homeostasis, these proteins have to regulate the concentration of chemical elements, like ions, inside and outside the cell. These regulations are fundamental for the survival of the cell and to understand them we need to understand how transmembrane proteins work. Two of the most important categories of transmembrane proteins are ion channels and transporter proteins. The ion channels have been depth studied at the single molecule level since late 1970s with the development of patch-clamp technique. It is not possible to apply this technique to study the transporter proteins so a new technique is under development in order to investigate the behavior of transporter proteins at the single molecule level.
This thesis describes the development of a nanoscale single liposome assay for functional studies of transporter proteins based on quantitative fluorescence microscopy in a highly-parallel manner and in real time. The transporter of interest is the prokaryotic transporter Listeria Monocytogenes Ca2+-ATPase1 (LMCA1), a
structural analogue of the eukaryotic calcium pumps SERCA and PMCA. This technique will allow the characterization of LMCA1 functionality at the single molecule level. Three systematically characterized fluorescent sensors were tested at the single liposome scale in order to investigate if their properties are suitable to study the function of the transporter of interest. Further studies will be needed in order to characterize the selected calcium sensor and pH sensor both implemented together in single liposomes and in presence of the reconstituted protein LMCA1.
3
Sommario
L'unità morfologica e funzionale di tutti gli organismi viventi è la cellula. Le proteine transmembrana, localizzate nella membrana plasmatica delle cellule, svolgono un ruolo chiave per la sopravvivenza delle cellule stesse. Le funzioni svolte da queste proteine sono diverse, una delle più importanti è il controllo dell’omeostasi. Al fine di svolgere questo compito, tali proteine devono regolare la concentrazione di elementi chimici, quali ioni, all'interno e all'esterno della cellula. Questo tipo di processi di regolazione, fondamentali per la sopravvivenza della cellula, può essere compreso dallo studio funzionale delle proteine transmembrana. Due dei maggiori sottogruppi di proteine transmembrana sono rappresentati dai canali ionici e dalle proteine di trasporto. I canali ionici sono stati profondamente studiati a livello di singola molecola dalla fine degli anni settanta del novecento, grazie allo sviluppo della tecnica del patch-clamp. Tale tecnica non ha avuto successo per lo studio delle proteine di trasporto, così una nuova tecnica è in fase di sviluppo al fine di studiare il comportamento delle proteine di trasporto a livello di singola molecola.
Questa tesi descrive lo sviluppo di un assay nanometrico a liposoma singolo per lo studio funzionale delle proteine di trasporto. Tale assay è basato sulla microscopia a fluorescenza quantitativa e permette delle analisi in tempo reale e altamente parallelizzate. La proteina di nostro interesse è Listeria monocytogenes Ca2+-ATPase1
(LMCA1), un analogo strutturale delle pompe eucariotiche del calcio SERCA e PMCA. Questa tecnica permette la caratterizzazione delle funzioni di LMCA1 a livello di singola molecola. Tre sensori fluorescenti caratterizzati sistematicamente sono stati testati con l’assay a liposoma singolo per verificare se le loro proprietà fossero adatte allo studio della proteina di trasporto d’interesse. Ulteriori studi saranno necessari per la caratterizzazione dei sensori di calcio e pH selezionati attraverso l’implementazione contemporanea degli stessi in liposomi e in presenza della proteina ricostituita LMCA1.
Contents
4
2 Introduction 7
2.1 Biological membranes and transmembrane proteins 7
2.2 Ion channels and transporter proteins 8
2.3 Methods for studying ion channels and transporters 10
2.4 Transporter of interest: Listeria Monocytogenes Ca2+-ATPase 1 12
3 Single liposomes activity assay 13
3.1 Potentials of an assay based on single liposomes 14
3.2 Single liposome assay coupled with fluorescence techniques 15
3.3 Single liposome activity assay for LMCA1 16
4 Experimental setup and apparatus 18
4.1 Preparation of liposomes 18
4.1.1 Snarf-DOPE containing liposomes 18
4.1.2 Oregon Green Bapta-5N containing liposomes 19
4.2 Spectrofluorometric measurements 19
4.2.1 Snarf-DOPE - Spectrofluorometric measurements 20
4.2.2 Oregon Green Bapta-5N - Spectrofluorometric measurements 20
4.3 Preparation of flow cells 21
4.4 TIRF microscopy 22
4.4.1 Snarf-DOPE - TIRF microscopy measurements 22
4.4.2 Oregon Green Bapta-5N - TIRF microscopy measurements 23
4.4.3 Fluo-5N -TIRF microscopy measurements 23
4.5 Image analysis 25
5 Data analysis and results 27
5.1 Characterization of Snarf-DOPE for single liposome assay 27
5.1.1 Bulk characterization 27
5.1.2 Single liposome level characterization 28
5.1.3 Summary of properties of Snarf-DOPE 32
5.2 Characterization of Oregon Green Bapta-5N for single liposome assay 33
5.2.1 Single liposomes level characterization 34
5.2.2 Summary of properties of Oregon Green Bapta-5N 36
5.3 Characterization of Fluo-5N for single liposome assay 37
5.3.1 Single liposomes level characterization 37
5.3.2 Summary of properties of Fluo-5N 44
6 Conclusions and outlook 45
5
8 Appendix 51
A Materials 51
B Additional properties of liposomes containing Fluo-5N and ATTO655 53
C Spectrometric measurements of Oregon Green Bapta-2 in bulk 57
D Shift of the pKa of Snarf-DOPE 59
1 List of abbreviations
6
CCCP Carbonyl Cyanide m-Chlorophenyl Hydrazone DTT Dithiothreitol
FRET Förster Resonance Energy Transfer
LMCA1 Listeria monocytogenes Calcium ATPase 1 LUVs Large Unilamellar Vesicles
MLV Multi Lamellar Vesicles ND Neutral density (filter)
PLL-g-PEG Poly-L-lysine-grafted poly-ethylene-glycol PMCA Plasma Membrane Ca2+-ATPase
SERCA Sarco(Endo)plasmic Reticulum Ca2+-ATPase SUVs Small Unilamellar Vesicles
TIRF Total Internal Reflection Fluorescence
2 Introduction
In this thesis the characteristics and the aims of the fluorescent-based single liposome assay that is under development for functional studies of the calcium-proton antiporter LMCA1 at the single molecule level are explained. In the introduction section it is given an insight on the important role of membranes in biology with a
7
focus on homeostasis regulation (Section 2.1) and on the proteins that allow this regulation (Section 2.2). The most important assays and methods for studying ion channels and transporter proteins are explored (Section 2.3) and the transporter protein of interest is described (Section 2.4).
In chapter 3 the general feature of the single liposome assay is presented, focusing on the potentials given by exploiting liposomes (Section 3.1) and fluorescence probes (Section 3.2) in the assay. Finally the characteristics of the assay for studying LMCA1 at the single molecule level are described (Section 3.3).
In chapter 4 the experimental setup is described. The liposome preparation and the preparation of the support surfaces (flow cells) are explained (Section 4.1 and 4.3) and the experimental setups for spectrofluorometric experiments and TIRF microscopy experiments are shown (Section 4.2 and 4.4). In the last section the image analysis procedure is summarized (Section 4.5).
The experimental analysis and the results are presented in chapter 5, in which the characterization is divided by type of fluorophore implemented in the single liposome assay. In each section it was first presented the analysis of average emitted signal by all the liposomes and then the focus was shifted to analysis of signal emitted by individual liposomes.
In the last chapters 6 and 7 conclusions and future perspectives of this research can be found. List of materials and additional figures can be found in Appendix.
2.1 Biological membranes and transmembrane proteins
Cells are separated from the external environment by a plasma membrane. This membrane consists of amphipathic phospholipid molecules that form a phospholipid bilayer, where the polar heads of these molecules separate the hydrophobic coupled tails from the aqueous cytosolic and extracellular environments. This lipid bilayer forms a barrier that is relatively impermeable to most water-soluble molecules and it creates disequilibrium. This disequilibrium is fundamental for the cell to perform all the chemical reactions that are needed to convert the provided energy into a usable form and to fulfill the tasks necessary for survival. Even though the plasma membrane is impermeable, the cells are open thermodynamic systems, which mean they can exchange matter and energy with the external environment across the plasma membrane. In order to communicate with the outside environment, a number of transmembrane proteins are embedded in the bilayer.[1]
Transmembrane proteins have three regions or domains that can be defined: the domain into the bilayer, the extracellular domain outside the cell and the intracellular domain inside the cell. Even though a cell membrane is somewhat fluid, the orientation of transmembrane proteins does not change. These proteins play several roles in the functioning of cells. Receptors are useful for signaling to the cell what the
8
external environment contains. Linkers connect adjacent cells together by membrane junctions or anchor cells to extracellular matrix. Ion channels and transporter proteins are associated with controlling the exchange of materials across the membrane, allowing or preventing the passage of molecules or ions.[2,3]
2.2 Ion channels and transporter proteins
Ion channels let ions pass through the membrane according to the electrochemical gradient generated by a different concentration of ions inside and outside with respect to the cell membrane. Ion channels differ from porins located into the outer membrane of bacteria, mitochondria or chloroplasts as the latter are relatively large (their diameter can be approximately between 14 and 26 Å in the case of chloroplasts)[4a] and less selective compared with ion channel (their diameter can go
down to 5 Å)[4b]. It is actually the selectivity the main difference between ion channels
and porins. Due to the presence of a selectivity filter inside the structure of the channels, they are able to let pass only particular ions through the membrane with a transport rate 105 times greater than the fastest rate mediated by any known
transporter protein. Another important distinction between ion channels and porins is that ion channels are gated. This means they are not constantly opened but they alternate opened states to closed states. Mostly the gate opens in response to a specific stimulus, for example a change in the voltage across the membrane, mechanical stress and binding of a ligand or of a neurotransmitter.[4c] When a stimulus
happens, it modulate the macroscopic ionic conductances by influencing the probability that the single channels will be in their open state, not by modulating the single channel conductance. As a result the response of a single channel to repeated stimuli is still stochastic but if a large population is analyzed the response can be predictable. [5]
Figure 1 Cross section of opened or closed state of an ion channel. Here, a cross section of a channel
protein is shown. It forms a hydrophilic pore across the lipid bilayer only in the “open” conformational state. Polar groups are aligned along the wall of the pore, while hydrophobic amino acid side chains interact with the lipid bilayer (not shown). In the opened conformation, the selectivity filter narrows to atomic dimensions in one region (the selectivity filter), where the ion selectivity of the channel is largely determined. (Molecular Biology of the Cell. 4th edition - Alberts B, Johnson A, Lewis J, et al. New York: Garland Science; 2002).
9
Transporter proteins have a function similar to that of ion channels. They bind specific solutes and transfer them across the lipid bilayer by undergoing conformational changes. One of the differences between ion channels and transporter proteins is the fact that transporters can carry a solute not only “downhill” following the electrochemical gradient but also “uphill” against the electrochemical gradient, using energy provided by ATP hydrolysis, by a downhill flow of another solute (such as Na+
or H+) or by light. The passage of the solute through the membrane by transporter
proteins is based on different steps: the solute molecule binds to the transporter, the transporter undergoes conformational changes and finally the molecule is free to leave the transporter on the other side of the membrane. Since the passage of solutes depends on conformational changes of the transporter, the rate of transport goes from 100 to 104 ions or molecules per second, much slower compared to the one of ion
channels.[4d]The transporters that carry solutes “downhill” can be called carriers while
the ones that carry the solutes “uphill” using an extra source of energy can be called pumps. [4c]
Figure 2 Three ways of driving active transport. “The actively transported molecule is shown
in yellow, and the energy source is shown in red”. (Molecular Biology of the Cell. 4th edition - Alberts B, Johnson A, Lewis J, et al. New York: Garland Science; 2002.)
2.3 Methods for studying ion channels and transporters
Ion channels are involved in a variety of fundamental physiological processes and represent a class of attractive drug target. Many techniques and assays were developed for studying ion channels. Nowadays ion channels can be studied in bulk and at the single molecule level in a high throughput manner and the available techniques are able to provide pharmacologically relevant data. [6,7] High throughput
screening methods include ligand binding assay, flux-based assay, fluorescence-based assay, and automated electrophysiological assay. [8,9]
The first technique that allowed an insight on the behavior of single ion channel is the patch-clamp technique, developed by Neher and Sakmann (1976). This method is based on the electric isolation of a membrane’s patch from the external solution and
10
on the resolution of currents through single ion channels. A glass micropipette filled with electrolyte is sealed on the plasma membrane of a cell where ion channels are located. The glass pipette represents the recording electrode and another electrode is put into the bath around the cell as a reference ground electrode, as it is shown in Figure 3. Since the diameter of the pipette’s tip is of the order of micrometers, the number of ion channels inside the patch is very small and it is possible to reach diameters that can select just one single channel. The recorded current flow represents the current that passes through the ion channels.[10] As it is possible to see
from Figure 4, the difference of current between opened and closed state can be around 5 pA and the noise is relatively low.
Figure 3 Example of a patch-clamp circuit. A high gain operational amplifier is connected to the circuit
so that the current flowing through the ion channel is measured as a voltage drop across the resistor Rf.
The resistance of Rf should be near 50 GΩ in order to decrease the noise. (Patch clamp techniques for
single channel and whole-cell recording - DAVID OGDEN and PETER STANFIELD).
Figure 4 Examples of data recorded from patch clamp experiment. The current that flows through
single channel molecules can be recorded using the patch-clamp method. The opening and closing of the gate produces two distinct current levels: a background-current when the gate is closed and a larger current when the gate is open. The probability that the gate opens depends on the control mechanism, for example in a chemically controlled channel on the concentration of the ligand. The data in the figure show rat skeletal neuromuscular junction single channel activated by acetylcholine. (Patch clamp techniques for single channel and whole-cell recording; DAVID OGDEN and PETER STANFIELD)
11
The conventional patch clamp technique was improved in order to have higher throughput and experimental conditions that could decrease the systematic error so new patch clamp techniques were developed, such as planar or lateral patch clamp.[11]
Furthermore the technique was coupled with fluorescence assays that allow to have an insight on the intracellular side of channels and to directly investigate conformational changes and ionic currents across the membranes.[12,13,14]
On the other hand, transporter proteins play important physiologic roles such as nutrient uptake, secretion of proteins or signal molecules, exclusion of waste or exogenous compounds and energy transduction. As it is for ion channels, different techniques were developed in order to describe their properties. The patch-clamp technique was also used to study transporters at the single molecule level but the signal to noise ratio was too low due to the low transport rate of these proteins. It was only possible to notice “channels-like” behaviors on the analyzed transporters. [15,16]
The three most commonly used membrane assays for studying the large family of ABC transporters are the nucleotide trapping assay, the ATPase assay and the vesicular transport assay.[17]
The nucleotide trapping assay indirectly measures the rate of transport measuring the amount of nucleotide trapped in the binding site of the transporter. Usually the catalytic cycle of transport and the ATP hydrolysis involve the formation of a transition state complex. This complex contains the occluded nucleotide in the nucleotide binding site, which can be stabilized using trapping agents. This is not an high throughput method and it is mostly used to have an insight into the molecular mechanism of the transport process.[17]
The ATPase assay is based on the principle that compounds interacting with the transporter modulate ATPase activity of the latter. This assay indirectly measures the activity of the transporters measuring the amount of inorganic phosphate released by the enzyme during the ATP hydrolysis.[18a] The ATPase assay is one of the most widely used screening tools in the pharmaceutical industry. One of the problems of this assay is related to the fact that some compounds are translocated very slowly by the transporter, which results in a slow rate of ATP hydrolysis that do not yield detectable amount of inorganic phosphate.[17]
The vesicular assay measures the substrate carried into vesicles which have the ATP binding site and the substrate binding site of the transporter facing the buffer outside. Substrates of the transporter are taken up into the vesicles and the quantity of the transported molecules can be determined by different techniques after rapid filtration of the vesicles from the incubation solution. This assay type has the advantage of measuring the actual disposition of the substrate across the biological membrane but it works only for compounds with a low permeability to the vesicles’ membrane.[17]
All the previously explained assays for studying transporters are not focusing on the single molecules but give information on an ensemble of transporter molecules. On the one hand it can be interesting to study emergent properties of ensembles as for
12
example the ones characterized by organized complexity because it is known that these properties arise as an interaction among smaller or simpler parts that do not exhibit such properties.[18b] On the other hand the average signal that comes from an
ensemble of transporter proteins is characterized by an indistinguishable overlapping series of events and it is necessary to have a single molecule approach in order to discover a certain behavior that could be masked.[19]
In the recent years different single molecule assays were developed for studying transporter proteins at the single molecule level. Atomic force microscopy was used to probe topology, conformational changes and initial substrate-carrier interactions of Na+-glucose co-transporter (SGLT1) in living cells on a single-molecule level.[20] In
another research, molecular transporters of the cell-penetrating-peptide (CPP) type were studied. The transporter was fluorescently labeled and the interaction of the molecule with the plasma membrane of Chinese Hamster Ovary (CHO) cells was imaged.[21] Also other recent researches developed liposomes-based arrays for rapid
and massively parallel single-molecule studies of activity of transporters.[22,23]
2.4 Transporter of interest: Listeria Monocytogenes Ca
2+ATPase 1
The assay that is under development aims to characterize the calcium pump LMCA1 found in the pathogenic bacterium Listeria Monocytogenes. Listeria Monocytogenes is a gram-positive facultative intracellular pathogen and a leading cause of listeriosis with high mortality rates (~30%). The organism survives diverse conditions such as low temperature, low pH and high salt concentrations.[24] The homeostasis of this
bacterium, as it happens for other prokaryotes and also eukaryotes, is kept by membrane pumps. In particular LMCA1 maintains the intracellular Ca2+ concentration
in the μM range. This pump belongs to the subgroup II of the P-type ATPase family, it shares a 38% sequence identity with SERCA and a 29% sequence identity with PMCA.[25] Since LMCA1 shares part of the sequence with SERCA, it can be considered
its homologue. As it is possible to see from Figure 5, the pH optimum of LMCA1 is around 9 and the calcium affinity of LMCA1 is in the μM range. LMCA1 is an antiporter: it carries calcium ions out of the cell and it carries protons inside, with a stoichiometry of 1 Ca2+ : 1 H+ per ATP hydrolyzed.[26]
13
Figure 5 Activity of LMCA1 as a function of pH or calcium concentration.
A) ATPase activity of LMCA1 and SERCA1a (dashed line) as a function of pH. B) ATPase activity of LMCA1 as a function of Ca2+ concentration measured at pH 7.5. [26]
It is important to investigate calcium pumps for their role both in bacteria and humans. Calcium is one of the most important carriers of information for virtually all processes important to cell life, both for eukaryotic and prokaryotic cells. It has been seen that different pathologic conditions can be related to a dysfunction on the regulation of calcium concentration.[27] In particular the cardiac SERCA2a, an isoform of SERCA,
regulates the calcium concentration in the heart muscles and it has a crucial role in contraction-relaxation processes of the heart. A decrease in expression level of this pump can lead to a variety of pathological conditions. [28,29,30]
3 Single liposome activity assay
In order to study the function of LMCA1 at the single molecule level, a fluorescent-based single liposome assay is being developed exploiting the possibilities given by liposomes coupled with fluorescent techniques, which make use of fluorophores sensitive to the substrate translocated by the pump itself.
3.1 Potentials of an assay based on single liposomes
Liposomes are synthetic vesicles composed at least of one lipid bilayer. There are different types of liposomes, according to size and number of lipid bilayers: SUVs, LUVs or MLVs.[31] In particular SUVs can be considered as small nanoreactors that can be
used to perform a variety of different experiments at the nanoscale. Under certain conditions they have the ability to sustain electrochemical gradients and keep a spherical shape. They are made of lipids, this makes them an ideal biocompatible environment for reconstitution of transmembrane proteins. Also water-soluble molecules, for example biologically relevant molecules like DNA, can be encapsulated in their lumen to allow the investigation of their properties. They can be an ideal model system for studying processes that take place both in the lumen or on the lipid
14
membrane. In the past years different researches used single liposome assays, for example for the investigation of fusion processes of synaptic vesicles to presynaptic membrane in neurons and for studies about lipid membrane curvature dependent protein-recruitment. One of the most important and useful properties of an assay based on liposomes is the possibility of high throughput and a great potential for single molecule measurements. [32,33]
Different procedures can be followed to make SUVs. The one followed in this thesis is based on the rehydration of thin lipid films.[34,35] The liposomes are prepared mixing all
the components of the liposomes’ membrane in a vial. These are dried from the solvent with a nitrogen flow and with incubation in vacuum. After the drying process a thin film is formed on the bottom of the cuvette. Rehydration buffer containing the elements to be encapsulated is poured into the vial in order to form the liposomes, which are still multilamellar and with a high size heterogeneity. A freeze-thawing process performed on liposomes decreases multilamellarity, it increases the loading capacity and it breaks down the largest liposomes. It is even possible to extrude the liposomes through a polycarbonate membrane to select their diameter between 30 nm and 200 nm or larger sizes. It is necessary to fix the liposomes on a support in order to exploit the high throughput possibilities of the assay and to perform experiments on the single liposomes. A layer of biotinilated PLL-g-PEG or BAS is used to cover a glass support that represents the surface on which the fixed liposomes will be analyzed at the microscope. In this way the surface is passivated, in order to reduce unspecific binding.[32] This process makes also sure that liposomes adhere on the surface and
prevents their deformation.[36] After the passivation process, NeutrAvidine or
StreptAvidine are flushed into the chamber and they are attached to the surface by biotin anchors. Subsequently Liposomes are incubated into the chamber and they bind to NeutrAvidine/StreptAvidine tetramers by biotin anchors contained into liposomes’ membranes.[37,38]
15
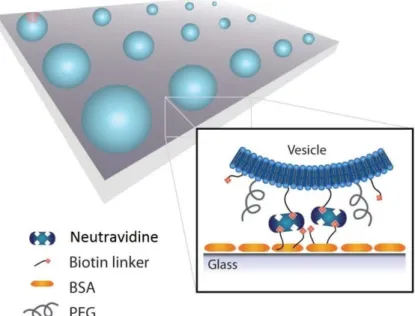
Figure 6 Array of liposomes attached to the passivated surface. The surface is passivated using BSA or
PEG in order to avoid unspecific binding and to ensure that liposomes keep their shape. Liposomes are anchored to the surface by NeutrAvidine or StreptAvidine proteins. These proteins are linked both to liposomes and to the surface by biotin linkers. In this way liposomes are fixed on space and time. Since fluorophores can be embedded in liposomes, these can be analyzed at the TIRF microscope for investigation of biologically relevant molecules present into the lumen or into the membrane of the liposomes.[32]
3.2 Single liposome assay coupled with fluorescence techniques
Fluorescent dyes can be encapsulated in the lumen of liposomes or embedded into the membrane of liposomes. In this way the liposomes attached to passivated surface can by analyzed with TIRF microscopy. In the micrograph of Figure 7 is possible to see an example of immobilized liposomes recorded with TIRF microscopy technique. The liposomes are seen as diffraction limit spots and their intensity varies proportionally to the concentration of substrate at which the fluorophores are sensitive.[32] Analyzing
the intensity of the liposomes is possible to have quantitative results regarding for example the concentration of the substrate present inside the lumen. The density of attached liposomes can be determined in order to keep them separated and to avoid overlapping liposomes. Using single liposome assays is possible to select, in one single frame, up to about 1000 not overlapping liposomes. It is possible to gain information about the average response of all the liposomes after an exchange of external conditions. On the same time it is possible to have an insight on the response of each single liposome, comparing their properties with each other and with the average response.
16
Figure 7 Micrograph of single liposome assay.
The liposomes, attached to the passivated surface, are seen as diffraction limited spots. It is possible to select each one of them and analyze their signal upon changes of the external buffer. These changes could lead to activation of reconstituted proteins that could allow us the study of their activity measuring the intensity changes of individual liposome. (scale bar of 10 μM).
3.3 Single liposomes activity assay for LMCA1
The lipids composition of the liposomes’ membrane and the buffer are both chosen trying to simulate an environment in which the pump works. The transporter protein LMCA1 is supposed to be located into the membrane of liposomes after the reconstitution. The proteins can be oriented inward and outward. The ATP will be provided into the buffer outside so only transporters with an ATP-binding site that has access to ATP will work. In this conditions, when ATP is provided H+ will be pumped out
of the liposomes while Ca2+ ions will be pumped inside. In order to gain information
about the activity of the pump, it is possible to take advantage of both the changes of pH and changes of Ca2+ concentration employing a pH sensor and a Ca2+ sensor. In
order to make sure we are analyzing liposomes containing single molecules, the liposomes that show an activity should be a small percentage (around 10%) of the total number of attached liposomes during each activity measure. Since the pump has its maximum activity around pH 9, the activity experiments have to be performed in alkaline conditions so the pH sensor should be sensitive to changes between pH 6 and pH 10. Since the two fluorophores will have to be used together, they will have to be chosen considering their spectral properties: the excitation and emission peaks have to be at different wavelengths. Also when two types of fluorophores are employed in the same liposomes, it is necessary to keep the two types separated from each other to avoid cross talking. This phenomenon is a consequence of FRET: one excited fluorophore can transfer its energy to another fluorophore if they are close enough and if their spectra are overlapping. For this reason the pH sensor is conjugated to lipid and employed in the membrane of the liposomes while the calcium sensor is encapsulated into the lumen. Upon proton and calcium translocation, an accumulation
17
of positive charges inside the liposomes can build an electrochemical gradient that can modify the activity of the pump. In order to avoid this problem, ionophore valinomycin will be used to let get out from the lumen one K+ for each Ca2+ pumped in.
Figure 8 Single liposomes assay for functional studies of LMCA1. The liposomes are attached to the
passivated surface and contain both fluorophores sensitive to calcium encapsulated into the lumen and lipid-coupled pH sensors on the membrane. After injection of ATP, pumps start pumping Ca2+ ions inside
the lumen and H+ outside into the external buffer. The fluorophores change their intensity according to
Ca2+ or H+ concentration changes. (In the Figure is shown only a change in intensity of calcium sensor). It
is possible to record the intensity changes over time with a TIRF microscope and gain information about the activity of the transporter protein.
The aim of this project is the characterization of different fluorescent sensors to be employed in the single liposome assay for functional studies of the transmembrane protein LMCA1. Three different fluorescence sensors were previously characterized in bulk: the calcium sensors Fluo-5N, Oregon Green Bapta-5N and the pH sensor Snarf-DOPE. All of them showed suitable properties for studying LMCA1. We characterized them at the single liposome level to verify if these fluorophores could be employed for the investigation of LMCA1 with the single liposome assay.
18
4 Experimental setup and apparatus
4.1 Preparation of liposomes
The liposomes were prepared using the thin lipid film rehydration method.[34] The
desired amount of lipids and possible membrane dye that will compose the liposome’ membranes were poured in a clean glass vial using chloroform-resistant pipettes. The glass vials were left under nitrogen flow for approximately 10 minutes in order to have a complete evaporation of the solvent chloroform and until the formation of a thin film on the bottom of the vials was completed. Then the vials were left at least for one hour in a vacuum pump in order to be sure that the solvent was completely evaporated. If membrane dye was present, they were covered with aluminum paper during the process to avoid photobleaching. After the incubation in the vacuum pump, the dried thin film was rehydrated with a rehydration buffer of the desired pH, which was containing the dye that was supposed to be encapsulated. The rehydration buffer composition was always: Tris buffer (20 mM) at pH 8.7, KCl (200 mM), MgCl2 (1 mM),
DTT (1 mM) and it contained also the dye to be encapsulated. DTT is a reducing agent that stabilizes the liposomes and the protein on their surface. It is supposed to be added fresh in every solution because it has a short life-time and it is sensitive to air oxidation. The volume of rehydration buffer had to be equal to the total volume of lipids and membrane dye used to form the lipid film. The rehydrated solution was pipetted in an eppendorf tube and then vortexed for 30 seconds. After vortexing, the tubes were dipped in liquid nitrogen for 1:30 minute and in hot water (50° C) for 5 minutes, for 10 times. The process of freeze-thawing was supposed to break down the biggest liposomes, to reduce the multilamellarity and to increase the dye encapsulation rate. Straight after the freeze-thawing process, the solution with liposomes were pipetted in small eppendorf tubes (20 μL), that were frozen in liquid nitrogen and then stored in the -20° C fridge, covering them with aluminum paper.
4.1.1 Snarf-DOPE containing liposomes
Snarf-DOPE liposomes were prepared with the lipid composition in which the protein is supposed to work during the activity measurements. The liposomes composition in molar percentage was:
E. coli polar lipids 74.3 % Egg yolk PC 24.7 % BT-PEG2000-DSPE 0.5 % Snarf-DOPE 0.5 %
The total amount of rehydration buffer used was 500 μL and there was not any dye to be encapsulated. The vials containing free Snarf-DOPE dye were prepared by Camilla Thorlaksen.
19
4.1.2 Oregon Green Bapta-5N containing liposomes
Initially the Oregon Green Bapta-5N liposomes were prepared with the same composition used for Snarf-DOPE liposomes (E. Coli + egg yolk). Using this lipid composition and with a dye concentration of 100 μM in the rehydration buffer, 62% of liposomes resulted empty. Due to this poor dye encapsulation efficiency it was decided to use the following composition in molar percentage:
DOPC (850375C) 99.3 % BT-PEG2000-DSPE 0.5 % ATTO655-PE 0.2 %
The total amount of rehydration buffer used was 500 μL and it was containing Oregon Green Bapta-5N. Different concentrations of dye in the rehydration buffer were used: 250 μM, 100 μM, 50 μM, 25 μM, 10 μM. With this composition and with a dye concentration of 100 μM in the rehydration buffer, 25% of liposomes resulted empty.
4.2 Spectrofluorometric measurements
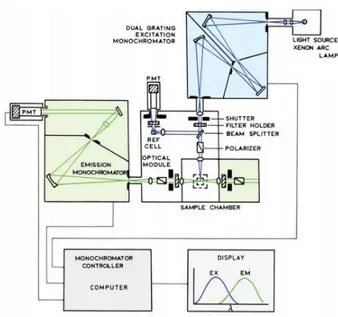
In order to characterize the dyes in bulk, spectrometric measurements were performed using a Horiba Jobin Yvon FluoroMax-4 spectrofluorometer, keeping the temperature at 25°C with a Wavelength Electronics LFI-3751 thermoelectric temperature controller. With a spectrofluorometer it is possible to record emission and excitation spectra of a fluorescent solution in order to investigate its fluorescent properties. As it is possible to see from the scheme in Figure 9 this instrument can have a xenon lamp as a source of exciting light. Monochromators are used to select both the
emission and the excitation wavelengths. The gratings in the monochromators are used to decrease stray light. The excitation light passes through the shutter and reaches a beam splitter. Part of the excitation light is reflected to a reference cell,
Figure 9 Scheme of a Spectrofluorometer.
A monochromator selects the wavelength of the excitation light. Part of it goes to the reference cell, part goes into the sample chamber. The light emitted by the sample passes through a second monochromator and then is collected, converted in digital signals and displayed on a monitor.
20
which generally contains a stable reference fluorophore. It is possible to correct the changes in the intensity of the arc lamp dividing the intensity from the sample by the intensity from the reference fluorophore. The light that passes through the sample goes through the second monochromator and finally arrives to the detector. The fluorescence is detected with photomultiplier tubes and quantified with the appropriate electronic devices, using counts per second (CPS) as a unit of measure.[39]
In each experiment the sample solutions were added to a 1500 μL quartz cuvette, mixing the solution with a pipette to ensure homogeneity. The cuvette was cleaned before each experiment rinsing 5 times with milliQ and 5 times with methanol and then drying under nitrogen flow. The concentration of dye and the slit width were chosen in order to keep the counts range of the spectrofluorometer in the acceptable range between 100000 and 2 millions counts.
4.2.1 Snarf-DOPE - spectrofluorometric measurement
The measurements to obtain a pH-calibration curve for the pH sensor Snarf-DOPE were performed on 1 mL solution containing: Snarf-DOPE mock liposomes (about 100x dilution), Tris buffer (20 mM) at different pH values (from pH 4 to pH 12), KCl (200 mM), MgCl2 (1 mM), DTT (1 mM), CCCP (5 µM) and Valinomycin (62.5 nM). To ensure
the stabilization of the signal, 3 minutes of incubation were waited, monitoring the intensity of the signal with kinetic measurements. Every measure for each pH value was repeated in triplicate, each time preparing from scratch the solution to be injected in the cuvette. The cuvette was cleaned after each measure rinsing 5 times with milliQ and 5 times with methanol and then drying under nitrogen flow. The excitation wavelength used was 532 nm, the emission wavelengths range was from 550 nm to 700 nm. The slit width was 8 nm both for excitation and emission.
4.2.2 ATTO655-DOPE - spectrofluorometric measurement
The mock liposomes used in this experiment were fabricated by Mateusz Dyla from the Molecular biology and genetics Department, Aarhus University, Denmark. The liposomes composition was:
E. coli polar lipids 74.66 % egg yolk PC 24.89 % DOPE-cap-biotin 0.30 % ATTO655-PE 0.50 %
and the rehydration buffer used contained: Tris-HCl pH 8.5 (20 mM), KCl (200 mM), MgCl2 (1 mM), DTT (1 mM).
The measurements to obtain excitation and emission spectra for the fluorescent dye ATTO655-DOPE were performed on 1 mL solution containing: ATTO655-DOPE mock liposomes (about 200x dilution), Tris buffer pH 8.7 (20 mM), KCl (200 mM), MgCl2 (1
21
emission spectra were collected setting the following excitation wavelengths: 640 nm, 532 nm, 491 nm, 405 nm. The emission wavelengths range was from 650 nm to 800 nm. The excitation spectrum was collected setting an excitation wavelength range from 400 nm to 670 nm and an emission wavelength at 679 nm that corresponds to the emission peak of the dye in these conditions. The slit width was 4 for excitation and 3 for emission.
4.3 Preparation of flow cells
In order to perform the experiments at the TIRF microscope, a support where to fix the fluorescent liposomes was needed. Flow cells were used since it is possible to fix on them the liposomes and quickly exchange the external buffer. Flow cells were prepared assembling together cleaned glass slides (thickness 170 ± 10 μm, Assistant, Sondheim, Germany) and a sticky-slide VI 0.4 (Ibidi, Germany). Glass slides were cleaned by 2 sonications in 2% Helmanex, 2 in milliQ water and 1 in methanol storing them in methanol. The glass slide was dried from Methanol under nitrogen flow and then it was put inside a plasma cleaner (PDC-32G; Harrick Plasma) for 3 minutes under vacuum. Right after the cleaning, the glass slide was put on a sticky-slide and then the tubing was inserted (“thick” tubing: TYGON standard, 1.6/4.8 mm, IDEX Health & Science GmbH, United States – “thin” tubing: Polytetrafluoroethylene, 1.0x0.5 mm, Bohlender GmbH, Germany). The flow cell was connected to a pump and a 200 μL of 1.0 g/l pll-PEG-Biotin/pll-PEG (1:100) solution was flushed into the chambers and incubated for 30 minutes. Finally 2 mL of HEPES buffer was flushed into the chambers and the flow cell was stored in a fridge at 4 °C.
Before each experiment the chamber was flushed with 1 mL of HEPES buffer and 200 μL of 0.1 g/l NeutrAvidin in HEPES buffer. After incubation of 10 minutes, 2 mL of sample buffer were flushed into the chambers. The liposomes were immobilized on the surface flushing with 250 μL of sample with the concentration needed for the experiment. Depending on the desired density of liposomes, a different incubation time was waited. After the incubation the non-bound vesicles were flushed away flushing again with 2 mL of sample buffer.
22
4.4 TIRF microscopy
TIRF microscopy is a technique based on an induced evanescent wave of excitation. The depth of this evanescent wave determines the limit of penetration of light over the cover slip and it allows a focus only on the sample extremely close to the surface, on a range of some nanometers. The evanescent wave is generated only when the incident light becomes totally internal reflected at the glass-sample interface. This happens for a
particular incident angle called critical angle. This technique is very useful to investigate processes that occur close to the plasma membrane. In this case it was necessary in order to have a high temporal resolution and to reduce the background noise.[40] The microscope used had four different lasers with emission wavelengths of
405 nm, 491 nm, 532 nm and 640 nm. It was possible to use the microscope both in single view or dual view. When used in single view, the camera collects the light coming from the sample without additional filters, except the excitation filter that cuts the wavelengths of the laser. When used in double view, the light that comes from the sample, after the excitation filter, passes through a system of mirrors that contains an additional dichroic mirror. This dichroic mirror splits the signal in two parts, sending the light above a certain wavelength (640 nm in our case) to one half of the camera and the light below to the other half. The microscope settings (laser power, exposure time, presence of additional ND filters and type of ND filters) were determined in order to quantify and minimize photobleaching. The percentage of average signal decreased due to photobleaching in each experiment was 10% of the total average signal. Photobleaching measurements were carried out in the same condition in which the experiment was supposed to be performed.
4.4.1 Snarf-DOPE - TIRF microscopy measurement
The mock liposomes containing membrane dye Snarf-DOPE used for the pH titration were fabricated by Camilla Thorlaksen. The liposomes composition in molar percentage was:
E. coli polar lipids 74.3 % egg yolk PC 24.7 %
Figure 10 Total Internal Reflection Fluorescent Microscopy.
The sample is excited by the incident light. When light is totally internally reflected, the evanescent wave is generated and it excites only fluorophores immediately above the cover slip, decreasing the background noise.
23
BT-PEG2000-DSPE 0.5 % Snarf-DOPE 0.5 %
and the rehydration buffer used contained: Tris-HCl pH 8.5 (20 mM), KCl (200 mM), MgCl2 (1 mM), DTT (1 mM).
pH titration
The liposomes (30x dilution) were incubated for 15 minutes then 2 mL of sample buffer at pH 12 ( Tris-HCl (20 mM), KCl (200 mM), MgCl2 (1 mM), DTT (1mM), CCCP (5
µM), Valinomycin (62.5 nM) ) were used for flushing away the non-bound liposomes. The right position of the sample was chosen and after 3 minutes of incubation, 5 images were recorded. Sample buffer at pH 11 was flushed and after 3 minutes of incubation, 5 images were recorded. This process was repeated also for the pH values in the range between pH 10 and pH 4 in order to obtain the calibration curve. The excitation wavelength of the laser was 532 nm (20% laser power), the exposure time was 500 ms, the microscope was set on double with a cutoff wavelength of 640 nm, and a neutral density filter 3.0 was used to decrease the power of the laser. The experiment was repeated in triplicate.
4.4.2 Oregon Green Bapta-5N - TIRF microscopy measurement
Investigation of self-quenching effect
The liposomes (200x dilution) were incubated for 5 minutes then 2 mL of sample buffer ( Tris-HCl pH 8.7 (20 mM), KCl (200 mM), MgCl2 (1 mM), DTT (1mM) ) were used
for flushing away the non-bound liposomes. The right position of the sample was chosen and a movie of 10 minutes was recorded in order to see if an increase of signal could indicate the presence of self-quenching effect for the encapsulated dye. This experiment was repeated for liposomes containing different concentration of Oregon Green Bapta-5N: 250 μM, 100 μM, 50 μM, 25 μM, 10 μM. The excitation wavelength of the laser was 491 nm (15% laser power) for the Oregon Green Bapta-5N channel and 640 nm (8% laser power) for the ATTO655 channel, the exposure time was 500 ms, the microscope was set on single view and a neutral density filter 2.0 was used to decrease the power of the laser.
4.4.3 Fluo-5N - TIRF microscopy measurement
The mock liposomes containing encapsulated Fluo-5N (they will be called full liposomes) were fabricated by Mateusz Dyla from the Molecular biology and genetics Department, Aarhus University, Denmark. The liposomes composition in molar percentage was:
24
E. coli polar lipids 74.66 % egg yolk PC 24.89 % DOPE-cap-biotin 0.30 % ATTO655-PE 0.50 %
and the reconstitution buffer used contained: Tris-HCl pH 8.5 (20 mM), KCl (200 mM), MgCl2 (1 mM), DTT (1 mM), Fluo-5N (1 mM).
Mock liposomes without any encapsulated dye ( they will be called empty liposomes) were fabricated by Mateusz Dyla from the Molecular biology and genetics Department, Aarhus University, Denmark. The liposomes composition in molar percentage was:
E. coli polar lipids 74.66 % egg yolk PC 24.89 % DOPE-cap-biotin 0.30 % ATTO655-PE 0.50 %
and the rehydration buffer used contained: Tris-HCl pH 8.5 (20 mM), KCl (200 mM), MgCl2 (1 mM), DTT (1 mM).
Ca2+ titration
The full liposomes (200x dilution) were incubated for 10 minutes then 2 mL of sample buffer ( Tris-HCl pH 8.5 (20 mM), KCl (200 mM), DTT (1mM) ) were used for flushing away the non-bound liposomes. The right position of the sample was chosen, 5 images were recorded both on the fluo-5N channel and on the ATTO655 channel and then sample buffer containing ionomycin (10 µM) was flushed. After 3 minutes of incubation 5 images were recorded on the fluo-5N channel then sample buffer with ionomycin (10 μM) and calcium (1 μM ) was flushed. This process was repeated for all the different calcium concentrations needed to obtain the calibration curve: 1 μM, 5 μM, 10 μM, 20 μM, 50 μM, 100 μM, 200 μM, 300 μM and 500 μM. The excitation wavelength of the laser was 491 nm (15% laser power) for the Fluo-5N channel and 640 nm (8.5% laser power) for the ATTO655 channel, the exposure time was 500 ms, the microscope was set on single view and a neutral density filter 2.0 was used to decrease the power of the laser.
Investigation of cross emission of ATTO655
In this experiment were used both the empty liposomes and the full liposomes. The
empty liposomes (200x dilution) were incubated around 10 minutes then 2 mL of
sample buffer ( Tris-HCl pH 8.5 (20 mM), KCl (200 mM), MgCl2 (1 mM), DTT (1 mM),
valinomycin (62.5 nM) ) were used for flushing away the non-bound liposomes. The right position of the sample was chosen and fifteen images of empty liposomes were
25
recorded: five on the ATTO655 channel and ten on the Fluo-5N channel. Subsequently the full liposomes were incubated and after about 10 minutes 2 mL of sample buffer were used for flushing away the non-bound liposomes. Again fifteen images were recorded as previously in the same position. The excitation wavelength of the laser was 491 nm (55% laser power) for the Fluo-5N channel and 640 nm (15% laser power) for the ATTO655 channel, the exposure time was 500 ms, the microscope was set on double view and a neutral density filter 3.0 was used to decrease the power of the laser. The experiment was repeated in duplicate.
Unspecific binding to the membrane of liposomes
The empty liposomes (200x dilution) were incubated for 10 minutes then 2 mL of sample buffer ( Tris-HCl pH 8.5 (20 mM), KCl (200 mM), MgCl2 (1 mM), DTT (1 mM),
valinomycin (62.5 nM) ) were used for flushing away the non-bound liposomes. The initial part of the experiment was performed to check if the injection of calcium could modify the signal. The right position of the sample was chosen and fifteen images of the initial condition were recorded: five on the ATTO655 channel and ten on the Fluo-5N channel. 200 μL of sample buffer with calcium (500 μM) were flushed. Ten images on the Fluo-5N channel were recorded. In the second part of the experiment the system was brought back to the initial conditions. Fifteen images of the initial condition were recorded: five on the ATTO655 channel and ten on the Fluo-5N channel. 200 μL of sample buffer with free Fluo-5N (100 μM) were flushed. Ten images on the Fluo-5N channel were recorded. 200 μL of sample buffer with calcium (500 μM) were flushed. Ten images on the Fluo-5N channel were recorded. The excitation wavelength of the laser was 491 nm (45% laser power) for the Fluo-5N channel and 640 nm (15% laser power) for the ATTO655 channel, the exposure time was 500 ms, the microscope was set on double view and a neutral density filter 3.0 was used to decrease the power of the laser. The experiment was repeated in triplicate.
4.5 Image analysis
All the images recorded with the TIRF microscope were first preprocessed with ImageJ or FIJI and subsequently analyzed with Igor’s routines. The preprocessing stage was useful firstly to increase the signal to noise ratio: images of the sample were recorded minimum in triplicates and then averaged so as the background noise could be decreased. Secondly it was possible to align the images recorded throughout all the experiment and correct the drifting effect: all the images were aligned using translations and rotations according to the brightest one of the recorded stack. This aligning process could be done manually or using the specific plug-in of ImageJ: StackReg. During this stage the images were also rearranged in the right order, cut or combined in order to be analyzed.
26
Then the preprocessed images were analyzed using one of the particle tracking and analyzing routines written in Igor: NGPA by S. M. Chrsitensen or TAMT by M. Tuktus. In particular TAMT was used to analyze the images of Snarf-DOPE while NGPA was used for the rest of the images. Both the routines perform a 1D or 2D gaussian fitting on intensity peaks over a user defined threshold. The integrated intensity represents the fluorescent signal from the immobilized liposomes. It is possible to accept or reject the results according to user defined parameters such as minimum size, circularity and fitting error. It is also possible to colocalize signal between two different channels, for example this is necessary to analyze data from a ratiometric experiment or this is useful when more than one dye is employed into the liposomes. In our case it was useful to colocalize signal emitted by membrane dye (ATTO655) and encapsulated dye (Oregon Green Bapta-5N or Fluo-5N): in this way it was possible to exclude those liposomes that do not colocalize such as empty liposomes (their signal comes only from ATTO655) and conglomerates of free dye unspecifically bound to the surface (their signal comes only from Oregon Green Bapta-5N or Fluo-5N). Once the liposomes are selected on the first frame, the program can keep track of them through a series of images. Finally it is possible to plot the intensity of each liposome versus time or versus other quantities such as pH values or ions concentrations. Whit TAMT it was also possible to correct the images for the background using three different methods: “rolling ball” algorithm, gaussian filtering and low-frequency filtering.
27
5 Data analysis and results
The main goal of the single liposome assay for functional studies of LMCA1 is to allow an insight on the activity of the pump at the single molecule level employing fluorescent sensors that are sensitive to concentration changes of the substrate translocated across the liposomes’ membrane by the pump itself. The liposomes are immersed in an aqueous medium in which other elements such as ions can be flushed during the experiments. Both the composition of liposomes’ membrane and aqueous buffer were chosen in order simulate in the best way possible the biological environment in which the protein naturally works. In the following sections the characteristics of three different fluorescence sensors will be discussed and it will be described their suitability to the single liposome assay.
5.1 Characterization of Snarf-DOPE for the single liposome assay
The compound Snarf-DOPE consists of the pH sensor Carboxy Snarf-1 conjugated to lipid DOPE. This compound was synthesized for our use by Thomas Pomorski. [41]
Carboxy Snarf-1 is a cell impermeable pH sensor. It has an excitation peak at 532 nm while it has two emission peaks: one at 583 nm and one at 640 nm. The presence of two peaks is due to the fact that this dye has two fluorescent states: monoanion and dianion. Upon changes of pH it exhibits an emission wavelength shift from 583 nm to 640 nm. The presence of two peaks can be useful in order to perform ratiometric experiments. It was decided to conjugate Carboxy Snarf-1 to lipid DOPE in order to obtain Snarf-DOPE and to use it as a membrane dye. The presence of Snarf-DOPE into the membrane of liposomes will allow us the measurement of pH changes of the environment in which liposomes are immersed. In the following sections properties of Snarf-DOPE will be shown, both in bulk and in the single liposomes assay. CCCP, a protonophore that translocates protons across the lipid bilayer, was used during the experiments in order to equilibrate the concentration of protons inside and outside the liposomes upon changes of buffer at different pH values.
5.1.1 Bulk characterization
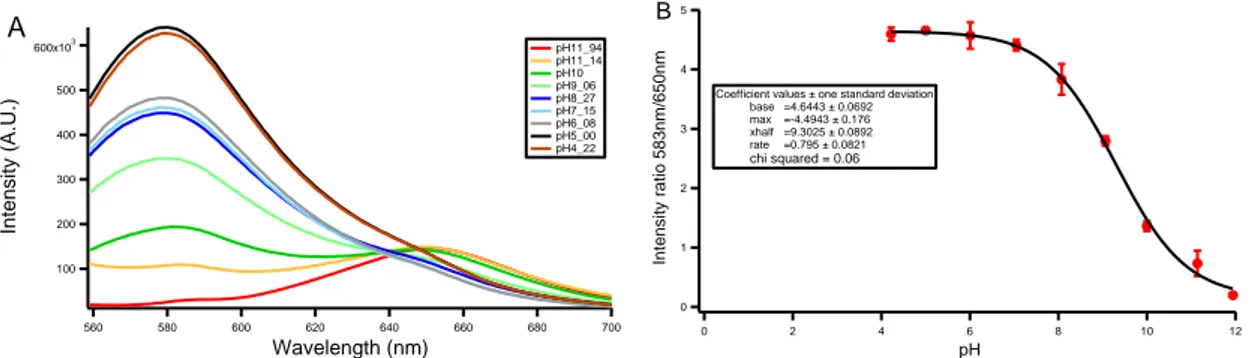
In order to verify if the properties of Snarf-DOPE in bulk could suite the single liposome assay for studying LMCA1, spectrofluorometric experiments were performed. The response of Snarf-DOPE to pH changes was investigated as so to calculate the fold increase of the intensity ratio. Snarf-DOPE liposomes were dissolved into sample buffer containing CCCP and valinomycin and its intensity was measured upon changes of pH. For details on the exact protocol used to perform the pH titration see Section 4.2.1 . As it is possible to notice from Figure 11-A, the dye exhibits two emissions peaks: one more prominent at 583 nm and the other one at 650 nm. As far as the pH
28
increases, the peak at 583 nm increases while the peak at 650 nm decreases, undergoing a fluctuation in the intensity of emitted light. It was possible to calculate the intensity ratio curve in Figure 11-B dividing the intensity at 583 nm by the intensity at 650 nm for all the different pH values.
As it is possible to see in Figure 11-B, the intensity shift is localized between pH 6 and pH 10, which is the range in which LMCA1 is supposed to have high activity. The intensity ratio increases of I1 = (3.3 ± 0.2) units in this range. A sigmoidal fit was
performed on the intensity ratio curve and it was found a pKa bulk = (9.3 ± 0.1). The
function used to fit the intensity ratio curve is a sigmoidal function defined as follow:
𝑓(𝑥) = 𝑏𝑎𝑠𝑒 + { 𝑚𝑎𝑥 1 + 𝑒(
(𝑥ℎ𝑎𝑙𝑓−𝑥)
𝑟𝑎𝑡𝑒 )
}
The parameter that represents the pKa of the intensity ratio curve is xhalf, defined as
the x at which the function has a value corresponding to half of the maximum saturation value.
Since the value of pKa bulk is in a range in which LMCA1 has a high activity and the
intensity ratio increases of I1 = (3.3 ± 0.2) units, Snarf-DOPE has the right bulk
properties to be tested also with the single liposome assay for studying LMCA1.
Figure 11 Spectrofluorometric measurements of liposomes containing membrane dye Snarf-DOPE
A) Emission spectra for different pH values showing the presence of two peaks at the wavelength of 583 nm and 650 nm. Every spectrum is an average of three different spectra.
B) Intensity ratio profile was determined by dividing the emission peak at 583 nm with the corresponding emission peak at 650 nm. The curve was fitted with a sigmoidal function from which it is possible to obtain the average pKa bulk = (9.3 ± 0.1). Each data point was obtained as an average between three experiments.
The error bar is the standard deviation. The liposomes where diluted about 100x in a solution of Tris buffer 20 mM at different pH containing: 1 mM MgCl₂, 200 mM KCl, 1 mM DTT, 5µM CCCP and 62.5 nM valinomycin.
5.1.2 Single liposomes level characterization: calibration curve and pKa distribution
In order to characterize Snarf-DOPE at the single liposomes level, the liposomes containing Snarf-DOPE were attached to the surface of a flow cell, following the procedure explained in Section 4.3 . In order to quantify the response of the
600x103 500 400 300 200 100 Inten sity (A. U.) 700 680 660 640 620 600 580 560 Wavelength (nm) pH11_94 pH11_14 pH10 pH9_06 pH8_27 pH7_15 pH6_08 pH5_00 pH4_22 A 5 4 3 2 1 0 Inten sity ratio 58 3n m/65 0n m 12 10 8 6 4 2 0 pH
Coefficient values ± one standard deviation base =4.6443 ± 0.0692 max =-4.4943 ± 0.176 xhalf =9.3025 ± 0.0892 rate =0.795 ± 0.0821 chi squared = 0.06 B
29
fluorophore to pH changes, a ratiometric experiment was performed. It was necessary to select two different emission ranges using the dual view of the microscope: a lower range in the interval of wavelengths (582 ± 37.5) nm and an higher range in the interval of wavelengths over 650 nm. It is possible to see from Figure 12 an example of a micrograph showing liposomes during the ratiometric experiment: the upper part of the image represents the emission signal in the range [582 ± 37.5] while the lower part represents the emission in the range over 650 nm.
Figure 12 Micrograph showing liposomes attached to the passivated surface during the pH titration.
In the upper half, in red, the 650 nm channel. In the lower half, in green, the 583 nm channel. The analysis was performed only on liposomes colocalized between these two channels. (Scale bar = 10 μM).
Liposomes were colocalized between the 650 nm channel and the 583 nm channel (over 80 % colocalization rate). During the analysis each colocalized liposome was fitted with a two dimensional gaussian function: the intensity of each liposome is represented by the area underlying the fitting function. Only fits with an error on the intensity lower than a tenth of the estimated value were accepted. The average emission signal of the two different channels was plotted as a function of the pH values where the intensity was normalized to the intensity at pH 12, as it is shown in Figure 13-A,B. The average intensity ratio is shown in Figure 13-C. It was calculated dividing each data point of 583 nm channel by the corresponding data point of 650 nm channel. A sigmoidal fit was performed on the average intensity ratio in order to calculate the average pKa microscope_avg = (8.0 ± 0.1). Snarf-DOPE responded to pH
changes also in the single liposome assay: the intensity ratio increases of I2 = (5.5 ± 0.4)
units between pH 10 and pH 6. Both the pKa microscope_avg value and the increase of the
intensity ratio I2 in the pH range between pH 10 and pH 6 suggest that Snarf-DOPE can
be a good candidate for functional studies of LMCA1 because this fluorophore can sense pH changes in an alkaline environment in which activity experiment will be performed.
30
Figure 13 Ratiometric measurement at microscope of liposomes containing Snarf-DOPE. The average signal from three different experiments is shown as a function of the pH.
A) Average signal collected in the range of (582 ± 37.5) nm. B) Average signal collected over 650 nm. Both A) and B) are normalized by the intensity at pH 12. C) Ratio between the two previous averaged signal. 150 liposomes were analyzed. The intensity ratio curve was fitted with a sigmoidal function from which it is possible to obtain the average pKa microscope_avg = (8.0 ± 0.1). It is possible to notice that the
intensity ratio increases of I2=(5.5 ± 0.4) units between pH 10 and pH 6. The experiment was repeated
three times. The error bars represent the standard deviation.
The fluorophore was characterized at the single liposome level in order to evaluate the heterogeneity of the fluorescent response of individual liposomes. In particular the aim was to establish a one-to-one correspondence between intensity ratio values and pH values and to verify if this conversion could be valid for all the liposomes or a local conversion for each liposome was necessary. The distribution of intensity ratio values of every single liposome was plotted for each pH value as so to have an indication of the heterogeneity of the response of the single liposomes, as it is possible to see in Figure 14. It is possible to notice that the widths of every distribution cover different pH values. In the graph of Figure 15 the average value of each distribution plotted against the corresponding pH value is shown and the error bar corresponds to the width of the corresponding gaussian distribution. It is already clear from Figure 15 that it is not possible to establish a one-to-one correspondence between intensity ratio values and pH values. For example given an intensity ratio value of 3 units, this can correspond to three different pH values: pH 6, pH 7 and pH 8. Both Figure 14 and Figure 15 are based on the intensity value of single liposomes and show a certain heterogeneity among all the liposomes.
60 50 40 30 20 10 0 No rmal ize d in ten sity 12 10 8 6 4 pH
Average signal - 583 nm peak
A 2.0 1.5 1.0 0.5 0.0 No rmal ize d in ten sity 12 10 8 6 4 pH
Average signal - 650 nm peak B 5 4 3 2 1 12 10 8 6 4 pH
Coefficient values ± one standard deviation
base =5.1482 ± 0.144
max =-5.0518 ± 0.243
xhalf=8.0089 ± 0.108
rate =1.201 ± 0.121
chi squared = 0.05
Average intensity ratio N=150 C A v e ra g e I n te n s it y 5 8 3 n m /6 5 0 n m