2020-03-30T15:02:11Z
Acceptance in OA@INAF
The Absolute Age of the Globular Cluster M15 Using Near-infrared Adaptive Optics
Images from PISCES/LBT
Title
Monelli, M.; TESTA, Vincenzo; Bono, G.; Ferraro, I.; Iannicola, G.; et al.
Authors
10.1088/0004-637X/812/1/25
DOI
http://hdl.handle.net/20.500.12386/23708
Handle
THE ASTROPHYSICAL JOURNAL
Journal
812
THE ABSOLUTE AGE OF THE GLOBULAR CLUSTER M15 USING NEAR-INFRARED
ADAPTIVE OPTICS IMAGES FROM PISCES/LBT
*M. Monelli1,2, V. Testa3, G. Bono3,4, I. Ferraro3, G. Iannicola3, G. Fiorentino5, C. Arcidiacono5,6, D. Massari5,7, K. Boutsia3, R. Briguglio6, L. Busoni6, R. Carini3, L. Close8, G. Cresci5, S. Esposito6, L. Fini6, M. Fumana9, J. C. Guerra10, J. Hill10, C. Kulesa8, F. Mannucci6, D. McCarthy8, E. Pinna6, A. Puglisi6, F. Quiros-Pacheco6,
R. Ragazzoni11, A. Riccardi6, A. Skemer8, and M. Xompero6
1
Instituto de Astrofísica de Canarias, La Laguna, Tenerife, Spain;[email protected]
2
Departamento de Astrofísica, Universidad de La Laguna, Tenerife, Spain 3
INAF-Osservatorio Astronomico di Roma, Via Frascati 33, I-00040 Monteporzio Catone, Italy 4
Universitá di Roma“Tor Vergata,” Via della Ricerca Scientifica 1, 00133 Roma, Italy 5
INAF-Osservatorio Astronomico di Bologna, Via Ranzani 1, I-40127 Bologna, Italy 6
INAF-Osservatorio Astronomico di Arcetri, Largo Enrico Fermi 5, I-50125 Firenze, Italy 7
Kapteyn Astronomical Institute, Landleven 12, NL-9747 AD Groningen, The Netherlands 8
Steward Observatory, Department of Astronomy, University of Arizona, Tucson, AZ 85721, USA 9
INAF-IASF, via E. Bassini 15, I-20133 Milano, Italy
10LBT Observatory, Universityof Arizona, 933 North Cherry Ave., Tucson, AZ 85721, USA 11
INAF-Oservatorio Astronomico di Padova, Vicolo dell’Osservatorio 5, I-35122, Padova, Italy Received 2014 November 6; accepted 2015 July 17; published 2015 October 6
ABSTRACT
We present deep near-infrared J, Ksphotometry of the old, metal-poor Galactic globular cluster M15 obtained with
images collected with the LUCI1 and PISCES cameras available at the Large Binocular Telescope (LBT). We show how the use of First Light Adaptive Optics(FLAO) system coupled with the PISCES camera allows us to improve the limiting magnitude by ∼2 mag in Ks. By analyzing archival Hubble Space Telescope data, we
demonstrate that the quality of the LBT/PISCES color–magnitude diagram is fully comparable with analogous space-based data. The smaller field of view is balanced by the shorter exposure time required to reach a similar photometric limit. We investigated the absolute age of M15 by means of two methods:(i) by determining the age from the position of the main-sequence turnoff(MSTO),and (ii) by the magnitude difference between the MSTO and the well-defined knee detected along the faint portion of the MS. We derive consistent values of the absolute age of M15, that is, 12.9 ± 2.6 Gyr and 13.3 ± 1.1 Gyr, respectively.
Key words: globular clusters: general– globular clusters: individual (M15) – techniques: photometric
1. INTRODUCTION
Cosmological results based on recent cosmic microwave background(CMB) experiments (Boomerang, WMAP, Planck), on baryonic acoustic oscillations (BAOs; Eisenstein et al. 2005), on supernovaobservations (Riess et al. 1998, 2011), and on gravitational lensing (Suyu et al. 2010,2013) opened the path to the era of precision cosmology. However, the quoted experiments are affected by an intrinsic degeneracy in the estimate of cosmological parameters, e.g., the Hubble constant H0. To overcome this problem, either
specific priors or the results of different experiments are used (Bennett et al.2014).
Recent evaluations of the H0based on CMB provide values
ranging from 70.0 ± 2.2 km s−1Mpc−1 (WMAP9; Hinshaw et al.2013) to 67.8 ± 0.9 km s−1Mpc−1(Planck Collaboration et al.2015). Similar values have also been obtained by BAOs plus supernovae using the so-called inverse distance ladder, suggesting a value of 68.6 ± 2.2 km s−1Mpc−1 (Cuesta et al. 2015). On the other hand, resolved objects (Cepheids
plus supernovae) provide H0 values ranging from 73 ± 2
(random) ± 4 (systematic) km s−1Mpc−1 (Freedman &
Madore 2010) to 73.8 ± 2.4 km s−1Mpc−1 (Riess et al. 2011). Slightly larger values of the Hubble constant were obtained by Suyu et al. (2013) using gravitational lens time delays (80.0 4.7 4.5 -+ km s−1Mpc−1, uniform H 0 in flat ΛCDM).
The above estimates of the Hubble constant indicate that there is some tension between the results based on CMB and BAOs and those based on primary and secondary distance indicators. This critical issue has been addressed in several recent papers, suggesting a difference that ranges from almost 2σ (Efstathiou2014) to more than 2.5σ (Riess et al.2011). The quoted uncertainties on the Hubble constant open the path to new physics concerning the number of relativistic species and/ or the mass of neutrinos (Dvorkin et al. 2014; Wyman et al. 2014). Moreover and even more importantly, the above range in H0implies an uncertainty on the age of the universe—
t0—of the order of 2 Gyr. This uncertainty has a substantial
impact not only on galaxy formation and evolutionbut also on the age of the most ancient stellar systems, i.e., the globular clusters(GCs).
The absolute age of GCs can be independently estimated using stellar astrophysics, and it is affected by theoretical, empirical, and intrinsic uncertainties.
Theoretical.—Stellar evolutionary models adopted to con-struct cluster isochrones are affected by uncertainties in the
© 2015. The American Astronomical Society. All rights reserved.
*Observations were carried out using the Large Binocular Telescope at MountGraham, AZ. The LBT is an international collaboration among institutions in the United States, Italy, and Germany. LBT Corporation partners are the University of Arizona on behalf of the Arizona university system; Istituto Nazionale di Astrofisica, Italy; LBT Beteiligungsgesellschaft, Germany, representing the Max-Planck Society, the Astrophysical Institute Potsdam, and Heidelberg University; the Ohio State University; and the Research Corporation, on behalf of the University of Notre Dame, University of Minnesota, and University of Virginia.
input physics,in particular, in the adopted microphysics (opacity, equation of state, astrophysical screening factors) and in macrophysics (mixing length, mass loss, atomic diffusion radiative levitation, color–temperature transforma-tions). The impact that the quoted ingredients have on cluster isochrones has been discussed in detail in the literature (Pietrinferni et al. 2004, 2009; VandenBerg et al. 2013; Cassisi 2014). The typical uncertainty in the adopted clock— the main-sequence turnoff (MSTO)—is of the order of 10%,thus suggesting that theoretical uncertainties donot appear to be the dominant source in the error budget of the absolute age of GCs.
Empirical.—The main sources of uncertainty in the absolute age estimate of GCs are the individual distances (Dm0~0.1 mag in the true distance modulus implies an uncertainty of 1 Gyr in the absolute age). The age estimate is even more affected when the uncertainties in the reddening correction and in the reddening law are taken into account (Stetson et al.2014).
Importantly, the massive use of multiobject fiber spectro-graphs provided the opportunity to construct afirm metallicity scale including a significant fraction of GCs (Carretta et al. 2009), thus reducing the uncertainties in the iron and in theα-element abundances.
Intrinsic.—Dating back to more than 40 years ago, spectro-scopic investigations brought forward a significant star-to-star variation in C and in N among cluster stars(Osborn1971). This evidence was soundly complemented by variation in Na, Al, and O(Cohen1978; Pilachowski et al.1983; Leep et al.1986) and by anticorrelations in CN–CH (Kraft1994) and in O–Na and Mg–Al (Suntzeff & Smith1991; Gratton et al.2012).
The above evidence has been further strengthened by the occurrence of multiple stellar populations in more massive clusters(Bedin et al.2004; Piotto et al.2005,2007). However, detailed investigations concerning the different stellar popula-tions indicate a difference in age that is, in canonical GCs, on average shorter than 1 Gyr (Ventura et al. 2001; Cassisi et al.2008). The intrinsic uncertainty does not seem to be the main source of the error budget of the GCs’ absolute age.
To overcome or to alleviate the quoted uncertainties, different approacheshave been suggested,mainly based on relative age estimates, the so-called vertical and horizontal methods (Marín-Franch et al. 2009; Dotter et al. 2011; VandenBerg et al. 2013). In this context the relative age is estimated as a difference between the clock(the MSTO) and an evolved reference point, either the horizontal branch or a specific point along the red giant branch (RGB). The key advantage of these methods is that they are independent of uncertainties on cluster distance and reddening. However, they rely on the assumption that the reference points are independent of cluster age and introduce new theoretical uncertainties (conductive opacities, Cassisi et al. 2007; extra-deep mixing along the RGB, Denissenkov & Weiss 2004). It goes without saying that the transformation of relative ages in absolute ages using a calibrating GC introduces the typical uncertainties already discussed.
More recently it has been suggested to use as a reference point a well-defined knee along the low-mass regime of the main sequence(MSK). The MSK has already been detected in several old(ω Cen, Pulone et al.1998; M4, Pulone et al.1999; Milone et al. 2014; Braga et al. 2015; NGC 3201, Bono et al. 2010; 47 Tuc, Lagioia et al. 2014; NGC 2808, Milone
et al. 2012; M71, Di Cecco et al.2015) and intermediate-age (An et al.2009a,2009b; Sarajedini et al.2009b) stellar systems and in the Galactic bulge(Zoccali et al. 2000) by using near-infrared (NIR) and/or optical–NIR color–magnitude dia-grams(CMDs).
Nevertheless, one of the most difficult observational problems in measuring stellar magnitudes and colors in GCs is that they are intrinsically crowded stellar systems, and therefore the photometry of their stars is strongly limited by poor weather conditions. In particular, bad seeing(larger than ∼1″) has the effect of severely limiting the identification and measurement of faint stars. This means a systematic increase in the limiting magnitudes and in the photometric accuracy when moving from the outskirts to the innermost cluster center.
Twenty-five years ago the advent of the Hubble Space Telescope (HST) started a new era, and the high spatial resolution provided by space images collected in optical bands allowed us to resolve the core of GCs. Recently, a similar resolution is becoming possible from ground-based observa-tions using NIR cameras available on 10 m class telescopes assisted by adaptive optics (AO) systems. This technology allows ground-based observations to reach the diffraction limit over a modestfield of view (FOV; ∼1′×1′). High-resolution NIR images of GCs can have a relevant impact on current astrophysical problems as soundly demonstrated by MAD (Multi-Conjugated Adaptive Optics Demonstrator;Marchetti et al.2003), the pilot Very Large Telescope (VLT) instrument built to test on the sky the feasibility of a multi-conjugateAO (MCAO) system(Bono et al.2009; Ferraro et al.2009; Moretti et al. 2009; Fiorentino et al. 2011). The robustness of the current MCAO systems has been further supported by GeMS/ GSAOI available at the GEMINI-South telescope (Neichel et al.2014a,2014b; Rigaut et al.2014). This new system uses both natural guide stars for the tip tilt correction and five artificial stars to close the loop, and it has been able to deliveruniform NIR images approaching its diffraction limit in Galactic bulge (Saracino et al. 2015) and halo (Turri et al.2015) GCs.
In this context we have collected AO images of the GC M15 (NGC 7078), using the First Light Adaptive Optics (FLAO; Esposito et al.2010) system mounted on the Large Binocular Telescope(LBT). This cluster is located at 10» kpc (10.4 kpc, Durrell & Harris 1993; 9.9 kpc, McNamara et al. 2004; 10.4 kpc, van den Bosch et al. 2006) and is affected by moderate interstellar extinction (E B( -V) = 0.08 mag, Sandage et al. 1981; 0.10, Schlafly & Finkbeiner 2011, 0.12, Schlegel et al.1998). Most interestingly, it is among the most metal-poor Galactic GCs ([Fe/H] » -2.4; Kraft & Ivans 2003), and therefore it possibly traces the oldest component of our Galaxy (see Table 1 for the parameters assumed in our analysis). Notably, despite multiple populations havingbeen proved to exist in this cluster(Monelli et al.2013; Piotto et al.2015), so far there is no evidence of multiple turnoff or subgiant branches
Table 1
Basic Parameters adopted for M15 Parameter Value References
(m-M)0(mag) 15.14 Harris(1996), Durrell & Harris (1993) E B( -V)(mag) 0.08 Sandage et al.(1981)
as for NGC 1851(Milone et al.2008) that could affect the age estimate.
2. OPTICAL AND NIR DATA SETS
The present work uses four different data sets from different imagers. In the following we summarize the main properties of each of them. A summary is given in Table 2.
2.1. LBT/PISCES Data
PISCES is an NIR imager covering a wavelength range of 1–2.5 μm with aHawaii 1024 pixel × 1024 pixel HgCdTe array, installed at the front bent-Gregorian focus (McCarthy et al. 2001) of the LBT. It critically samples a diffraction-limited point-spread function (PSF) with a plate scale of 0. 0193 pixel−1. Observations were carried out using PISCES, together with the FLAO system mounted on the DX (right) telescope of LBT. M15 was observed on 2011 October 14–15 during the Science Verification Time for the FLAO system. This is a twin of the 672-actuator,voice-coil-based, contactless adaptive mirror (Salinari et al. 1994; Davies et al. 2010) controlled by the means of a pyramid (Ragazzoni 1996) wavefront sensor. The FLAO uses solely the Natural Guide Star as reference,and it retrieves a high Strehl ratio over a broad wavelength range, reaching peak performance on a bright reference in the NIR(80% in the H band). Once at the regime phase, the two FLAO systems will feed the LUCI1 and LUCI2 cameras (Le Fèvre et al.2003).
Two fields were acquired with the FLAO+PISCES setup, one centered on the cluster core, the other approximately 3’ southwest of the cluster center. In both cases the selection criterion for the field was the presence of a suitable star for wavefront analysis in the FOV, with magnitude R= 12.6 mag
R
and =12.9mag for the central and outerfield, respectively. In the current investigation we will focus on the externalfield. A preliminary photometric analysis of the centralfield, together with a detailed investigation of the variation of the PSF across the FOV, has already been discussed by Fiorentino et al. (2014). A comprehensive analysis will be addressed in a forthcoming investigation. During the observations, weather conditions were photometric with good natural seeing condi-tions(0″.65–0″.9, as recorded by the DIMM). The AO allowed us to reach a mean FWHM of 0. 05 and of 0. 06 in the Jand in the Ksband, respectively, as measured on the images. The
Strehl ratio on the quoted images reached 28% (J) and 60% (Ks) consistently with the expected scaling versus wavelength.
2.2. LBT/LUCI1 Data
One pointing with the spectro-imager LUCI1 at LBT was collected for calibration purposes. The set of observations was secured on 2012 June21–22 in the J and Ksfilters, under good
seeing conditions (∼0″.7). The data set was taken with the center of the cluster in the NE quadrant of the image in order to include both the central and the outer field observed with PISCES. We adopted this observing strategy to constrain possible systematics in the absolute calibrations due to positional effects. An off-source set of images was also taken to perform median-sky subtraction and superflat construction (see Section2.4).
2.3. HST Optical and NIR Data
Complementary data sets will be used in the analysis of the LBT images. In particular, a series of nine images has been retrieved from the HST archive. They were collected with the WFC3 in the F160W passband. Furthermore, we will make use of F606W and F814W photometry of M15, retrieved from the “Advanced Camera for Surveys (ACS) Survey of Galactic GCs” database (Sarajedini et al.2007).
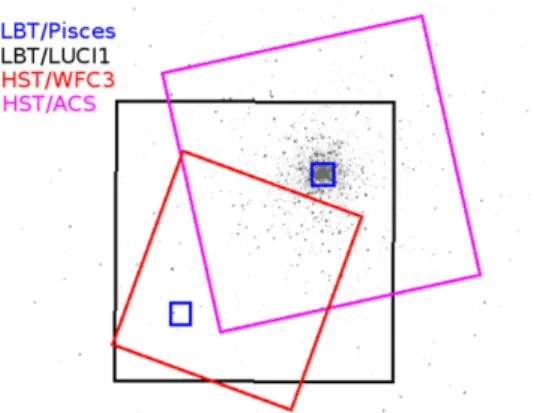
Figure1shows a Sloan Digital Sky Survey(SDSS) image of M15 superimposed with the footprint of the adopted cameras: LUCI1 (black square), PISCES (blue), ACS (magenta), and WFC3(red). The LUCI1 field (4¢ ´ ¢) was selected so asto4 include both the center of the cluster and the PISCES field, which is located 2′.7 from the center. Note the small FOV covered by the PISCES camera( 21 ´21). The HST/ACS field is centered on M15, but owing to the different position angle, it does not overlap with the PISCES pointing, which on the other hand falls into the HST/WFC3 set. Figure2presents a comparison of the LBT/LUCI1 (left), HST/WFC3 (center), and LBT/PISCES (right) regions, corresponding to the full FOV of the PISCES camera. Other than the impressive improvement when comparing data from the same telescope but without(left panel) and with (right panel) assistance from the AO, it is clear that PISCES provides the best spatial resolution also when compared to the WFC3(middle panel). It is worth noting that the three images are stacked medians;thus, the total exposure time is different in the three cases. Moreover, while the left and right panels show images in the Ks, we only
had available WFC3 images in the F160W filter, which is close to the H band. To highlight even more the PISCES performances, Figure3shows a zoom-in of the PISCES(left) and WFC3 (right) stacked images already shown in Figure2. The green squares mark a region of 5″ × 5″. The image discloses atfirst glance that the number of sources is similar in both cases, suggesting a similar limiting magnitude(it is worth
Table 2 ObservationLog
Telescope Sensor Filter Exposures Total Time (s) (s) LBT LUCI1 J 13× 20 13 × 40 780 Ks 26× 40 1040 PISCES J 20× 30 600 Ks 42× 15 630 HST WFC3 F160W 3× 200 6 × 250 2100
Figure 1. SDSS image of M15 superimposed with the fields of the different data sets collected for this project. Detailed analisys of the central PISCESfield will be presented in a forthcoming paper.
recalling here the shorter total exposure time in both PISCES J and Ks; see Table 2). On the other hand, the contrast in the
PISCES images is by far better, and one can easily see that elongated sources in the WFC3 field are well separated in the PISCES image, such as those next to the top left corner of the green square.
2.4. Data Reduction and Photometry
The acquisition and the basic reduction have been performed following a homogeneous approach for both PISCES and LUCI1 data: raw images have been secured by dithering the telescope within a 100 pixel random pattern to ensure good removal of bad pixels. Single images have been dark-subtracted, flat-fielded, resampled to remove geometrical distortions, and registered. For the Ksfilter, a superflat obtained
with the off-source sky images hasbeen obtained and applied to the images to improve the low-frequencyflat-field removal. The LUCI1 and WFC3 data have been independently reduced following the prescriptions of Monelli et al. (2010) and using a standard procedure based on the DAOPHOTIV/ ALLSTAR/ALLFRAME suite of programs (Stetson 1987, 1994). Individual PSFs have been modeled for each image, using semiautomatic routines. The input list of stars for ALLFRAME was generated registering and matching the individual catalogs from single images.
The case of the PISCES data deserved particular attention, because AO may provide PSFs characterized by spatial variations across the field due to anisoplanatism. This is especially true for the shorter-wavelength J-band images, while the PSF in the Ks is typically more stable even at the largest
distances from the guide stars, as it scales with the isoplanatic angle and progressively with the wavelength. Therefore, to perform the photometry on these images, we adopted the ROMAFOT suite of programs (Buonanno et al. 1983; Buo-nanno & Iannicola1989). The PSF photometry with ROMA-FOT is more lengthy when compared with similar packages available in the literature. However, it is has the key advantage of a graphical interface that allows the user to improve the local deconvolution of stellar profiles. The latest version of the code (I. Ferraro et al. 2015, in preparation) has been optimized to perform accurate photometry of crowded stellar fields on images collected with AO systems. In particular, it takes into account the spatial variation of the PSF across the FOV and the variation of the asymmetric, egg-like shape of the PSF. A preliminary discussion of the numerical algorithms and of the approach adopted to deal with the quoted images has already been presented in Fiorentino et al.(2014). In passing, we note that photometry performed using asymmetric PSFs on ground-based (LBT/LUCI1) and space (HST/WFC3) images gives magnitudes that are, within the errors, identical to those measured using other photometric packages.
Figure 2. Sky region covered by the PISCES camera (right) as seen also by LUCI1 (left) and the WFC3 (middle). Note the change in spatial resolution, from 0. 118 pixel−1(seeing limited), 0. 13 pixel−1(from space), 0. 026 pixel−1.
Figure 3. Zoom-in on the same PISCES (left) and WFC3 (right) images of Figure2. The green square highlights the same sky region of 5´ 5″. The comparison clearly shows the gain in spatial resolution of the PISCES data.
The final adopted photometry was obtained in two steps. First, ROMAFOT was run on the mean J- and Ks-band images
in order to create the master list of objects. The final photometry was obtained reducing the individual imagesand averaging the derived magnitudes. A Moffat analytic function was adopted to model the PSF, withβ = 2.0, 2.5 and σ = 2.70, 2.05 for the J and Ksimages, respectively.
Thefinal photometric catalogs were calibrated into the Two Micron All Sky Survey (2MASS) photometric system in two steps. First, the LUCI1 photometric catalog was calibrated using ∼200 stars in common with 2MASS and covering the entire FOV. Then three dozen local standards of the LUCI1 catalog were used to calibrate the photometric catalog based on PISCES images. In this context it is worth mentioning the crucial role that faint local standards play in the accurate calibration of images collected with AO systems. The use of NGS for the tip-tilt correction and the modest FOV of current AO systems implythe selection of crowded stellar fields. In these cluster regions the photometric quality of the 2MASS local standards is quite poor; moreover, even the faintest 2MASS stars are saturated in these regions. These are the reasons why the calibration of NIR images collected with AO systems does require a double step in the calibration using 4–8 m class telescopes to improve the limiting magnitude and the photometric accuracy of local standards(Bono et al.2010). Keeping in mind the above caveats, Figure 4 shows the approach we adopted to perform the absolute calibration. From left to right, the three rows show the residuals of the calibration as a function of magnitude (top: J; bottom: Ks), the
Xcoordinate, and the Y coordinate. Small dots indicate the 2MASS stars in common with LUCI1, while the open squares show the∼35 LUCI1 stars used as a local standard to calibrate the PISCES catalog. No apparent trends are visible, and the residuals have null mean.
3. RESULTS
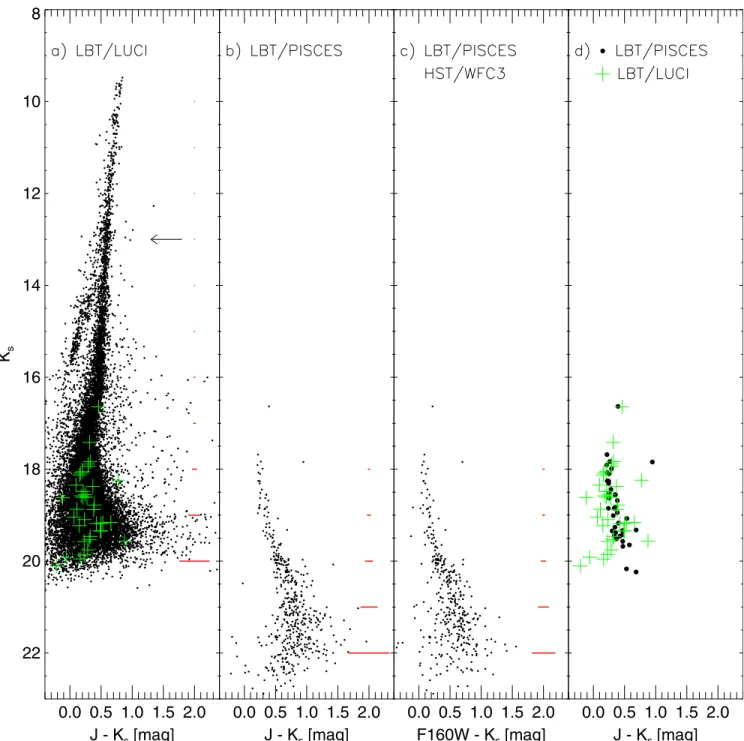
Figure 5 shows NIR CMDs of the central regions of M15 based on four different imagers. From left to right, the (Ks,
J-Ks) CMD is based on(a) LBT/LUCI1 covering anFOV
of 16 arcmin squared (∼17,000 stars); (b) the intersection of space F160W-band (HST/WFC3) and ground-based Ks-band
(LBT/PISCES) photometry covering an FOV of 0.19 arcmin squared(∼380 stars); and (c) LBT/PISCES covering an FOV of 0.19 arcmin squared (∼450 stars). The jump in limiting magnitude is compelling when moving from seeing-limited (LBT/LUCI1, (b)) to AO (LBT/PISCES, (c)) NIR images collected with the same telescope. Indeed, the use of the PISCES camera, together with the FLAO(Esposito et al.2012; Riccardi et al.2010), allows us to move the limiting magnitude in the Kband down to ≈22.5–23.0 mag. To our knowledge this is the deepest Ks-band photometry ever performed in a GC.
Panel (d) shows a direct comparison between the CMD of the stars in common with PISCES (large black dots) and LUCI1 (green plus signs). The two overlap over a magnitude range of ≈3.5 mag, from Ks»16.6 mag to Ks»20.1 mag.
The main sequence based on PISCES images is narrower than the LUCI1 one, and no systematics appear in the comparison (see also Figure4). Interestingly enough, the sequence of green symbols plotted in panel (a) discloses a smaller photometric dispersion than the bulk of the main-sequence stars in the LUCI1field. The difference is mainly due to the low crowding level of these cluster regions. Indeed, the 450 stars measured in
the PISCES FOV imply a density of 0.67 stars arcsec−2, that is, one star every ∼2330 pixel2. This context is quite different when compared with the central pointing, since in this region the typical stellar density is a factor of≈50 higher.
The CMD based on LUCI1 images allows the identification of the typical evolutionary features of a GC. It covers more than 10 mag in the Ksbandand ranges from the tip of the RGB
(Ks~9.5mag) down to ∼2 mag below the MSTO (Ks~ 18,
J-Ks~0.25mag). Moreover, M15 also shows a well-populated horizontal branch ranging from Ks~16.5 to Ks~14mag with a slope typical of NIR CMDs. Finally, the RGB bump appears clearly in the luminosity function of the RGB at magnitude Ks=13.000.05 mag, indicated by the arrow.
In spite of the good quality of LUCI1 photometry, it is thanks to PISCES and to the FLAO system that we have been able to identify, for thefirst time, the MSK (Ks~21.5mag) in a very metal-poor GC. The quality of the CMD based on LBT/ PISCES is further supported by the comparison with the CMD based on both space- and ground-based NIR images. Data plotted in panel (d) of Figure 5 show that the limiting magnitude in F160W is similar to the limiting magnitude in the Jband. However, the intrinsic error at fixed magnitude seems larger in F160W than in theJ-band CMD, and indeed the MSK cannot be easily identified in the above CMD. In passing, we also note that the exposure time in F160W is 3.5 times larger than the exposure time in the Jband.
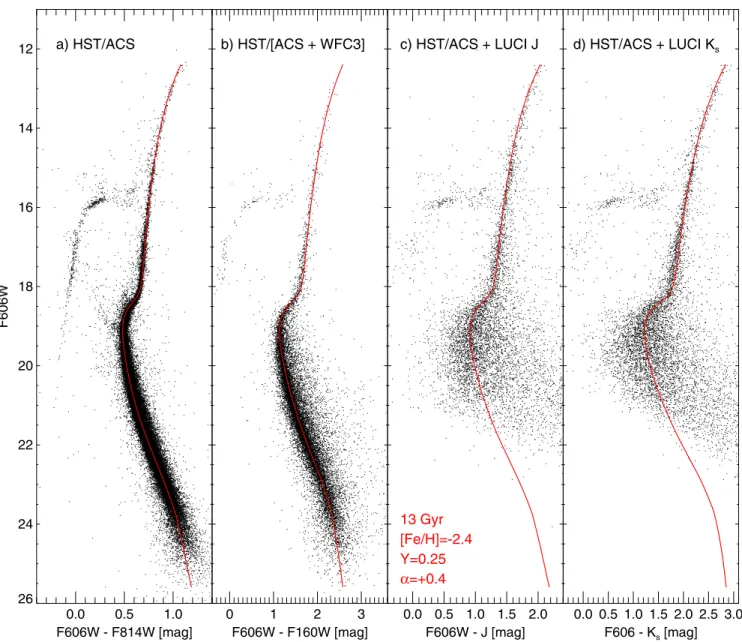
We are dealing with photometric catalogs that have been collected using different telescopes equipped with different imagers and different sets offilters. Their possible systematics might affect the absolute age estimates. To constrain this effect, Figures 6 and 7 show the comparison of selected cluster isochrones with our data. A glance at the data plotted in this figure clearly shows the advantage of using CMDs based on optical and NIR photometric data. Indeed, the optical–NIR CMDs do cover a range in color that is at least a factor of two larger compared with the optical ones. From left to right, Figure 6 shows(a) the optical CMD based on ACS images (F606W, F606W-F814W); (b) the optical–NIR CMD based on ACS and on WFC3 images(F606W, F606W-F160W); (c) the optical–NIR CMD based on ACS and on LUCI1 J-band images(F606W, F606W- ); and (d) the optical–NIR CMDJ based on ACS and on LUCI1 K-band images(F606W, F606W –Ks). The cluster isochrone was computed by adopting the
evolutionary tracks provided by VandenBerg et al.(2014). The isochrones were transformed into the observational plane by adopting the color–temperature relation by Casagrande & VandenBerg (2014). We adopted an iron abundance of [Fe/H] = −2.4 (Kraft & Ivans 2003), an α-enhancement of α = +0.4 (Sneden et al. 1997, 2000), primordial helium content of Y= 0.25, and a cluster age of 13 Gyr (red line). The current theoretical framework is fully consistent with the set of isochrones adopted by Bono et al. (2010). We performed a series of tests to constrain the optimal true distance modulus and reddening that provide a good simultaneous agreement between theory and observations in the four CMDs plotted in Figure5. We found, using the Cardelli et al.(1989) reddening law, that a cluster reddening of E B( -V) = 0.08 mag and a distance modulus of m( -M)0 = 15.14 mag (Harris 1996,
2010 edition) do provide a good agreement in the quoted optical–NIR CMDs. The cluster reddening agrees with the value suggested by Sandage et al. (1981)but is marginally
smaller than the more recent estimates by Schlafly & Finkbeiner (2011) (E B( -V) = 0.10). The true distance modulus agrees, within the errors, with different estimates available in the literature (Durrell & Harris 1993; van den Bosch et al. 2006). Note that the assumption of a larger extinction would imply, at fixed age, a systematic drift of the isochrones toward redder colors. The new discrepancy could be alleviated by a decrease in cluster age, but younger isochrones are characterized by a slope of the subgiant branch(SGB) that is too steep when compared with the data. This difference becomes more evident in the optical planes, where the SGB is remarkably thin. The above evidence indicates that adopted distance and reddening are mainly constrained by the morphology of the SGB and RGB,the former one playing a crucial role, since it is less affected by uncertainties in the adopted mixing length(Salaris & Cassisi 2015).
The CMDs plotted in panels(c) and (d) also suggest a good agreement between theory and observations. Indeed, only a marginal shift in color is present at the base of the RGB in the F606W, F606W -J CMD. The anonymous referee also noted a similar shift in the RGB region between the HB and the
base of the RGB. In the quoted cases, the isochrones are once again marginally redder than the observed RG stars. The above empirical evidence brings forward two relevant points:
1.Theory and observations disclose an overall very good agreement over more than 10 mag. The agreement becomes even more compelling if we take account of the fact that we are dealing with optical and NIR data collected with space- and ground-based facilities. Thisfinding also supports the adopted chemical composition, the bolometric corrections, and the color–temperature transformations, together with the adopted true distance modulus and cluster reddening. Similar results have also been obtained in the literature by different groups (Dotter et al.2008; Sarajedini et al.2009a; Bressan et al.2012; Dell’Omodarme et al. 2012; VandenBerg et al. 2014), thus further supporting the current accuracy era of stellar astrophysics.
2.The difference in color at the level of 0.03 mag between theory and observations has a marginal impact on the methods we are using to estimate the absolute cluster age. Indeed, they rely either on absolute (MSTO) or on relative magni-tudes(MSK).
Figure 4. Residuals of the calibrations as a function of magnitude (left),X coordinate (middle), and Y coordinate (right). Top and bottom rows refer to the J and Ks bands, respectively. Large dots show the more than 200 stars in common between the LUCI catalog and 2MASS. Big open squares compare the∼35 stars in common between LUCI1 and PISCES, at significantly fainter magnitude. Note that the rangesof X and Y are different because of the size of the two cameras.
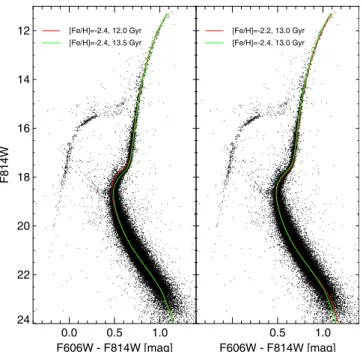
Figure 7 shows a comparison with isochrones for different assumptions on theα enhancement and the metal content. The left panel presents two isochrones of 12(red line) and 13.5 Gyr (green). The effect of age appears clearly in the MSTO region, but as expected, it affects neither the RGB nor the low main sequence. The right panel present two isochrones of 13 Gyr, with [Fe/H] = −2.2 and−2.4 (red and green line, respec-tively) for different age and metallicity assumptions.
4. THE ABSOLUTE AGE OF M15
To estimate the absolute age of M15, we devise here a double approach. Thefirst is based on the MSTO position, and the second on the magnitude difference between the MSTO and
the main MSK. Table 3 summarizes the observables and the cluster ages based on the two quoted methods. From left to right the columns give the adopted CMD, the imager, the apparent magnitude, the color index of the MSTO (mMSTO,
CIMSTO), and the color index of the MSK (mMSK, CIMSK),
together with the two cluster ages. 4.1. The TO Method
The position of the MSTO is determined in the observational planes to be the bluest MS point of the ridge line. Similarly, we estimate the magnitude and color index of the MSTO for a set of four isochrones of fixed metallicity ([Fe/H] = −2.4, α = +0.4, Y = 0.25) and age between 12.0 and 13.5 Gyr (see
Figure 5. K J( s, -Ks)CMDs of M15.(a) Data from LBT/LUCI1. The horizontal arrow marks the position of the RGB bump. The green plus signs show the stars in common with the PISCES photometry.(b)LBT/PISCES CMD of the outer M15 field. (c) Mixed CMD with HST/WFC3 [F160W] together with LBT/LUCI1 [Ks] data.(d) Comparison of the CMD of the stars in common between LUCI1 (green plus signs as in panel (a)) and PISCES (large black dots).
Section3) once rescaled for the proper distance and reddening. This allows us to determine that, at least in this age range, a linear relation exists between the MSTO magnitude and the age. The slopes of the above relations were obtained with a linear least-squares fit. The coefficients are listed in Table 4, together with the predicted magnitudes of the MSTO and of the MSK as a function of cluster age. These slopes are a measure of the sensitivity of the MSTO as an age indicator in the different bands. For example, we derive that the F606W band is ∼1.8 times more accurate than the Ks band.
The age corresponding to M15 is derived by interpolating the previous relations assuming the observed MSTO magni-tude. The error budget has to take into account various sources, including error on the photometric calibration, the MSTO magnitude, the reddening, and distance.12 In the case of the present data set, the photometric error varies depending on the filter used, from ∼0.011 in the case of the F814W filter to
∼0.04 mag for the LUCI1 Ks. Nevertheless, while the
differential reddening is almost negligible along the line of sight of M15 (E B( -V) = 0.08 ± 0.01 mag;Sandage et al. 1981), the dominant source of error is the distance (±0.15 mag;Durrell & Harris 1993). We derive an absolute age ranging from 12.8± 2.0 (F814W band) to 14.0 ± 3.0 Gyr (Ks), with a weighted mean value of 12.9 ± 2.6 Gyr.
4.2. The MSK Method
The second approach is based on the magnitude difference between the MSTO and the MSK,DM MSTO( -MSK). This method is based on the fact that the magnitude and color of the MSK in the low-mass regime of the MS are, atfixed chemical composition, essentially independent of cluster age (Bono et al.2010). The key advantage of the MSK is that it is caused by collision-induced absorption opacities of both H2–H2 and
H2–He in the surface of cool dwarfs (Borysow et al. 2001;
Borysow 2002). The MSK is independent of cluster age and anchored in a region of the MS that is marginally affected by uncertainties in the treatment of the convective regime that is nearly adiabatic (Saumon & Marley 2008). Recent empirical
Figure 6. Optical and NIR CMDsbased on HST data superimposed with the same isochrone for the labeled parameters.
12
The error in the age is totally dominated by the propagated error in the distance estimate. We note that the distance value from van den Bosch et al. (2006) provides an error a factor of 2 smaller, which would imply a reduction
evidence indicates that the errors in the absolute age of GCs based on this method are on average a factor of two smaller than the canonical ones (Bono et al. 2010; Di Cecco et al.2015).
Therefore, this method offers a powerful observable to constrain the cluster age either as a color or as a magnitude difference between the bend and the cluster MSTO, using both optical and infrared filter combinations. In the case of the present data set, we determined the position of both points using the ridge line of the cluster in the different CMDs (see, e.g., Di Cecco et al. 2015). Note that the lack of a sizable sample of MSTO stars in the PISCES photometry is a direct consequence of the modest FOV covered by the camera and by the radial distance of the pointing. To constrain on a more quantitative basis this relevant issue, we selected the same cluster region covered by PISCES in the LUCI1 photometry, and we found that it only includes 35 stars and that the bulk of them are located at magnitudes fainter than the MSTO (see panel(d)of Figure5).
To overcome this issue, we merged the LUCI1 and PISCES CMDsand derived a unique ridge line. In this way, the TO region is sampled by the large number of stars in the LUCI1 photometry, while the MSK is sampled by the PISCES deep catalog. In particular, following Bono et al. (2010), we define the color and magnitude of the MSK at the maximum curvature point in the low part of the MS. The outcome is shown in Figure8, where the combined LUCI1 and PISCES CMDs are shown, together with the cluster ridge line, the MSTO, and the MSK. The approach adopted to compute the cluster ridge line has been discussed in detail by Di Cecco et al. (2015). The corresponding theoretical points were estimated using the same approach on the same isochrones adopted to estimate the cluster absolute age with the canonical MSTO method.
Similarly to the age determination based on the MSTO, we derive linear relations betweenDM MSTO( -MSK) and the age (see Table 4). In this case, the method is slightly more sensitive than adopting the absolute value of the MSTO, by
∼15%. The age is therefore derived by interpolating the empirical value derived from the CMDs, and it is reported in the last columns of Table 3. The estimated age ranges from 12.9± 0.9 (F606W band) to 13.7 ± 1.0 Gyr (Ks), with amean
value of 13.3± 1.1 Gyr.
4.3. Comparison with Literature Values
The values shown in the last two columns ofTable 3 disclose a general good agreement between the two derived age values. The estimate derived with the (K Js, -Ks) CMD is
marginally higher than the other ones, but still well within the error bars. Also, the age derived with the MSTO is 0.3–0.9 Gyr smaller than the corresponding value derived with the MSK approach.
The age of M15 has been subject to a large number of investigations (e.g., Salaris et al. 1997; Salaris & Weiss 1998, 2002; McNamara et al. 2004; De Angeli et al.2005). We stress that a straight comparison of literature estimates is complicated by the different theoretical scenarios adopted. However, the age derived here is in good agreement with recent estimates available in the literature(12.8 ± 0.6 Gyr, Marín-Franch et al.2009; 12.75± 0.25 ± 1.5 Gyr, VandenBerg et al.2013). Notably, these estimates are based on a difference approach. The former analysis usesthe relative age of a population of clusters, anchored to an absolute scale using clusters with well-determined distance (NGC 6752 via the subdwarf-based method). The latter uses the absolute magni-tude of the MSTO. Note that we are using the same set of optical data as VandenBerg et al. (2013), and indeed we independently obtain a perfectly consistent value of the age based on the MSTO luminosity, close to 12.8 Gyr.
5. DISCUSSION
5.1. Comparison with NGC 3201 and Metallicity Dependence In the present work we studied NIR photometry of the very metal-poor cluster M15. Nonetheless, it is interesting to extend the analysis to a more metal-rich regime in order to explore the dependency of theDM MSTO( -MSK) method on both the age and the metallicity of the target system. Bono et al.(2010) presented a similar analysis for the cluster NGC 3201([Fe/H] ∼ −1.5). By adopting the same theoretical framework applied here, we derive analogous linear relations correlating the magnitude differenceDM MSTO( -MSK) with age, assum-ing [Fe/H] = −1.5. The obtained derivatives (e.g.,0.13 ± 0.01 mag Gyr−1 and 0.08± 0.01 mag Gyr−1 for
the F606W and the Ks band, respectively) are very similar to
those derived for more metal-poor isochrones suitable for M15. This supports that theDM MSTO( -MSK)diagnostic can be fruitfully used over a wide range of metallicities.
Moreover, by comparing the absolute position of the MSK in different isochrones, we find that(i) at fixed metallicity, the magnitude of the MSK changes by at most 0.02 mag, for ages larger than 10.5 Gyr;(ii) similarly, at fixed age the MSK moves by∼0.02 mag, when moving from [Fe/H] = −2.4 to [Fe/H] = −1.5. Interestingly, these values seem independent of the wavelength, at least in the spectral range covered by the F606W to Ksthe passbands. Overall, the position of the MSK
seems to be a reliable anchor, marginally dependent on the age and the metallicity, at least in the ranges investigated so far. However, a more systematic theoretical investigation is needed, in order to constrain in detail the sensitivity of the MSK, and in
Figure 7. Comparison with isochrones of different ages (left) and metallicities (right).
turn of theDM MSTO( -MSK)method, over the full range of ages and metallicities typical of Galactic GCs.
5.2. Cosmological Implications
There is mounting evidence that we are in the era of precision cosmology. Recent estimates of the Hubble constant suggest a precision of the order of 3%(74.3 ± 2.1 km s−1Mpc−1, Freed-man et al. 2012; 73.8± 2.4 km s−1Mpc−1, Riess et al.2011). Plain physical arguments suggestthat, in a flat universe, the age of the universe(t0) is connected with the Hubble constant (H0),
the matter density parameter(W ), and the dark energy densitym
(WL)by the following relation(Dekel et al.1997):
t0=[1- W -( m 0.7WL) 5.8] (1.3´h0) ( )1 where h0= H0/100 km s−1Mpc−1is the current expansion rate
of the universe and t0is the age of the universe today in units of
1010Gyr.
Using the recent estimates of the cosmological parameters provided by WMAP and Planck (W =0.315m -+0.0180.016,
0.685 0.016 0.018
W =L -+ ; Hinshaw et al. 2013; Planck Collaboration
et al. 2014), we found t0 = 10.70 ± 0.82 Gyr.13 The above
cosmological age is within 1σ of current stellar ages. However, it is on the short limit if we also take account of the time for structure formation (z ∼ 8, t < 1 Gyr). A similar approach to constrain the age of the universe today is to use, together with the above cosmological parameters,the estimate of H0
provided by Planck+WMAP (H0= 67.3± 1.2 km s−1Mpc−1).
It is worth mentioning that H0is a prior in the CMB solution
ranging from 20 to 100 km s−1Mpc−1. Note that in this context the precision on H0 is of the order of 1.8%. The age of the
universe we found is t0= 11.75 ± 0.21 Gyr, while the detailed
inversion of the CMB maps provides t0= 13.817 ± 0.048 Gyr.
The above estimates appear in quite good agreement with the current absolute ages of oldest GCs, and we note that a smaller age of 10.71± 0.50 Gyr is derived assuming the H0value from
Riess et al.(2011).
However, we are facing the evidence that the uncertainties on cosmological ages are systematically smaller than 1 Gyr for estimates based on H0and become smaller than a few hundreds
of Myrfor CMB determinations. On the other hand, the uncertainties affecting the absolute age of GCs rangefrom 2 (MSTO) to 1 (MSK) Gyr. The difference in precision between cosmological and stellar ages is going to become even more prominent, since the next generation of experiments (Riess et al.2011; Freedman et al.2012) plans to improve by a factor of two the precision on H0. Taken at face value,the “stellar”
estimates do not allow us to validate the evaluations provided by cosmology. It is clear that accurate absolute ages for a sizable sample of extremely metal-poor GCs can shed new lighton this long-standing and intriguing problem.
6. CONCLUSIONS AND FUTURE REMARKS We have presented new NIR data of the metal-poor GC M15 obtained with the LUCI1 and PISCES cameras available at the LBT, and complemented with archival optical and NIR HST data. The analysis of the data raised important points: (i) the ground-based AO camera can compete with the HST in terms of photometric depth and resolving power in moderately crowded stellar fields, with a smaller investment of telescope
Table 3 Age Determinations
CMD Cameras mMSTO CIMSTO mMSK CIMSK tMSTO tMSTO–MSK F814W F, 606W-F814W ACS 18.801± 0.011 0.490± 0.016 21.642± 0.036 0.829± 0.052 12.8± 2.0 13.3± 0.6 F160W F, 814W-F160W WFC3+ACS 18.027± 0.040 0.652± 0.041 20.296± 0.051 1.045± 0.059 12.5± 2.7 13.4± 1.3 F160W F, 606W-F160W WFC3+ACS 18.027± 0.040 1.147± 0.041 20.377± 0.051 1.838± 0.061 12.6± 2.7 12.9± 1.3 K Js, -Ks PISCES 18.010± 0.043 0.238± 0.044 20.160± 0.290 0.581± 0.299 14.0± 3.1 13.7± 1.4 Table 4 Magnitude vs.AgeDerivatives
Mag dMag(TO)/dt dMag(TO-MSK)/dt
F606W 0.09± 0.01 0.11± 0.01
F814W 0.08± 0.01 0.09± 0.01 J 0.06± 0.02 0.07± 0.02
F160W 0.06± 0.01 0.07± 0.01
Ks 0.05± 0.02 0.06± 0.02 Mag dCI(TO)/dt dCI(TO-MSK)/dt
F606W-F814W 0.01± 0.01 0.02± 0.01
F606W-F160W 0.03± 0.01 0.02± 0.01 J–Ks 0.01± 0.01 0.01± 0.01
Figure 8. K J( , -K) CMDs from LBT data(black: LUCI1; red: PISCES) superimposed with the derived ridge line. The big dots mark the MSTO and MSK points.
13
Note that we did not assume an Eisten–de Sitter cosmological model (W = , Wm 1 L= 0) because the age of the universe we obtain is systematically younger (t0 = 8.6 ± 0.28 Gyr) than suggested by recent “stellar” and
time;(ii) tests performed with the ROMAFOT package suggest that the data reduction of images from the AO instrument requires the development of novel techniques to model the complicated PSF of these imagers.
The MSK is an important feature in the CMD of GCs that can help revise the age of these fundamental stellar systems. The obvious advantage of using the DM MSTO( -MSK) approach, being a differential measurement, is that it is not affected by the errors either in the distance or in the reddening. This is reflected in the significantly smaller error bars in the age determinations. The analysis presented in this paper reveals that different photometric bands provide different sensitivity to the method. In this sense, the sensitivity decreases for increasing wavelength from the optical to the near-infrared.
Our data analysis allowed us, using the PISCES data, to measure the MSK along the main sequence of M15. We use two diagnostics to estimate the absolute age of this cluster: the magnitude of the MSTO and the magnitude difference
M MSTO( MSK)
D - . The two methods provide consistent
resultsand a mean absolute age of 12.9 ± 2.6 Gyr and 13.0 ± 1.1 Gyr, respectively.
A systematic theoretical analysis of the dependence of the MSK magnitude over a wide range of ages and metallicities is mandatory to firmly establish the uncertainties affecting the
M MSTO( MSK)
D - method. Nonetheless, our results sug-gest that using high-quality, optical databases such as those based on existing HST data can provide a fundamental starting point to globally revise the age of the GC systems. The PISCES data presented here soundly demonstrate the potential of ground-based NIR data using AO technology to obtain deep photometry in crowded stellar fields. Moreover, current ongoing observing facilities at the 10 m class telescopes using either SCAO (FLAO at LBT) or MCAO (GEMS at Gemini South)are providing excellent data reaching the MSK in many Galactic GCs (NGC 1815, Turri et al.2014,2015). The same outcome applies to near-future facilities such as ERIS at ESO VLT. Nevertheless, a giant leap forward is foreseeable when the next generation of extremely large telescopes, equipped with NIR detectors and AO systems (e.g., Deep et al. 2011; Greggio et al. 2012; Schreiber et al. 2014), is available: the Giant Magellan Telescope (GMT),14the Thirty Meter Tele-scope(TMT),15and the European Extremely Large Telescope (E-ELT).16
Realistic predictions according to up-to-date instrumental specifications for the E-ELT+Maory+Micado configuration suggest that the predicted limiting magnitude (K~27.2 assuming a crowding level expected for the core of a GC;e.g., Deep et al. 2011), is significantly fainter than the expected MSK magnitude for any stellar system in the Milky Way halo (within 100 kpc, MSK ∼ 24.5). This is true also when restricting to a relatively short integration time of 600 s, comparable with that of the PISCES data presented in this paper. Preliminary analysis suggests that the error bar on the age will be smaller than 1 Gyr for the entire sample of GCs. This means that we will be able to successfully apply this method, for the first time, also to the nearby Local Group galaxies and their GCs.
The authors warmly thank Don VandenBerg for sharing the new set of isochrones prior to publication. Support for this work has been provided by the Education and Science Ministry of Spain(grant AYA2010-16717). G.F. has been supported by the Futuro in Ricerca 2013 (grant RBFR13J716). This work was partially supported by PRIN–INAF 2011 “Tracing the formation and evolution of the Galactic halo with VST” (P.I.: M. Marconi) and by PRIN–MIUR (2010LY5N2T) “Chemical and dynamical evolution of the Milky Way and Local Group galaxies” (P.I.: F. Matteucci).
REFERENCES
An, D., Pinsonneault, M. H., Masseron, T., et al. 2009a,ApJ,700, 523
An, D., Ramírez, S. V., Sellgren, K., et al. 2009b,ApJL,702, L128
Bedin, L. R., Piotto, G., Anderson, J., et al. 2004,ApJL,605, L125
Bennett, C. L., Larson, D., Weiland, J. L., & Hinshaw, G. 2014,ApJ,794, 135
Bono, G., Calamida, A., Corsi, C. E., et al. 2009, in Science with the VLT in the ELT Era, ed. A. Moorwood(Houten: Springer),67
Bono, G., Stetson, P. B., VandenBerg, D. A., et al. 2010,ApJL,708, L74
Borysow, A. 2002,A&A,390, 779
Borysow, A., Jorgensen, U. G., & Fu, Y. 2001,JQSRT,68, 235
Braga, V. F., Dall’Ora, M., Bono, G., et al. 2015,ApJ,799, 165
Bressan, A., Marigo, P., Girardi, L., et al. 2012,MNRAS,427, 127
Buonanno, R., Buscema, G., Corsi, C. E., Ferraro, I., & Iannicola, G. 1983, A&A,126, 278
Buonanno, R., & Iannicola, G. 1989,PASP,101, 294
Cardelli, J. A., Clayton, G. C., & Mathis, J. S. 1989,ApJ,345, 245
Carretta, E., Bragaglia, A., Gratton, R., D’Orazi, V., & Lucatello, S. 2009,
A&A,508, 695
Casagrande, L., & VandenBerg, D. A. 2014,MNRAS,444, 392
Cassisi, S. 2014, MmSAI,85, 498
Cassisi, S., Potekhin, A. Y., Pietrinferni, A., Catelan, M., & Salaris, M. 2007,
ApJ,661, 1094
Cassisi, S., Salaris, M., Pietrinferni, A., et al. 2008,ApJL,672, L115
Cohen, J. G. 1978,ApJ,223, 487
Cuesta, A. J., Verde, L., Riess, A., & Jimenez, R. 2015,MNRAS,448, 3463
Davies, R., Ageorges, N., Barl, L., et al. 2010,Proc. SPIE,7735, 77352A
De Angeli, F., Piotto, G., Cassisi, S., et al. 2005,AJ,130, 116
Deep, A., Fiorentino, G., Tolstoy, E., et al. 2011,A&A,531, A151
Dekel, A., Burstein, D., & White, S. D. M. 1997, in Critical Dialogues in Cosmology, ed. N. Turok(Singapore: World Scientific),175
Dell’Omodarme, M., Valle, G., Degl’Innocenti, S., & Prada Moroni, P. G. 2012,A&A,540, A26
Denissenkov, P. A., & Weiss, A. 2004,ApJ,603, 119
Di Cecco, A., Faustini, F., Paresce, F., Correnti, M., & Calzoletti, L. 2015,
ApJ,799, 100
Dotter, A., Chaboyer, B., Jevremović, D., et al. 2008,ApJS,178, 89
Dotter, A., Sarajedini, A., & Anderson, J. 2011,ApJ,738, 74
Durrell, P. R., & Harris, W. E. 1993,AJ,105, 1420
Dvorkin, C., Wyman, M., Rudd, D. H., & Hu, W. 2014, PhRvD,90, 083503
Efstathiou, G. 2014,MNRAS,440, 1138
Eisenstein, D. J., Zehavi, I., Hogg, D. W., et al. 2005,ApJ,633, 560
Esposito, S., Riccardi, A., Pinna, E., et al. 2012,Proc. SPIE,8447, 84470u
Esposito, S., Riccardi, A., Quirós-Pacheco, F., et al. 2010, ApOpt, 49, G174 Ferraro, F. R., Dalessandro, E., Mucciarelli, A., et al. 2009,Natur,462, 483
Fiorentino, G., Ferraro, I., Iannicola, G., et al. 2014, arXiv:1407.2011
Fiorentino, G., Tolstoy, E., Diolaiti, E., et al. 2011,A&A,535, A63
Freedman, W. L., & Madore, B. F. 2010,ARA&A,48, 673
Freedman, W. L., Madore, B. F., Scowcroft, V., et al. 2012,ApJ,758, 24
Gratton, R. G., Lucatello, S., Carretta, E., et al. 2012,A&A,539, A19
Greggio, L., Falomo, R., Zaggia, S., Fantinel, D., & Uslenghi, M. 2012,PASP,
124, 653
Harris, W. E. 1996,AJ,112, 1487
Hinshaw, G., Larson, D., Komatsu, E., et al. 2013,ApJS,208, 19
Kraft, R. P. 1994,PASP,106, 553
Kraft, R. P., & Ivans, I. I. 2003,PASP,115, 143
Lagioia, E. P., Milone, A. P., Stetson, P. B., et al. 2014,ApJ,782, 50
Leep, E. M., Wallerstein, G., & Oke, J. B. 1986,AJ,91, 1117
Le Fèvre, O., Saisse, M., Mancini, D., et al. 2003,Proc. SPIE,4841, 1670
Marchetti, E., Hubin, N. N., Fedrigo, E., et al. 2003,Proc. SPIE,4839, 317
Marín-Franch, A., Aparicio, A., Piotto, G., et al. 2009,ApJ,694, 1498
14
www.gmto.org/
15www.tmt.org/ 16
McCarthy, D. W., Jr., Ge, J., Hinz, J. L., Finn, R. A., & de Jong, R. S. 2001,
PASP,113, 353
McNamara, B. J., Harrison, T. E., & Baumgardt, H. 2004,ApJ,602, 264
Milone, A. P., Bedin, L. R., Piotto, G., et al. 2008,ApJ,673, 241
Milone, A. P., Marino, A. F., Bedin, L. R., et al. 2014,MNRAS,439, 1588
Milone, A. P., Marino, A. F., Cassisi, S., et al. 2012,ApJL,754, L34
Monelli, M., Hidalgo, S. L., Stetson, P. B., et al. 2010,ApJ,720, 1225
Monelli, M., Milone, A. P., Stetson, P. B., et al. 2013,MNRAS,431, 2126
Moretti, A., Piotto, G., Arcidiacono, C., et al. 2009,A&A,493, 539
Neichel, B., Lu, J. R., Rigaut, F., et al. 2014a,MNRAS,445, 500
Neichel, B., Rigaut, F., Vidal, F., et al. 2014b,MNRAS,440, 1002
Osborn, W. 1971, Obs,91, 223
Pietrinferni, A., Cassisi, S., Salaris, M., & Castelli, F. 2004,ApJ,612, 168
Pietrinferni, A., Cassisi, S., Salaris, M., Percival, S., & Ferguson, J. W. 2009,
ApJ,697, 275
Pilachowski, C. A., Sneden, C., & Wallerstein, G. 1983,ApJS,52, 241
Piotto, G., Bedin, L. R., Anderson, J., et al. 2007,ApJL,661, L53
Piotto, G., Milone, A. P., Bedin, L. R., et al. 2015,AJ,149, 91
Piotto, G., Villanova, S., Bedin, L. R., et al. 2005,ApJ,621, 777
Planck Collaboration, Ade, P. A. R., Aghanim, N., et al. 2014, A&A,571, A16
Planck Collaboration, Ade, P. A. R., Aghanim, N., et al. 2015, arXiv:1502.01589
Pulone, L., de Marchi, G., & Paresce, F. 1999, A&A,342, 440
Pulone, L., Salaris, M., Weiss, A., & Buonanno, R. 1998, A&A,336, L77
Ragazzoni, R. 1996, JMOp,43, 289
Riccardi, A., Xompero, M., Briguglio, R., et al. 2010,Proc. SPIE, 7736, 2 Riess, A. G., Filippenko, A. V., Challis, P., et al. 1998,AJ,116, 1009
Riess, A. G., Macri, L., Casertano, S., et al. 2011,ApJ,730, 119
Rigaut, F., Neichel, B., Boccas, M., et al. 2014,MNRAS,437, 2361
Salaris, M., & Cassisi, S. 2015,A&A,577, A60
Salaris, M., Degl’Innocenti, S., & Weiss, A. 1997,ApJ,479, 665
Salaris, M., & Weiss, A. 1998, A&A,335, 943
Salaris, M., & Weiss, A. 2002,A&A,388, 492
Salinari, P., Del Vecchio, C., & Biliotti, V. 1994, in European Southern Observatory Conf. and Workshop Proc. 48, ed. F. Merkle(Garching bei München: European Southern Observatory), 247
Sandage, A., Katem, B., & Sandage, M. 1981,ApJS,46, 41
Saracino, S., Dalessandro, E., Ferraro, F. R., et al. 2015,ApJ,806, 152
Sarajedini, A., Bedin, L. R., Chaboyer, B., et al. 2007,AJ,133, 1658
Sarajedini, A., Dotter, A., & Kirkpatrick, A. 2009a,ApJ,698, 1872
Sarajedini, A., Mancone, C. L., Lauer, T. R., et al. 2009b,AJ,138, 184
Saumon, D., & Marley, M. S. 2008,ApJ,689, 1327
Schlafly, E. F., & Finkbeiner, D. P. 2011,ApJ,737, 103
Schlegel, D. J., Finkbeiner, D. P., & Davis, M. 1998,ApJ,500, 525
Schreiber, L., Greggio, L., Falomo, R., Fantinel, D., & Uslenghi, M. 2014,
MNRAS,437, 2966
Sneden, C., Johnson, J., Kraft, R. P., et al. 2000,ApJL,536, L85
Sneden, C., Kraft, R. P., Shetrone, M. D., et al. 1997,AJ,114, 1964
Stetson, P. B. 1987,PASP,99, 191
Stetson, P. B. 1994,PASP,106, 250
Stetson, P. B., Braga, V. F., Dall’Ora, M., et al. 2014,PASP,126, 521
Suntzeff, N. B., & Smith, V. V. 1991,ApJ,381, 160
Suyu, S. H., Auger, M. W., Hilbert, S., et al. 2013,ApJ,766, 70
Suyu, S. H., Marshall, P. J., Auger, M. W., et al. 2010,ApJ,711, 201
Turri, P., McConnachie, A. W., Stetson, P. B., et al. 2014, Proc. SPIE,9148, 91483V
Turri, P., McConnachie, A. W., Stetson, P. B., et al. 2015, ApJ, submitted VandenBerg, D. A., Bergbusch, P. A., Ferguson, J. W., & Edvardsson, B.
2014,ApJ,794, 72
VandenBerg, D. A., Brogaard, K., Leaman, R., & Casagrande, L. 2013,ApJ,
775, 134
van den Bosch, R., de Zeeuw, T., Gebhardt, K., Noyola, E., & van de Ven, G. 2006,ApJ,641, 852
Ventura, P., D’Antona, F., Mazzitelli, I., & Gratton, R. 2001,ApJL,550, L65
Wyman, M., Rudd, D. H., Vanderveld, R. A., & Hu, W. 2014, PhRvL,112, 051302