doi: 10.3389/fneur.2020.00113
Edited by: Rosanna Cardani, IRCCS Policlinico San Donato, Italy Reviewed by: Corrado Italo Angelini, University of Padova, Italy Stojan Z. Peric, Faculty of Medicine, University of Belgrade, Serbia *Correspondence: Laura Serra [email protected]
Specialty section: This article was submitted to Neuromuscular Diseases, a section of the journal Frontiers in Neurology Received: 29 October 2019 Accepted: 31 January 2020 Published: 28 February 2020 Citation: Serra L, Bianchi G, Bruschini M, Giulietti G, Domenico CD, Bonarota S, Petrucci A, Silvestri G, Perna A, Meola G, Caltagirone C and Bozzali M (2020) Abnormal Cortical Thickness Is Associated With Deficits in Social Cognition in Patients With Myotonic Dystrophy Type 1. Front. Neurol. 11:113. doi: 10.3389/fneur.2020.00113
Abnormal Cortical Thickness Is
Associated With Deficits in Social
Cognition in Patients With Myotonic
Dystrophy Type 1
Laura Serra1*, Guendalina Bianchi1, Michela Bruschini1, Giovanni Giulietti1, Carlotta Di Domenico1, Sabrina Bonarota1, Antonio Petrucci2, Gabriella Silvestri3, Alessia Perna3, Giovanni Meola4, Carlo Caltagirone5and Marco Bozzali1,6
1Neuroimaging Laboratory, IRCCS Fondazione Santa Lucia, Rome, Italy,2UOC Neurologia e Neurofisiopatologia, AO San
Camillo Forlanini, Rome, Italy,3Department of Geriatrics, Orthopedic and Neuroscience, Institute of Neurology, Catholic
University of Sacred Heart, Rome, Italy,4Department of Neurorehabilitation Sciences, Casa Cura Policlinico, Milan, Italy, 5Department of Clinical and Behavioral Neurology, IRCCS Fondazione Santa Lucia, Rome, Italy,6Brighton & Sussex Medical
School, CISC, University of Sussex, Brighton, United Kingdom
Aim: To investigate the cortical thickness in myotonic dystrophy type 1 (DM1) and its potential association with patients’ genetic triplet expansion and social cognition deficits. Methods: Thirty patients with DM1 underwent the Social Cognition Battery Test and magnetic resonance imaging (MRI) scanning at 3 T. Twenty-five healthy subjects (HSs) were enrolled in the study to serve as a control group for structural MRI data. To assess changes in cortical thickness in DM1 patients, they were compared to HSs using a
t-test model. Correlations were used to assess potential associations between genetic and clinical characteristics and social cognition performances in the patient group. Additionally, multiple regression models were used to explore associations between cortical thickness, CTG triplet expansion size, and scores obtained by DM1 patients on the Social Cognition Battery.
Results: DM1 patients showed low performances in several subtests of the Social Cognition Battery. Specifically, they obtained pathological scores at Emotion Attribution Test (i.e., Sadness, Embarrassment, Happiness, and Anger) and at the Social Situations Test (i.e., recognition of normal situation, recognition of aberrant behavior). Significant negative correlations were found between CTG triplet expansion size and Embarrassment, and Severity of Aberrant Behavior. Similarly, a negative correlation was found between patients’ MIRS scores and Sadness. DM1 patients compared to HSs showed reduced thickness in the right premotor cortex, angular gyrus, precuneus, and inferior parietal lobule. Significant associations were found between patients’ CTG triplet expansion size and thickness in left postcentral gyrus and in the left primary somatosensory cortex, in the posterior cingulate cortex bilaterally, and in the right lingual gyrus. Finally, significant associations were found between cortical thickness and sadness in the superior temporal gyrus, the right precentral gyrus, the right angular gyrus, and the left medial frontal gyrus bilaterally. DM1 patients showed a negative correlation between cortical thickness in the bilateral precuneus and in the left lateral occipital cortex
and performance at the Social Situations Test. Finally, DM1 patients showed a negative correlation between cortical thickness in the left precuneus and in the superior frontal gyrus and scores at the Moral Distinction Test.
Discussion: The present study shows both cortical thickness changes in DM1 patients compared to controls and significant associations between cortical thickness and patients’ social cognition performances. These data confirm the presence of widespread brain damages associated with cognitive impairment in DM1 patients.
Keywords: myotonic dystrophy type-1, social cognition, cortical thickness, MRI, emotions
INTRODUCTION
Myotonic dystrophy type 1 (DM1) is an autosomal dominant neuromuscular disease (1). The genetic defect in DM1 results from the dynamic expansion of CTG repeats in the 3′ untranslated region of the dystrophia myotonica protein kinase (DMPK) region (1–3). Despite the prominent involvement of the muscular tissue remaining as the core feature of DM1, there is now substantial evidence that central nervous system abnormalities play a dominant role in accounting for highly impacting cognitive deficits in DM1 patients. Consistent evidence has been produced proving that structural and functional changes in DM1 brains account for some specific higher-level dysfunctions. So far, structural magnetic resonance imaging (MRI) studies have mainly focused on the assessment of regional gray matter volumetric and microstructural changes of the white matter tissue (4–12). Importantly, a strict relationship has been reported not only between structural brain abnormalities and DM1 patients’ cognitive profile (e.g., executive functions, reasoning and visuospatial abilities) (7, 9) but also with patients’ CTG triplet expansion (6,8,13). When looking at functional brain connectivity, abnormalities in specific networks have been identified to account for DM1 patients’ personality traits (14), as well as for some complex cognitive impairments (8, 15) in the domain of social cognition (SC) (16). This is particularly relevant considering that higher-order neuropsychological dysfunctions, including SC, dominate the cognitive profile of DM1 patients who, conversely, perform relatively well on tests exploring single neuropsychological domains (e.g., memory, language, etc).
Social cognition involves different abilities such as Theory of Mind (ToM), emotion recognition and attribution, moral/non-moral judgments, decision making, and empathy. These abilities interact with each other to allow a socially appropriate behavior to be maintained in daily life (17). Deficits in any aspect of SC may result in an inappropriate behavior with different degrees of severity, depending on the extension of the underlying brain damage. Social cognition deficits have been consistently reported not only in patients with frontal brain lesions but also in patients with neurodevelopmental disorders such as autism or neurodegeneration such as the behavioral variant of the frontotemporal dementia (18). In DM1 patients, we recently identified functional brain abnormalities within networks implicated in ToM ability (16). Emotion
recognition–wise, specific deficits have also been reported in patients with DM1 (19), although there are no available studies exploring their neurobiological substrate.
The aim of the present study was to investigate the neurobiological substrate of SC deficits in patients with DM1 by focusing on emotion attribution and moral/non-moral judgment abilities. Quantitative measures of cortical thickness were used here with the working hypothesis that focal brain changes might help understand these higher-level dysfunctions.
MATERIALS AND METHODS
Participants
This study is part of broader research program that investigates the neural correlates of various aspects of SC in patients with DM1. We first investigated the association between ToM abilities and functional connectivity, as reported in Serra et al. (16). Then, we extended this investigation to emotion attribution, social situation, and moral–non-moral judgment abilities in a cohort of subjects that includes a large part of those already included in the former study (n = 26) (16), and we focused our investigation on the cortical thickness. In total, 30 patients with a molecular diagnosis of DM1 were recruited from the Neuromuscular and Neurological Rare Diseases Centre at San Camillo Forlanini Hospital (Rome, Italy) and from the Institute of Neurology at the Fondazione Policlinico Universitario A. Gemelli, IRCCS (Rome, Italy). In order to exclude the presence of a major cognitive impairment or mental retardation, patients had to be all suffering from a childhood, juvenile, or adulthood form of DM, as classified by the International Myotonic Dystrophy Consortium (IDMC) nomenclature (20), and they had to report a Mini Mental State Examination score (21) above 26. In addition, all patients had to show a normal level of intelligence quotient and no impairment in the comprehension ability, (16), anosognosia, or failures in school achievement. The CTG expansion size within the DMPK gene was assessed for all DM1 patients and used to classify them according to the IDMC nomenclature (2000). The Muscular Impairment Rating Scale (MIRS) (22) was used to clinically characterize the severity of muscle phenotype in DM1 patients. Twenty-five healthy subjects (HSs) were also recruited, at the Santa Lucia Foundation (Rome) and served as controls for MRI data analysis. They were recruited by public advertisement whose material was reviewed and approved by the local ethics committee. They were recruited from the same geographical
TABLE 1 | Demographic and clinical characteristics of participants. DM1 patients n = 30 HS n = 25 p-value Mean (SD) age, y 41.9 (12.7) 39.0 (11.8) 0.385a Gender (F/M) 15/15 13/12 0.882b
Mean (SD) years of formal education
12.2 (2.4) 16.3 (1.9) 0.0001a
This table reports mean standard deviation (SD) and statistics (one-way analysis of variance or χ2) for demographic data (age, years of formal education, and gender
distribution) in patients with DM1 and healthy subjects. DM1, myotonic dystrophy type 1; F, female; HS, healthy subjects; M, male.
aOne-way analysis of variance. bχ2.
TABLE 2 | Principal genetic and clinical characteristics of patients with DM1. DM1 patients
n = 30 Age at onset according with IDMC nomenclature:
Childhood or juvenile onset (age range, 6–19 y) 10 (33.3%) Adulthood onset (age range, 20–60 y) 20 (66.6%) CTG triplet expansion (mean ± SD) [range] 527.6 ± 308.5
[73–1200] IDMC nomenclature E1 (CTG range: 50–150), n (%) 2 (6.7%) E2 (CTG range: 151–500), n (%) 15 (50.0%) E3 (CTG range: 501–1,000), n (%) 11 (36.6%) E4 (CTG range >1,000), n (%) 2 (6.7%) MIRS stage Stage 2, n (%) 11 (36.6%) Stage 3, n (%) 15 (50.0%) Stage 4, n (%) 4 (13.3%)
This table shows clinical onset, genetic features, and MIRS scores in DM1 patients. Frequencies and percentages are reported. DM1, myotonic dystrophy type 1; IDMC, International Myotonic Dystrophy Consortium; MIRS, Muscular Impairment Rating Scale.
areas of the patient group, and they had to be a native Italian speaker. As detailed below, all individuals showing an interest in taking part in the research underwent a medical screening to exclude the presence of any major neurological, psychiatric, or systemic disorder.
Principal demographic and clinical characteristics of the participants are summarized in Tables 1, 2. All participants were right handed as assessed by the Edinburgh Handedness Inventory (23). All subjects (patients and controls) underwent clinical assessment to exclude the presence of major systemic and neurological, psychiatric illnesses in controls, and pathologies different from known comorbidities in DM1 patients.
Ethics Statement
This study was conducted according to the principles expressed in the Declaration of Helsinki. The ethics committee of the Santa Lucia Foundation approved the study. Written informed consent was obtained from all recruited subjects before study initiation.
Social Cognition Assessment
All DM1 patients underwent the Social Cognition Battery developed by Prior et al. (24), which includes tests for the ToM, Emotion Attribution, Social Abilities, and Moral Judgments. For the purposes of the current study, we have reported here only data of Emotion Attribution, Social Abilities, and Moral Judgments. Performance scores obtained by DM1 patients at each test from the Social Cognition Battery were evaluated using the Italian normative cutoff reported by Prior et al. (24).
The associations between scores obtained at Social Cognition Battery and CTG triple’s expansion, MIRS scores, and disease duration were assessed by using Pearson correlation coefficients.
Image Acquisition and Preprocessing of
Volumetric Images to Assess Cortical
Thickness
All participants underwent MRI 3 T brain scanning (Siemens Medical Solutions, Erlangen, Germany) including the following acquisitions: (a) dual-echo spin echo (DE-SE) [repetition time (TR) = 5,000 ms, echo time (TE) = 20/100 ms]; (b) fast fluid-attenuated inversion recovery (FLAIR) [TR = 8,170 ms, TE = 96 ms, inversion time (TI) = 2,100 ms]; (c) 3D T1-weighted (TR =7.92 ms, TE = 2.4 ms, TI = 210 ms, flip angle = 15◦). For the dual-echo and FLAIR scans, 52 contiguous interleaved axial slices were acquired with a 2-mm slice thickness, with a 192 × 256 matrix over a 256 × 256-mm field of view, covering the whole brain. The T1-weighted volumes were acquired in a single slab, with a sagittal orientation and 224 × 256 matrix size over a 256 × 256-mm2field of view, with an effective slice thickness of a 1 mm. The T1-weighted images were automatically preprocessed for surface-based morphometry by using the pipeline included in CAT-12 (Computational Anatomy Toolbox 12), a toolbox of SPM 12 (https://www.fil.ion.ucl.ac.uk/spm/software/spm12/). Briefly, a projection-based thickness estimation was used to compute the cortical thickness and the central surface (25), including the partial volume correction, the sulcal blurring, and asymmetries corrections. CAT-12 permits to repair topological defects, using a method based on spherical harmonics (26) and to reparameterize the surface mesh into a common coordinate system using a specific algorithm to reduce the area distortion (27). Then, an adapted two-dimensional diffeomorphic DARTEL algorithm was used for the spherical registration of the brain surface. Finally, a smoothing with a Gaussian kernel of 15 mm (FWHM) was applied to each data set.
Statistical Analyses
Demographic and Clinical DataOne-way analyses of variance were used to assess between group differences (DM1 vs. HS) in age and years of formal education. A χ2 test was used to test for differences in gender distribution (Table 1).
Social Cognition Battery
A series of Pearson coefficients were used to assess correlations between scores obtained by DM1 patients on the Social Cognition Battery and their CTG triplet expansions, and MIRS scores.
SPSS 21.0 (https://www.ibm.com/products/spss-statistics) was used to compute statistical analyses on demographic, clinical, and cognitive data.
Cortical Thickness Analyses
The MRI data analyses were performed in the framework of General Linear Model by using CAT-12 (Computational Anatomy Toolbox in SPM12) (https://www.fil.ion.ucl.ac.uk/ spm/software/spm12/). A two-sample t-test model was used for voxel-wise comparisons of cortical thickness between DM1 patients and HS. Age, years of formal education, and intracranial volumes (obtained as sum of gray matter, white matter, and cerebrospinal fluid) were always used as covariates of no interest. Moreover, only in patients with DM1 a series of multiple regression models were used to assess the potential association between cortical thickness and performance obtained at SC battery. Intracranial volumes were again entered as covariate of no interest together with CTG triplet expansions.
All results were accepted if survived at correction for multiple comparisons (p < 0.05 Family Wise Error (FWE) at cluster level).
RESULTS
As shown in Table 1, patients and controls did not differ significantly in age and gender distribution (F = 0.77, p = 0.385; χ2 =0.02, p = 0.882) As expected, DM1 patients were significantly less educated than HSs (F = 42.6, p = 0.0001).
In DM1 group, 20 of 30 (66.6%) had an adulthood onset of disease, and 10 of 30 patients (33.3%) had childhood onset. Mean n(CTG) expansion size was 527.6 ± 308.5 (range, 73–1,200). According to the classification from of the Myotonic Dystrophy Consortium (20), 2 of 30 patients (6.7%) from our cohort of study belonged to E1 class, 15 of 30 (50.0%) to E2 class, 11 of 30 (36.6%) to E3 class, and finally 2 of 30 (6.7%) to E4 class. Based on MIRS rating, 11 of 30 (36.6%) had an MIRS score = 2, 15 of 30 (50.0%) had an MIRS score = 3, and 4 of 30 (13.3 %) had an MIRS score = 4.
Social Cognition Assessment
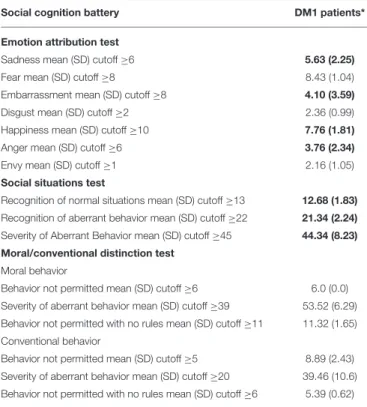
All DM1 patients reported pathological scores in all items of the Social Situations Test and performed poorly on the Emotion Attribution Tests (Table 3). Remarkable deficits were observed for Sadness, Embarrassment, Happiness, and Anger.
Relationship Between Performances at Social Cognition Battery and Genetics and Clinical Characteristics in DM1 Patients
Significant negative correlations were found between n(CTG) size in leukocytes and scores obtained at the Emotion Attribution Test (Embarrassment: r = −0.41, p = 0.03) and at the moral/non-moral Conventional Distinction Test (Severity of Aberrant Behavior: r = −0.37, p = 0.05). Negative correlation was also found between patients’ MIRS scores and performances obtained at the Emotion Attribution Test (Sadness: r = −0.62, p = 0.002). Finally, no significant correlations were found between disease duration and SC scores.
TABLE 3 | Social cognition battery performances obtained by patients with DM1.
Social cognition battery DM1 patients*
Emotion attribution test
Sadness mean (SD) cutoff ≥6 5.63 (2.25)
Fear mean (SD) cutoff ≥8 8.43 (1.04)
Embarrassment mean (SD) cutoff ≥8 4.10 (3.59)
Disgust mean (SD) cutoff ≥2 2.36 (0.99)
Happiness mean (SD) cutoff ≥10 7.76 (1.81)
Anger mean (SD) cutoff ≥6 3.76 (2.34)
Envy mean (SD) cutoff ≥1 2.16 (1.05)
Social situations test
Recognition of normal situations mean (SD) cutoff ≥13 12.68 (1.83) Recognition of aberrant behavior mean (SD) cutoff ≥22 21.34 (2.24) Severity of Aberrant Behavior mean (SD) cutoff ≥45 44.34 (8.23) Moral/conventional distinction test
Moral behavior
Behavior not permitted mean (SD) cutoff ≥6 6.0 (0.0) Severity of aberrant behavior mean (SD) cutoff ≥39 53.52 (6.29) Behavior not permitted with no rules mean (SD) cutoff ≥11 11.32 (1.65) Conventional behavior
Behavior not permitted mean (SD) cutoff ≥5 8.89 (2.43) Severity of aberrant behavior mean (SD) cutoff ≥20 39.46 (10.6) Behavior not permitted with no rules mean (SD) cutoff ≥6 5.39 (0.62) This table shows performance’s scores (mean and standard deviation) obtained by DM1 patients in each test of the Social Cognition Battery (24). Italian normative cutoffs are reported. The patients’ pathological performances are shown in bold font. DM1, myotonic dystrophy type 1.
*Performances scores in DM1 patients were evaluated using the Italian normative cutoff
(24). Pathological performances are highlighted in bold characters.
Cortical Thickness
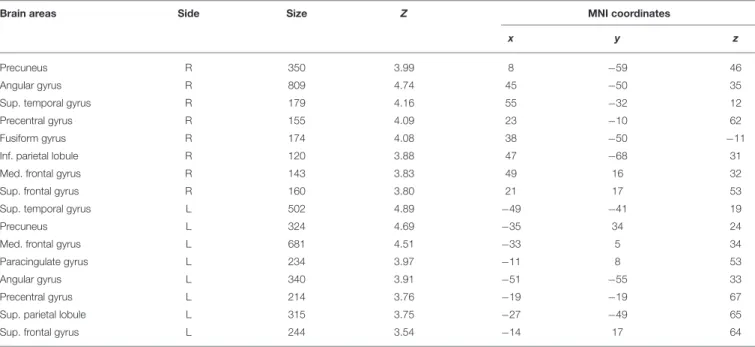
Between-Group ComparisonAs shown in Figure 1 and Table 4, patients with DM1 compared to HSs showed a significant decrease in cortical thickness in several brain areas, including the precuneus, the angular gyrus, the superior temporal gyrus, and the medial frontal gyrus bilaterally; the right precentral gyrus and the right posterior and anterior cingulate cortex; and the left superior parietal lobule. Relationship Between Cortical Thickness and CTG Triplet Expansion in Leukocytes
As shown in Figure 2, we found significant positive correlation (A) between n(CTG) size in leukocytes and cortical thickness in the left postcentral gyrus and in the left primary somatosensory cortex. Conversely, a significant negative (B) correlation was found between patients’ n(CTG) size in leukocytes and cortical thickness in the posterior cingulate cortex bilaterally and in the right lingual gyrus.
Relationship Between Cortical Thickness and Performances at the Social Cognition Battery
As shown in Figure 3 and Table 5, patients with DM1 showed a significant positive correlation between correct attribution of sadness and cortical thickness in the left superior temporal gyrus, in the right inferior frontal gyrus, in the right precentral gyrus, in
FIGURE 1 | Cortical thickness in DM1 patients compared with HS. This figure reveals that patients with DM1 compared to healthy subjects showed a significant decrease in cortical thickness in several brain areas. In particular, the cortical thickness is significantly decreased in the precuneus, the angular gyrus, the superior temporal gyrus and the medial frontal gyrus bilaterally, the right precentral gyrus, the right posterior and anterior cingulate cortex, and the left superior parietal lobule. The statistical comparisons were overlapped on MRIcron ch2bet template (https://www.nitrc.org/projects/mricron). DM1, myotonic dystrophy type 1; HS, healthy subjects; R, right.
TABLE 4 | Comparison between patients with DM1 and HSs in cortical thickness.
Brain areas Side Size Z MNI coordinates
x y z
Precuneus R 350 3.99 8 −59 46
Angular gyrus R 809 4.74 45 −50 35
Sup. temporal gyrus R 179 4.16 55 −32 12
Precentral gyrus R 155 4.09 23 −10 62
Fusiform gyrus R 174 4.08 38 −50 −11
Inf. parietal lobule R 120 3.88 47 −68 31
Med. frontal gyrus R 143 3.83 49 16 32
Sup. frontal gyrus R 160 3.80 21 17 53
Sup. temporal gyrus L 502 4.89 −49 −41 19
Precuneus L 324 4.69 −35 34 24
Med. frontal gyrus L 681 4.51 −33 5 34
Paracingulate gyrus L 234 3.97 −11 8 53
Angular gyrus L 340 3.91 −51 −55 33
Precentral gyrus L 214 3.76 −19 −19 67
Sup. parietal lobule L 315 3.75 −27 −49 65
Sup. frontal gyrus L 244 3.54 −14 17 64
This table illustrates the brain areas in which DM1 patients show decreased cortical thickness compared to HS. Side, cluster size, statistic, and MNI coordinates are reported. DM1, Myotonic dystrophy type 1; HS, healthy subjects; Inf., inferior; L, left; Med., medial; MNI, Montreal Neurological Institute; R, right; Sup., superior.
the right angular gyrus, and in the medial frontal gyrus bilaterally. They also showed negative correlations between performances at the Social Situations Test and cortical thickness in the bilateral precuneus, in the right superior parietal cortex, and in the left lateral temporal and occipital cortex.
DISCUSSION
The present work shows a widespread impairment of SC in patients with DM1, involving Emotion Attribution, Social Situation, and Moral Judgment. Theory of Mind deficits were previously documented in DM1 patients and associated with
abnormal functional connectivity in specific brain networks (16). More recently, face emotion recognition was found impaired in a cohort of DM1 patients with prominent difficulties for faces showing negative emotions such as anger and disgust, and crucially deficits were more extensive than expected (19). In our current work, we confirmed the conclusions drawn by Labayru et al. (19), and we contributed to clarify the neurobiological substrates of SC deficits in DM1 patients, especially for their emotion processing and moral/non-moral judgments abilities. We have indeed confirmed the presence of difficulties in emotion processing (mainly for negative emotions) with our patients scoring below the normality cutoff when required to recognize
FIGURE 2 | Correlations between CTG triplet expansion and cortical thickness in DM1 patients. The figure shows the correlations between CTG triplet expansion and the cortical thickness in different brain areas. In particular, (A) shows a significant positive correlation between CTG triplet expansion and cortical thickness in the left postcentral gyrus and in the left primary somatosensory cortex; (B) shows a significant negative correlation between CTG triplet expansion and cortical thickness in the posterior cingulate cortex bilaterally and in the right lingual gyrus. The statistical comparisons were overlapped on MRIcron ch2bet template (https://www.nitrc. org/projects/mricron). L, left; R, right.
not only sadness, embarrassment, and anger, but also happiness. Nevertheless, our findings are also partially different compared to those reported by Labayru et al. (19), who found difficulties mainly in the recognition of anger and disgust. In our opinion, such differences are likely due to the different material used to assess emotions; indeed, Labayru et al. (19) used a facial emotion recognition test, whereas in our patients, we evaluated the emotion attribution processing using brief verbal stories. This test, which is part of the Social Cognition Battery, includes 58 brief stories that are read by the clinician. In each story, the protagonist is implicated in a social situation that causes a well-defined emotion (e.g., “Simon’s pictures were ranking in the last in an artistic contest. How does Simon feel?”). This type of material is more cognitively demanding than facial visual stimuli and possibly more sensitive to minimal deficits. There were indeed no significant clinical differences between our own and Labayru’s cohort of patients to justify different levels of SC impairment.
In the current study, we explored if any associations would exist between patients’ emotion recognition abilities, severity of motor disability, or their CTG triplet expansion size in leukocytes. Consistent with our previous report on ToM deficits in DM1 (16), the current study confirms a significant association
between patients’ deficits in emotion recognition, their MIRS scores, and n(CTG) size in leukocytes. Within the uncertainty given by individual somatic mosaics, these data open a discussion about the relationship existing between n(CGT) in leukocytes and those segregating in specific cortical brain areas. It is possible that abnormalities in different domains of SC might be due to patients’ genetic characteristics in addition to their mentalizing ability. The presence of somatic mosaicism has been traditionally demonstrated in the skeletal muscle, leukocytes, oocytes, and sperm of DM1 patients. Moreover, the size of repeat expansions is known to increase over time and across generations, thus causing somatic mosaicism also in postmitotic tissues, such as the skeletal and cardiac muscle and the brain (28–31). A recent postmortem study in DM1 patients has demonstrated the presence of a more remarkable somatic mosaicism in the brain tissue than in white blood cells. Remarkable expansion and somatic instability were present in all brain regions with the exception of the cerebellum (32). There are quite a few postmortem studies that have investigated the presence of molecular hallmarks of DM within the brain tissue. For instance, RNA nuclear foci were found being widely distributed throughout the cortical layers of various brain regions within different cell types, including neurons, astrocytes, oligodendrocytes, and Purkinje
FIGURE 3 | Correlations between cortical thickness and performances at the Social Cognition Battery. (A) shows a significant positive correlation between cortical thickness and correct attribution of Sadness in the Emotions attribution test in the superior temporal gyrus, the right precentral gyrus, the right angular gyrus and the left medial frontal gyrus bilaterally. (B) shows a negative correlation between cortical thickness in the bilateral precuneus and in the left lateral occipital cortex and performance at the Social Situations Test, especially in Severity of Aberrant Behavior. The statistical comparisons were overlapped on MRIcron ch2bet template (https://www.nitrc.org/projects/mricron). L, left; R, right.
TABLE 5 | Relationship between cortical thickness and performances at the Social Cognition Battery in patients with DM1.
Social Cognition Battery Brain areas Side Size Z MNI coordinates
x y z
Emotions attribution test: sadness Sup. temporal gyrus L 1577 3.73 −51 −4 −6
Precentral gyrus/med. frontal gyrus L 3264 2.97 −42 3 38
Sup. temporal gyrus R 2678 3.82 53 −10 −7
Inf. frontal gyrus/precentral gyrus R 5915 3.71 50 11 23
Angular gyrus R 966 2.95 43 −56 61
Social situations test: severity of aberrant behavior Precuneus L 5647 3.56 −18 −49 56
Lat. Temporal cortex/ lat. occipital cortex L 2425 3.23 −43 −44 −7
Sup. parietal cortex/precuneus R 9899 4.00 26 −56 56
This table shows the statistically significant relationships between cortical thickness and performance’ scores obtained by DM1 patients at Social Cognition Battery. Side, cluster size, statistic, and MNI coordinates are reported. DM1, Myotonic dystrophy type 1; Lat., lateral; L, left; Med., medial; MNI, Montreal Neurological Institute; R, right; Sup., superior.
cells (33, 34). Moreover, RNA foci were found colocalizing with MBNL1 and MBNL2 proteins. Animal models, such as MBNL knockout mice and transgenic mice expressing high CTG repeats, have also been developed to further investigate these pathophysiological aspects of DM1. Interestingly, a direct comparison between MBNL1 and MBNL2 knockout mice revealed a major pathophysiological role for MBNL2 in the brain tissue (35). Additionally, the MBNL2 knockout model revealed altered REM sleep regulation, learning and memory
deficits in association with GRIN 1 activity, and impaired long-term potentiation (36). The model of transgenic mice expressing more than 1,000 CTG repeats revealed the presence of numerous RNA foci within various brain regions alongside with an increase in CELF proteins in the brainstem and in the frontal cortex. These abnormalities were associated to spatial and working memory impairments and anhedonia, which are similar to the symptoms observed in human DM1 patients (34). Against this background, we can speculate that the abnormalities we
observed in our patients might at least partially reflect this sort of pathophysiological mechanisms.
However, for a greater completeness, we report here that no significant correlations were found between SC scores and disease duration. This is not surprising considering that disease duration is calculated on the bases of the clinical onset of motor symptoms that do not necessarily reflect what occurs to the brain tissue.
The major novelty of the present study is the association found between cortical thickness and performances at the SC battery in patients with DM1. When comparing patients and healthy controls, the former showed a decrease in cortical thickness in several brain areas, including the precuneus and angular gyrus, the superior temporal gyrus, and the medial frontal gyrus bilaterally; the right precentral gyrus and posterior and anterior cingulate cortex; and the left superior parietal lobule. With the only exception of the precentral gyrus, all remaining regions are part of the association cortex and are known to play a key role in several higher-level functions. Therefore, they may be implicated also in determining the SC deficits that we observed in our DM1 patients. Conversely, the precentral gyrus is more implicated in planning, control, and execution of motor gestures. It has been previously considered as part of the mirror neuron system (37), and it plays an important role in different aspects of SC, such as mentalizing ability, empathy, and so on.
In addition, we found that changes in the cortical thickness in some of these areas were significantly associated with the peripheral patients’ CTG triplet expansion size, thus supporting the idea that such cortical abnormalities could play an important role for the pathophysiology of emotional defects in DM1 patients. In particular, we found both positive and negative correlations between CTG triplet expansion size and cortical thickness. In several genetic conditions, such as Down syndrome (38), Williams syndrome (39), and Prader-Willi syndrome (40), but also in neurodevelopmental disorders such as autism (41), both increased and decreased gray matter volumes were found. In these studies, compensation brain mechanisms were hypothesized. Although the underlying brain mechanisms remain unclear, we may hypothesize, in DM1 brains, a coexistence of two different mechanisms: one related to neurodevelopmental mechanisms, which might explain the positive correlations; the other one due to neurodegeneration, which might explain the negative correlations found between CTG triplet expansion size and cortical thickness. The present data are not exhaustive, and further studies are required to increase our comprehension of these possible concomitant phenomena.
Cortical thickness was also found being associated with various measures of SC in our DM1 patients. Positive correlations were indeed found between a correct identification of sadness and cortical thickness in the superior temporal gyrus bilaterally, in the right angular and precentral gyri, and in the left medial frontal gyrus. The medial frontal gyrus has been previously reported being involved in the integration of emotions into cognitive decisions and planning (42), whereas the angular gyrus is known to be involved in various cognitive functions through integration of information from different modalities. The angular gyrus
is structurally connected to several brain areas including the frontal and parietal regions and the insular cortex. Against this background, we hypothesize that a reduction of cortical thickness in the angular gyrus might be responsible for its disconnection with a set of regions involved in emotion processing (43–50) and might therefore account for deficits in emotion recognition. Moreover, we found negative correlations between cortical thickness of the precuneus and the severity of abnormal behavior in social situations (51–53). This anatomical localization of abnormalities might account for difficulties in social judgment that we documented, for the first time, in our cohort of DM1 patients. Although the emotions are traditionally considered as modulated by the limbic system, there is evidence that the different aspects of emotions (i.e., recognition, attribution, monitoring) rely on the integrity of a widespread cortical network that includes the frontal areas [see Dixon et al. (54) for a review] and the cingulate cortex as part of the limbic system (55). In turn, these areas are known to interact with the premotor cortex and the limbic system [see (56)]. Additionally, the present study supports the idea of a diffuse involvement of these same brain areas in the attribution of emotions, as well as in more complex behaviors related to moral judgment. In this framework, the current work posits the recognition of “others’ mental states” in DM1 patients as depending on complex brain networks.
However, in a previous study, Caso et al. (7) suggested that white matter changes in DM1 might be of neurodevelopmental origin, whereas gray matter changes are most likely due to neurodegeneration. Consistently with this view, we hypothesize here that both cortical thickness changes and their relationship with SC deficits might be due to neurodegeneration phenomena.
The main limitation of the present study is the relatively small sample size. Nevertheless, the current results are consistent with those obtained by other authors who investigated the ToM (57) and emotional recognition (19) in independent cohorts of DM1 patients. Further studies are, however, needed to confirm these findings and clarify whether different patterns of impairments may be associated to different clinical onsets of DM1.
In conclusion, although the small sample size and lacking of a wider knowledge on this topic make the present findings speculative, the present study shows the presence of diffuse SC deficits in DM1 patients. These deficits include also emotion processing and social judgment abilities. Moreover, the current study documents the association between emotional impairment and a pattern of brain damage involving the microstructural organization of many cortical regions in DM1 patients. These cortical abnormalities were correlated with the peripheral CTG triplet expansion size of our DM1 patients, thus reinforcing the idea that DM1 is a disease characterized by remarkable higher-level dysfunctions that may become clinically relevant over the clinical course (58). Nevertheless, there are many environmental factors that might contribute to the development of SC deficits in DM1. The cross-sectional design of the current study makes any causative inference between brain tissue abnormalities and symptoms observed in DM1 patients purely speculative. Further studies with a longitudinal design are needed to address these issues.
DATA AVAILABILITY STATEMENT
The datasets generated for this study are available on request to the corresponding author.
ETHICS STATEMENT
The studies involving human participants were reviewed and approved by Local Ethical Committee of Santa Lucia Foundation, Rome Italy. The patients/participants provided their written informed consent to participate in this study.
AUTHOR CONTRIBUTIONS
LS conceived the idea of the study, coordinated the collection of cognitive and MRI data, supervised cognitive and MRI
data analyses, and wrote the manuscript. GB run cognitive and MRI data analyses and wrote the manuscript. MBr conceived the idea of the study. GG implemented data analyses pipeline. CD and SB collected cognitive measures and MRI data. APet and GS patients’ enrolment and supervised the draft. GS patients’ enrolment and supervised the draft. APer patients’ enrolment. GM and CC supervised the draft. MBo conceived the idea of the study, supervised the writing of the manuscript.
FUNDING
This research was supported in part by Ministero della Salute (Italian Ministry of Health) (Linea di Ricerca Corrente: Neuroriabilitazione Cognitiva, Motoria e Neuroimmagini). GM supported by FMM-Fondazione Malattie Miotoniche, Milan, Italy.
REFERENCES
1. Brook JD, McCurrach ME, Harley HG, Buckler AJ, Church D, Aburatani H, et al. Molecular basis of myotonic dystrophy: expansion of a trinucleotide (CTG) repeat at the 3’ end of a transcript encoding a protein kinase family member. Cell. (1992) 68:799–808. doi: 10.1016/0092-8674(92)90154-5 2. Mahadevan M, Tsilfidis C, Sabourin L, Shutler G, Amemiya C, Jansen G, et al.
Myotonic dystrophy mutation: an unstable CTG repeat in the 3’ untranslated region of the gene. Science. (1992) 255:1253–5. doi: 10.1126/science.15 46325
3. Fu YH, Pizzuti A, Fenwick RG Jr, King J, Rajnarayan S, Dunne PW, et al. An unstable triplet repeat in a gene related to myotonic muscular dystrophy. Science. (1992) 255:1256–8. doi: 10.1126/science.1546326
4. Weber YG, Roebling R, Kassubek J, Hoffmann S, Rosenbohm A, Wolf M, et al. Comparative analysis of brain structure, metabolism, and cognition in myotonic dystrophy 1 and 2. Neurology. (2010) 74:1108–17. doi: 10.1212/WNL.0b013e3181d8c35f
5. Romeo V, Pegoraro E, Ferrati C, Squarzanti F, Sorarù G, Palmieri G, et al. Brain involvement in myotonic dystrophies: neuroimaging and neuropsychological comparative study in DM1 and DM2. J Neurol. (2010) 257:1246–55. doi: 10.1007/s00415-010-5498-3
6. Minnerop M, Weber B, Schoene-Bake JC, Roeske S, Mirbach S, Anspach C, et al. The brain in myotonic dystrophy 1 and 2: evidence for a predominant white matter disease. Brain. (2011) 134:3530–46. doi: 10.1093/brain/awr299 7. Caso F, Agosta F, Peric S, Rakoˇcevi´c-Stojanovi´c V, Copetti M, Kostic
VS, et al. Cognitive impairment in myotonic dystrophy type 1 is associated with white matter damage. PLoS ONE. (2014) 9:e104697. doi: 10.1371/journal.pone.0104697
8. Serra L, Petrucci A, Spanò B, Torso M, Olivito G, Lispi L, et al. How genetics affects the brain to produce higher-level dysfunctions in myotonic dystrophy type 1. Func Neurol. (2015) 25:111.
9. Schneider-Gold C, Bellenberg B, Prehn C, Krogias C, Schneider R, Klein J, et al. Cortical and subcortical grey and white matter atrophy in myotonic dystrophies type 1 and 2 is associated with cognitive impairment, depression and daytime sleepiness. PLoS ONE. (2015) 10:e0130352. doi: 10.1371/journal.pone.0130352
10. Zanigni S, Evangelisti S, Giannoccaro MP, Oppi F, Poda R, Giorgio A, et al. Relationship of white and gray matter abnormalities to clinical and genetic features in myotonic dystrophy type 1. Neuroimage Clin. (2016) 3:678–85. doi: 10.1016/j.nicl.2016.04.012
11. van der Plas E, Hamilton MJ, Miller JN, Koscik TR, Long JD, Cumming S, et al. Brain structural features of myotonic dystrophy type 1 and their relationship with CTG repeats. J Neuromuscul Dis. (2019) 6:321–32. doi: 10.3233/JND-190397
12. Baldanzi S, Cecchi P, Fabbri S, Pesaresi I, Simoncini C, Angelini C, et al. Relationship between neuropsychological impairment and grey and white matter changes in adult-onset myotonic dystrophy type 1. Neuroimage Clin. (2016) 12:190–7. doi: 10.1016/j.nicl.2016.06.011
13. Yoo WK, Park YG, Choi YC, Kim SM. Cortical thickness and white matter integrity are associated with CTG expansion size in myotonic dystrophy type I. Yonsei Med J. (2017) 58:807–15. doi: 10.3349/ymj.2017.58.4.807
14. Serra L, Silvestri G, Petrucci A, Basile B, Masciullo M, Makovac E, et al. Abnormal functional brain connectivity and personality traits in myotonic dystrophy type 1. JAMA Neurol. (2014) 71:603–11. doi: 10.1001/jamaneurol.2014.130
15. Serra L, Cercignani M, Bruschini M, Cipolotti L, Mancini M, Silvestri G, et al. “I know that you know that i know”: neural substrates associated with social cognition deficits in DM1 patients. PLoS ONE. (2016) 11:1–13. doi: 10.1371/journal.pone.0156901
16. Serra L, Mancini M, Silvestri G, Petrucci A, Masciullo M, Spanò B, et al. Brain connectomics’ modification to clarify motor and nonmotor features of myotonic dystrophy type 1. Neural Plasticity. (2016) 1–10. doi: 10.1155/2016/2696085
17. Brothers L. The social brain: a project for integrating primate behavior and neurophysiology in a new domain. Concepts Neurosci. (1990) 1:27–51. 18. Christidi F, Migliaccio R, Santamaría-García H, Santangelo G, Trojsi F.
Social cognition dysfunctions in neurodegenerative diseases: neuroanatomical correlates and clinical implications. Behav Neurol. (2018) 2018:1849794. doi: 10.1155/2018/1849794
19. Labayru G, Arenzana I, Aliri J, Zulaica M, López de Munain A, Sistiaga AA. Social cognition in myotonic dystrophy type 1: specific or secondary impairment? PLoS ONE. (2018) 13:e0204227. doi: 10.1371/journal.pone.0204227
20. International Myotonic Dystrophy Consortium. (IDMC) New nomenclature and DNA testing guidelines for myotonic dystrophy type 1 (DM1). Neurology. (2000) 54:1218–21. doi: 10.1212/WNL.54.6.1218
21. Folstein MF, Folstein SE, McHugh PR. “Mini-mental state.” A practical method for grading the cognitive state of patients for the clinician. J Psychiatr Res. (1975) 12:189–98. doi: 10.1016/0022-3956(75)90026-6
22. Mathieu J, Boivin H, Meunier D, Gaudreault M, Bégin P. Assessment of a disease-specific muscular impairment rating scale in myotonic dystrophy. Neurology. (2001) 56:336–40. doi: 10.1212/WNL.56.3.336
23. Busch D, Hagemann N, Bender N. The dimensionality of ¨ the Edinburgh handedness inventory: an analysis with models of the item response theory. Laterality. (2010) 15:610–28. doi: 10.1080/13576500903081806
24. Prior M, Marchi S, Sartori G. Cognizione sociale e comportamento, Volume I, Uno strumento per la misurazione. Padova: Upsel Domeneghini Editore (2003).
25. Dahnke R, Yotter RA, Gaser C. Cortical thickness and central surface estimation. NeuroImage. (2013) 65:336–48. doi: 10.1016/j.neuroimage.2012.09.050
26. Yotter RA, Nenadic I, Ziegler G, Thompson PM, Gaser C. Local cortical surface complexity maps from spherical harmonic reconstructions. Neuroimage. (2011) 56:961–73. doi: 10.1016/j.neuroimage.2011.02.007 27. Yotter RA, Thompson PM, Gaser C. Algorithms to improve the
reparameterization of spherical mappings of brain surface meshes. J Neuroimaging. (2011) 21:e134–7. doi: 10.1111/j.1552-6569.2010.00484.x 28. Ashizawa T, Dubel JR, Harati Y. Somatic instability of CTG repeat in myotonic
dystrophy. Neurology. (1993) 43:2674–8. doi: 10.1212/WNL.43.12.2674 29. Thornton CA, Johnson K, Moxley RT 3rd. Myotonic dystrophy patients have
larger CTG expansions in skeletal muscle than in leukocytes. Ann Neurol. (1994) 35:104–7. doi: 10.1002/ana.410350116
30. Anvret M, Ahlberg G, Grandell U, Hedberg B, Johnson K, Edström L. Larger expansions of the CTG repeat in muscle compared to lymphocytes from patients with myotonic dystrophy. Hum Mol Genet. (1993) 2:1397–400. doi: 10.1093/hmg/2.9.1397
31. Martorell L, Johnson K, Boucher CA, Baiget M. Somatic instability of the myotonic dystrophy (CTG)n repeat during human fetal development. Hum Mol Genet. (1997) 6:877–80. doi: 10.1093/hmg/6.6.877
32. Itoh K, Mitani M, Kawamoto K, Futamura N, Funakawa I, Jinnai K, et al. Neuropathology does not correlate with regional differences in the extent of expansion of CTG repeats in the brain with myotonic dystrophy type 1. Acta Histochem Cytochem. (2010) 43:149–56. doi: 10.1267/ahc.10019
33. Jiang H, Mankodi A, Swanson MS, Moxley RT, Thornton CA. Myotonic dystrophy type 1 is associated with nuclear foci of mutant RNA, sequestration of muscleblind proteins and deregulated alternative splicing in neurons. Hum Mol Genet. (2004) 13:3079–88. doi: 10.1093/hmg/ddh327
34. Hernández-Hernández O, Guiraud-Dogan C, Sicot G, Huguet A, Luilier S, Steidl E, et al. Myotonic dystrophy CTG expansion affects synaptic vesicle proteins, neurotransmission and mouse behaviour. Brain. (2013) 136:957–70. doi: 10.1093/brain/aws367
35. Goodwin M, Mohan A, Batra R, Lee KY, Charizanis K, Fernández Gómez FJ, et al. MBNL sequestration by toxic RNAs and RNA misprocessing in the myotonic dystrophy brain. Cell Rep. (2015) 12:1159–68. doi: 10.1016/j.celrep.2015.07.029
36. Charizanis K, Lee KY, Batra R, Goodwin M, Zhang C, Yuan Y, et al. Muscleblind-like 2-mediated alternative splicing in the developing brain and dysregulation in myotonic dystrophy. Neuron. (2012) 75:437–50. doi: 10.1016/j.neuron.2012.05.029
37. Rizzolatti G, Craighero L. The mirror-neuron system. Annu Rev Neurosci. (2004) 27:169–92. doi: 10.1146/annurev.neuro.27.070203.1 44230
38. Raitano Lee N, Adeyemi EI, Lin A, Clasen LS, Lalonde FM, Condon E, et al. Dissociations in cortical morphometry in youth with down syndrome: evidence for reduced surface area but increased thickness. Cerebral Cortex. (2016) 26:2982–90. doi: 10.1093/cercor/bhv107
39. Green T, Fierro KC, Raman MM, Saggar M, Sheau KE, Reiss AL. Surface-based morphometry reveals distinct cortical thickness and surface area profiles in Williams Syndrome. Am J Med Genet B. (2016) 171B:402–13. doi: 10.1002/ajmg.b.32422
40. Lukoshe A, White T, Schmidt MN, van der Lugt A, Hokken-Koelega AC. Divergent structural brain abnormalities between different genetic subtypes of children with Prader-Willi syndrome. J Neurodev Disord. (2013) 5:31. doi: 10.1186/1866-1955-5-31
41. Khundrakpam BS, Lewis JD, Kostopoulos P, Carbonell F, Evans AC. Cortical thickness abnormalities in autism spectrum disorders through late childhood, adolescence, and adulthood: a large-scale MRI study. Cereb Cortex. (2017) 27:1721–31. doi: 10.1093/cercor/bhx038
42. Partiot A, Grafman J, Sadato N, Wachs J, Hallett M. Brain activation during the generation of non-emotional and emotional plans. Neuroreport. (1995) 10:1269–72. doi: 10.1097/00001756-199507100-00009
43. Greene JD, Brian Sommerville R, Nystrom LE, Darley JM, Cohen JD. An fMRI investigation of emotional engagement in moral judgment. Science. (2001) 293:2105–8. doi: 10.1126/science.1062872
44. Moll J, Eslinger PJ, de Oliveira-Souza R. Frontopolar and anterior temporal cortex activation in a moral judgment task: preliminary functional MRI results in normal subjects. Arquivos de Neuro-Psiquiatria. (2001) 59:657–64. doi: 10.1590/S0004-282X2001000500001
45. Moll J, de Oliveira-Souza R, Eslinger PJ, Bramati IE, Mourão-Miranda J, Andreiuolo PA, et al. The neural correlates of moral sensitivity: a functional magnetic resonance imaging investigation of basic and moral emotions. J Neurosci. (2002) 22:2730–6. doi: 10.1523/JNEUROSCI.22-07-02730.2002 46. Greene J, Haidt J. How (and where) does moral judgment work? Trends Cogn
Sci. (2002) 6:517–23. doi: 10.1016/S1364-6613(02)02011-9
47. Carrington SJ, Bailey AJ. Are there theory of mind regions in the brain? A review of the neuroimaging literature. Hum Brain Mapp. (2009) 30:2313–35. doi: 10.1002/hbm.20671
48. Mel’nikov ME, Petrovskii ED, Bezmaternykh DD, Kozlova LI, Shtark MB, Savelov AA. fMRI response of parietal brain areas to sad facial stimuli in mild depression. Bull Exp Biol Med. (2018) 165:741–5. doi: 10.1007/s10517-018-4255-y
49. Lee KH, Farrow TFD, Spence SA, Woodruff PWR. Social cognition, brain networks and schizophrenia. Psychol Med. (2004) 34:391–400. doi: 10.1017/S0033291703001284
50. White NM. Some highlights of research on the effects of caudate nucleus lesions over the past 200 years. Behav Brain Res. (2009) 199:3–23. doi: 10.1016/j.bbr.2008.12.003
51. Farrow TFD, Zheng Y, Wilkinson ID, Spence SA, Deakin JF, Tarrier N, et al. Investigating the functional anatomy of empathy and forgiveness. NeuroReport. (2001) 12:2433–8. doi: 10.1097/00001756-200108080-00029 52. Avram M, Gutyrchik E, Bao Y, Pöppel E, Reiser M, Blautzik J. Neurofunctional
correlates of esthetic and moral judgments. Neurosci Lett. (2013) 534:128–32. doi: 10.1016/j.neulet.2012.11.053
53. Han S, Northoff G. Culture-sensitive neural substrates of human cognition. Nat Rev Neurosci. (2008) 9:646–54. doi: 10.1038/nrn2456
54. Dixon ML, Thiruchselvam R, Todd R, Christoff K. Emotion and the prefrontal cortex: an integrative review. Psychol Bull. (2017) 143:1033–81. doi: 10.1037/bul0000096
55. Etkin A, Egner T, Kalisch R. Emotional processing in anterior cingulate and medial prefrontal cortex. Trends Cogn Sci. (2011) 15:85–93. doi: 10.1016/j.tics.2010.11.004
56. Rolls ET. The cingulate cortex and limbic systems for emotion, action, and memory. Brain Struct Funct. (2019) 224:3001–18. doi: 10.1007/s00429-019-01945-2
57. Kobayakawa M, Tsuruya N, Kawamura M. Theory of mind impairment in adult-onset myotonic dystrophy type 1. Neurosci Res. (2012) 72:341–6. doi: 10.1016/j.neures.2012.01.005
58. Angeard N, Huerta E, Jacquette A, Cohen D, Xavier J, Gargiulo M, et al. Childhood-onset form of myotonic dystrophy type 1 and autism spectrum disorder: is there comorbidity? Neuromuscul Disord. (2018) 28:216–21. doi: 10.1016/j.nmd.2017.12.006
Conflict of Interest:The authors declare that the research was conducted in the absence of any commercial or financial relationships that could be construed as a potential conflict of interest.
Copyright © 2020 Serra, Bianchi, Bruschini, Giulietti, Domenico, Bonarota, Petrucci, Silvestri, Perna, Meola, Caltagirone and Bozzali. This is an open-access article distributed under the terms of the Creative Commons Attribution License (CC BY). The use, distribution or reproduction in other forums is permitted, provided the original author(s) and the copyright owner(s) are credited and that the original publication in this journal is cited, in accordance with accepted academic practice. No use, distribution or reproduction is permitted which does not comply with these terms.