Non-intercepting diagnostic for high brightness electron beams using Optical Diffraction
Radiation Interference (ODRI)
This article has been downloaded from IOPscience. Please scroll down to see the full text article.
2012 J. Phys.: Conf. Ser. 357 012019
(http://iopscience.iop.org/1742-6596/357/1/012019)
Download details:
IP Address: 193.206.87.91
The article was downloaded on 04/05/2012 at 12:22
Please note that terms and conditions apply.
Non-intercepting diagnostic for high brightness
electron beams using Optical Diffraction Radiation
Interference (ODRI)
A Cianchi1, V. Balandin2, M. Castellano3, L. Catani4, E. Chiadroni3, G. Gatti3, N. Golubeva2, K. Honkavaara2, G. Kube2
1 INFN-Roma Tor Vergata & University of Rome ”Tor Vergata”, Via della Ricerca Scientifica,
1-00133 Rome, Italy
2 DESY, Notkestrasse 85, 22607 Hamburg, Germany 3
INFN-LNF, Via E. Fermi, 40 - 00044 Frascati, Rome, Italy
4 INFN-Roma Tor Vergata, Via della Ricerca Scientifica, 1-00133 Rome, Italy
E-mail: [email protected]
Abstract. High-gain Free Electron Lasers and future Linear Colliders require development of modern electron linacs with high brightness beams. Conventional intercepting transverse electron beam diagnostics, e.g. based on Optical Transition Radiation (OTR), cannot tolerate such high power beams without remarkable mechanical damages on the diagnostics device. Optical Diffraction Radiation (ODR) is an excellent candidate for measurements of the transverse phase space parameters in a non-intercepting way. One of the main problems of this method is the low signal to noise ratio, mainly due to the unavoidable synchrotron radiation background. This problem can be overcome by using two slits on metallic foils, placed at a distance shorter than the radiation formation zone. In this case a nearly background-free ODR interference pattern is produced allowing the determination of the beam size and angular divergence. The accuracy on these parameters can be increased by exploiting both ODR polarization states, as well as different wavelengths. Here we report measurements of the ODR interference between two slits with different aperture sizes in a non-collinear geometry, carried out at FLASH (DESY, Germany). Our results demonstrate the unique potential of this technique to determine the beam parameters.
1. Introduction
The beam size measurement is the fundamental diagnostic in linear accelerators allowing both the appropriate matching along the machine as well as the emittance control. Unfortunately conventional beam size diagnostic are mainly based on intercepting devices. Such a device can be seriously damaged or even destroyed by high brightness beams. Optical Diffraction Radiation (ODR) is a good candidate to be used as non intercepting diagnostic for the determination of the beam size. The particles go through an hole in a metallic screen, whose dimensions are smaller than the radial extension of the particle electromagnetic field (EM) that is in the order of γλ, where γ is the usual relativistic factor and λ the observed wavelength.
The physics of ODR is well known in literature [1]. The first suggestion of using ODR from a rectangular aperture as non-intercepting measurement of particle beam sizes is discussed in [2].
The first application of this technique to the particle beam diagnostics has been performed at ATF (KEK) ([3], [4], [5]).
Nevertheless two main problems remained: the low ODR signal-to-noise ratio, mainly due to the synchrotron radiation (SR) background [6] produced in the upstream magnetic elements and the ambiguity in the determination of the beam size due to an offset of the particle trajectory in the slit with respect to the geometrical center, according to Eq.6 in Ref [2]. The last issue can be mitigated by using a complementary diagnostic able to track the beam trajectory inside the aperture.
To overcome these limitations we came out with the idea of using a system of two slits with different aperture sizes, placed at a distance much shorter than the formation length. We called this system Optical Diffraction Radiation Interference (ODRI).
2. ODRI
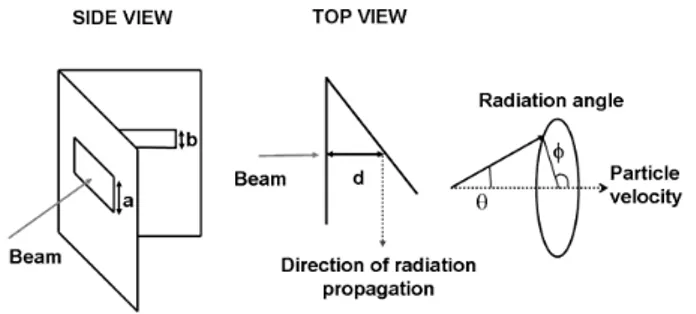
An introduction and explanation of the ODRI theory can be found in [7]. Here we report just the fundamental details. The setup is illustrated in Fig. 1
Figure 1. Sketch of the two-slits setup. Left: side view; Center: top view; Right: definition of
the coordinate system. Dimension a is the aperture size of the first slit, b the size of the second slit, and d the distance between slits center.
We designed this apparatus for an electron energy in the range of 1 GeV, so the radiation formation length (L ≈ γ2λ) in the optical wavelength range is of the order of few meters. A 1
mm size slit is realized in a metallic screen, placed normal to the beam axis. A second slit, 0.5 mm wide, is opened by means of lithographic technique in a silicon aluminated wafer, placed at 45 degrees with respect to the beam axis. The distance between the centers of the two apertures is about 2 cm.
The forward diffraction radiation (FDR), emitted when the charges pass through the first aperture, interferes with the backward diffraction radiation (BDR), produced by the interaction of the EM field with the second screen. The first screen acts also as a mask for the incoming SR background. For this purpose the best choice could be represented by two identical slit apertures. However in this case, due to the small distance between slits, compared to the formation length, the FDR and BDR interference would cancel almost totally the intensity. So we used 1 mm and 0.5 mm slits, these values being a reasonable compromise between the need to shield from SR background and to prevent negligible total intensity.
As clearly explained in [7] the two slits must be slightly misaligned with respect to each other (tens of microns), in order to allow the discrimination between the beam transverse size σ and the angular divergence σ’. The simultaneous measurement of both σ and σ’ paves the way to use this device in order to directly retrieve the beam emittance.
This setup is able to clearly estimate the emittance, the angular divergence and even the position of the beam inside the slit, as we already demonstrated in [7]. In this paper we further
extend our study comparing the data obtained under the same beam condition but observing different wavelengths or polarization states. The results confirm the validity of our analysis and the approximations. These are: perfect metal model for the targets, negligible effect of the interferential filter bandwidth and of the energy spread (in the order of 0.1%), particle distribution gaussian both in position and momentum, far field approximation for the radiation fields.
3. Experimental Setup
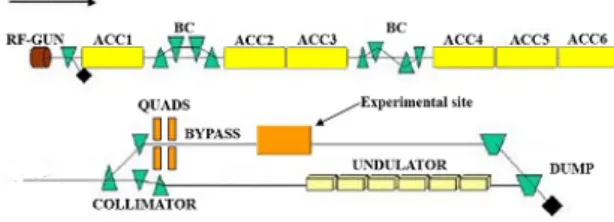
The measurements have been carried out at the FLASH free-electron laser user facility at DESY (Hamburg) [8]. FLASH consists of an electron source to produce a high quality electron beam, followed by superconducting linac with TESLA-type accelerating modules, and an undulator section to produce FEL radiation (see Fig. 2).
Figure 2. FLASH layout during our experiment (not to scale). The site of the experiment is
indicated.
In addition there is a second electron beam line to by-pass the undulators. Our experimental station is placed in this line about 40 m away from the last bending dipole. The energy of the beam was around 1.2 GeV and the typical number of bunches per bunch train was 20. The bunch train repetition rate was fixed to 5 Hz. In our experiment, we used an electron bunch charge of about 0.4 nC. We integrated for 2 seconds, resulting in a total integrated charge of 80 nC. This charge is enough to damage a conventional aluminated OTR screen, so for the comparison with measurement obtained with OTR we run with a single pulse, 0.4 nC.
A typical normalized projected transverse rms emittance measured at the injector is around 2 mm mrad (1 nC uncompressed bunch). Some emittance growth may occur when the beam is transported to the by-pass line where our experiment is located.
Figure 3. Optical system used in the measurements. The main components are illustrated in
Radiation from the target is reflected by a mirror and transported through an optical system to the camera.
The main components of the optical setup are highlighted in Fig. 3. Both, an achromatic doublet to image the beam and an apochromatic lens, with custom design to reduce the influence of chromatic aberrations to obtain the ODRI angular distribution can be used. The lenses have different focal lengths, f=250 mm and f=500 mm, in order to focus on the same image plane. Two filter wheels can hold several narrow band interference filters and two Glan-Thomson polarizers to select vertical and horizontal polarization. The polarizer lengthens the optical path, thus increasing the focal length. However, this change can be corrected by slightly changing the longitudinal camera position. A cooled, high sensitivity, 16-bit CCD camera is used (Hamamatsu ORCA II-BT-512G model type C4742-98-26LAG2). The camera main features are the very high quantum efficiency in the whole visible spectrum, in particular at 800 nm, the negligible thermal noise, and the long exposure time.
4. New Results
The goal of these measurements was to check the validity of the model for different wavelengths and to investigate also the horizontal polarization of the radiation, i.e. the component parallel to the longest side of the slits.
The data analysis has been performed using the Cernlib fitting routine Minuit [9]. The angular distribution of the whole beam is obtained by summing up 5000 distributions produced by a single particle with different vertical positions within the slit and angular divergences, both Gaussian distributed. Since the resulting expression cannot be solved analytically, a Monte Carlo approach is used instead and the results are fed into the Minuit routine. Every time the fitting procedure changes the starting parameters, new distributions are generated through the Monte Carlo code.
4.1. Vertical Polarization
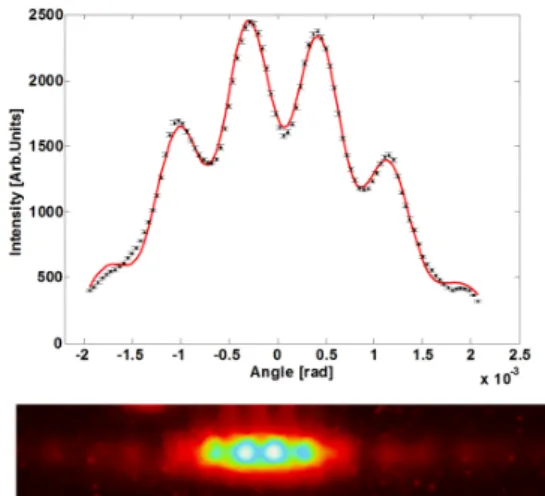
We compared the angular distributions obtained collecting the radiation at 800 nm and 550 nm in order to retrieve the values of σy and σy′. The results are shown in Fig. 4 and Fig. 5.
The retrieved parameters for 800 nm and 550 nm are respectively 81 µm and 76 µm for σy
and 203 µrad and 193 µrad for σy′. Both values are well inside the 10% difference that we
estimated is a good threshold for measurement reliability. From this comparison it is clear that the model is consistent and does not strongly depend on the wavelength.
At the same time, from the experimental point of view, in this range of energy and beam size, the longer wavelength seems to be preferable. Using a longer wavelength results in a wider angular distribution, increased fringes visibility and easier fit procedure. So, the wavelength should be chosen as long as possible, compatible with the detector efficiency, the slit aperture and the beam size at given energy.
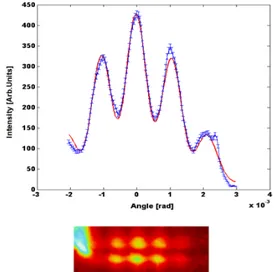
4.2. Horizontal Polarization
We compared also the vertical polarization of the angular distribution at 800 nm with the horizontal polarization at the same wavelength in Fig. 6 and Fig. 7. For our knowledge these are the first ever measurements of the angular distribution of the horizontal polarization of ODR, even if in the case of ODRI. Some features are very different compared to the other polarization state. Here the central symmetry line does not carry any relevant information, while the interesting profiles are the lines separated by about 1/γ from the center, where the maximum of the intensity is located. From the profile of the bottom line we can retrieve the beam parameters and compare them with the results given by the other polarization. The parameter values for vertical and horizontal polarization are 77 µm and 70 µm respectively for the σy and 203 µrad and 211 µrad for σy′.
Figure 4. Top: angular distribution of the ODRI radiation at 800 nm with superimposed fit of data points. Bottom: image of the angular distribution on the detector. Fit results:σy=81 µm, σy′=203 µrad.
Figure 5. Top: angular distribution of the ODRI radiation at 550 nm with superimposed fit of data points. Bottom: image of the angular distribution on the detector. Fit results:σy=76 µm, σy′=193 µrad.
Figure 6. Top: angular distribution of the ODRI radiation at 800 nm with superimposed fit of data points. Bottom: image of the angular distribution on the detector. Fit results:σy=77 µm, σy′=203 µrad.
Figure 7. Top: angular distribution of the ODRI radiation at 800 nm with superimposed fit of data points. Bottom: image of the angular distribution on the detector. Fit results:σy=70 µm, σy′=211
µrad, σx′=122 µrad
Again these values are consistent with each other. From the horizontal polarization it is also possible to measure the angular divergence σx′=122 µrad, while the vertical polarization is not
sensitive to this parameter. From the analysis of the two dimensional angular distribution an unexpected asymmetry between the upper and the lower part of the image is evident. A clear signature of unwanted background light is also visible in the left side of the image. Further investigations are needed in order to clearly identify this problem. At this point these behaviors can be explained only with some residual contribution of the SR background.
Figure 8. Top: angular distribution of the ODRI radiation at 550 nm with superimposed fit of data points. Bottom: image of the angular distribution on the detector. Fit results:σy=70 µm, σy′=160
µrad, σx′=123 µrad
Figure 9. Top: angular distribution of the ODRI radiation at 800 nm with superimposed fit of data points. Bottom: image of the angular distribution on the detector. Fit results:σy=75 µm, σy′=211
µrad, σx′=122 µrad
As further benchmark of our model we compared also the angular distribution of the horizontal polarization at two different wavelengths in Fig. 8 and Fig. 9. The value obtained from the fit are 70 µm and 75 µm respectively for the case at 550 nm and 800 nm while the σy′
are 160 and 221 µrad, and the σx′ are 123 µrad and 122 µrad. From the images the unwanted
background is also clearly visible on the left side.
To further check our results we compared the retrieved values of the beam dimension obtained by ODRI with conventional measurement with single pulse imaging an aluminated OTR screen. In all the cases the agreement is better than 10
5. Conclusion
The optical diffraction radiation interference (ODRI) can be successfully used as non intercepting beam size monitor. Moreover, the beam angular divergence can be retrieved as well from the analysis of the radiation angular distribution. In this paper we extend our analysis considering angular distributions produced at different wavelengths and with different polarization states. The comparison between different wavelengths shows a very good agreement for the vertical polarization component. Also the cross check between the two polarization states is totally satisfactory being the difference well below the 10 %. For the first time the horizontal polarization of ODR has been observed. An unwanted bright spot is visible in this case, probably
originating from an unshielded background component. Further investigations are needed in order to understand the reason.
Acknowledgments
We thank DESY for the opportunity to perform our experiment at the FLASH facility. Special thanks are given to the FLASH operators for their help to setup the machine. We thank also Christian Wiebers for his important contribution to the mechanical construction of the experiment setup and Hans-Christian Schrder for the design of the apochromatic lens.
References
[1] Ter-Mikaelian 1972 High Energy electromagnetic Process in Condensed Media (New York, Wiley-Interscience) [2] Castellano M 1997 Nucl. Instrum. Methods Phys. Res., Sect. A 394, 275.
[3] Karataev P, Araki S, Hamatsu R, Hayano H, Muto T, Naumenko G, Potylitsyn A, Terunuma N and Urakawa J. 2004 Phys. Rev. Lett. 93 244802.
[4] Karataev P, Araki S, Hamatsu R, Hayano H, Muto T, Naumenko G, Potylitsyn A, Terunuma N and Urakawa J 2005 Nucl. Instrum. Methods Phys. Res., Sect. B 394 158
[5] Muto T, Araki S, Hamatsu R , Hayano H, Hirose T, Karataev P, Naumenko G, Potylitsyn A and Urakawa J 2003 Phys. Rev. Lett. 394 104801
[6] Naumenko G A 2003 Nucl. Instrum. Methods Phys. Res., Sect. B 394, 184
[7] Cianchi A, Castellano M Catani L, Chiadroni E, Honkavaara K. and Kube G. 2011 Physical Review Special Topics - accelerators and beams 14, 102803
[8] Ackermann W et al. 2007 Nat. Photon. 1, 336