Direct and indirect non-disjunction in the origin of trisomy in cultured human lymphocytes
6
0
0
Testo completo
(2) S.Minissi et al.. Fig. 1. Experimental schedule.. The observed frequencies of trisomic M2 c-metaphases, evaluated in FPG stained cells, were compared with the expected frequencies calculated on the basis of data on laggards (chromosome/chromatid loss), condensed MN and MND in binucleate cells. However, since it has been demonstrated that in the presence of cytochalasin B (cyt B) the frequency of colchicine-induced lagging chromosomes/ chromatids and of MN in human lymphocyte cultures is ~50% lower than in the absence of cyt B, possibly due to engulfment of laggards by the nearest daughter nucleus (Minissi et al., 1999), data on MND were corrected accordingly. Our results show that the contribution of MND to the origin of trisomic karyotypes is 3- to 5-fold higher than that of MIND in human lymphocytes treated in vitro with low concentrations of colchicine. Moreover, a ratio between 1/3 and 1/6 of observed versus expected frequency of trisomic M2 c-metaphases was recorded, indicating a strong reduction in trisomic cells in the M2 population. Materials and methods Cell culture, chemical treatment and cell fixation Lymphocyte cultures were established with blood collected from a healthy female donor aged 35. The donor was chosen on the basis of a preliminary cytogenetic analysis, which revealed a very low spontaneous frequency of both chromosomal aberrations and mitotic anomalies. For each culture, 0.5 ml of whole blood were added to 4.5 ml of RPMI1640 medium (Sigma) supplemented with 20% heat-inactivated fetal bovine serum (Hyclone), 2% PHA (Murex), 1% L-glutamine (Gibco), antibiotics (100 IU penicillin/ml and 0.1 mg/ml streptomycin) (Gibco) and 30 µM 5BrUdR and incubated at 37°C. Colchicine (10 and 25 nM) was added to the cultures 24 h after PHA addition and was present until fixation. In a previous work it was demonstrated that such concentrations are most suitable to induce single chromosome misdistributions in human lymphocytes (Gustavino et al., 1994). In order to obtain binucleate cells, 44 h after PHA stimulation cyt B (Sigma) was added at a final concentration of 6 µg/ml to part of the established cultures. Triplicate cultures were made for each experimental point. According to the experimental schedule in Figure 1a, harvesting times were chosen in order to analyse: (i) spontaneous trisomic frequency values in M1 cells (at 48 h); (ii) MN-generating events, i.e. anaphase chromosome and chromatid laggards (at 66 and 72 h); (iii) direct non-disjunction, i.e. MND (at 66 h); (iv) MN condensation in M2 prophase cells (at 66 and 72 h); (v) M2. 558. trisomic cells (at 72 h). Cultures were fixed according to the air drying method (Moorhead et al., 1960) after a mild hypotonic treatment (75 mM KCl for 2 min at room temperature) to preserve the cytoplasm. In order to obtain c-metaphase cells, half of the cultures of each set were treated with 0.5 µM colchicine 2 h before fixation at 48 and 72 h from the onset of culture (Figure 1b). In this case, hypotonic treatment was 75 mM KCl for 12 min at 37°C. Cyt B-treated cultures for the analysis of binucleate cells were harvested 66 h from the onset of culture, to avoid scoring second generation binucleated cells (Sgura et al., 1997; Figure 1c). After a mild hypotonic treatment (75 mM KCl for 2 min at room temperature) to preserve the cytoplasm, cells were gently fixed four times with methanol/acetic acid (5:1) according to the protocol developed by our group for MN analysis in binucleate cells (Surralle´s et al., 1992). Fixed cells were stored at –20°C. FPG stained slides: analysis of micronuclei in prophases, laggards in anatelophases and chromosome counting in c-metaphases Slides were FPG stained (Perry and Wolff, 1974) so that c-metaphases could be distinguished as M1, M2 or M31 (M31 are cells which have performed at least three mitotic cycles after PHA stimulation), while ana-telophases and prophases could be distinguished only as M1 and M21. For each experimental point at least 500 M1 bipolar ana-telophases were analysed for lagging chromosomes/chromatids (cells fixed at 66 h), at least 200 M21 prophases were scored to detect single MN with or without synchronous mitotic condensation (cells fixed at 72 h) and 150 (cells fixed at 48 h) and 300 (cells fixed at 72 h) M1 c-metaphases and 600 M2 c-metaphases (cells fixed at 72 h) were scored for chromosome number. Only c-metaphases containing at least 40 chromosomes were scored. Slides were coded and scored blind by two scorers. Each scorer analysed half of the cells from each culture. FISH analysis: interphase nuclei and c-metaphases FISH was performed using commercial centromeric DNA probes (Oncor) specific for the alphoid sequences of chromosomes 7 (biotin-conjugated probe) and 11 (digoxigenin-conjugated probe). Chromosomes 7 and 11 were probed simultaneously using FITC and rhodamine as fluorescent labels. For metaphase analysis, combined differential sister chromatid staining and centromeric FISH was carried out according to Kulka et al. (1995) with some modifications. Briefly, prior to FISH, slides were stained with 1 µg/ml bisbenzimide (Hoechst 33258; Sigma) at 20°C for 15 min in the dark. Subsequently, slides covered with a thin layer of the same Hoechst solution were exposed for 30 min to UV light (Osram no. L36W/73) at 20 cm distance. Slides were then washed in phosphate-buffered saline (PBS), dehydrated in 70, 90 and 100% cold ethanol and dried for 30 min at 65°C. Starting from this point, FISH was carried out as follows for both interphase and metaphase analysis. Slides were pretreated with pepsin (Sigma) (50 µg/ml in 0.01 N HCl, 5 min at 37°C), dehydrated (3 min in cold 70, 90 and 100% ethanol) and denatured (70% formamide, 23 SSC, 2 min at 70°C). The probes were denatured at 70°C.
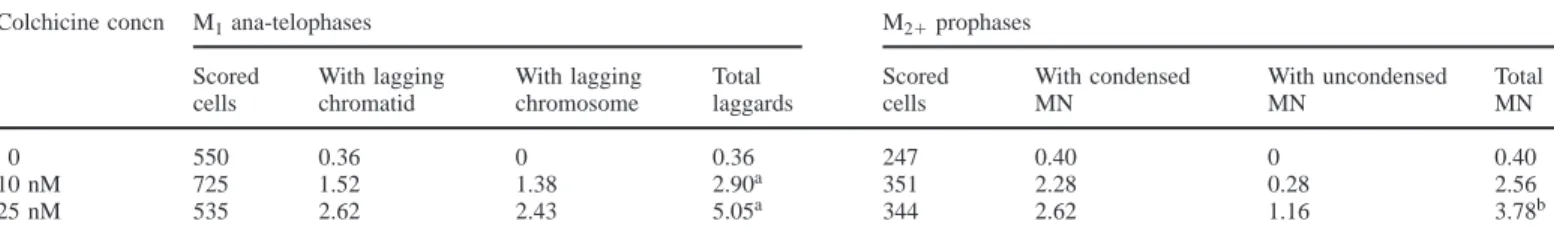
(3) The origin of trisomy in cultured lymphocytes. Table I. Percentage frequency of single lagging chromosomes/chromatids in M1 bipolar ana-telophases and of single micronuclei (MN), with or without synchronous mitotic condensation, in M21 prophases of cultured human lymphocytes treated with colchicine Colchicine concn. 0 10 nM 25 nM. M1 ana-telophases. M21 prophases. Scored cells. With lagging chromatid. With lagging chromosome. Total laggards. Scored cells. With condensed MN. With uncondensed MN. Total MN. 550 725 535. 0.36 1.52 2.62. 0 1.38 2.43. 0.36 2.90a 5.05a. 247 351 344. 0.40 2.28 2.62. 0 0.28 1.16. 0.40 2.56 3.78b. Colchicine-treated and untreated cell populations were compared by Fisher’s exact test. aP , 0.01. bP , 0.05. for 5 min. Hybridization was performed overnight at 37°C in a moist chamber. Post-hybridization washing consisted of three washes of the slides for 5 min each in 50% formamide, 23 SSC at 42°C, followed by three washes of 5 min each in 0.13 SSC at 60°C. Detection of the biotin-labelled chromosome 7 probe was carried out with FITC–avidin (Oncor) and the fluorescence intensity was amplified using biotinylated anti-avidin antibody (Oncor), followed by an additional layer of FITC–avidin. The digoxigenin-labelled chromosome 11 probe was immunodetected using a mouse anti-digoxigenin antibody (Boehringer Mannheim) followed by an anti-mouse-digoxigenin antibody (Boehringer Mannheim) and anti-digoxigenin–rhodamine antibody (Boehringer Mannheim). After immunodetection slides were counterstained with DAPI (0.2 µg/ml) and mounted in Vectashield (Vector laboratories). The slides were examined with a Zeiss Axiophot microscope fitted with a FITC/rhodamine double bandpass filter set and a DAPI single bandpass filter set. For each experimental point, 1500 binucleate cells (cyt B-treated) with wellpreserved cytoplasm were scored. To evaluate the distribution of mono-, bi- and multinucleate cells, 200 cells per experimental point were preliminarily scored. The large majority of binucleate cells was expected to have a total number of four signals for each probed chromosome. Among the cells with four signals: normal (diploid) cells were expected to contain two signals for each chromosome in each nucleus (2/2); a cell showing a trisomic and a monosomic nucleus (3/1) was expected to be due to MND; a loss event was expected to give rise to a diploid and a monosomic nucleus (2/1) with a FISH-positive MN. Cells with an odd number of signals (1/2 and 2/3) were considered to be artefacts. In order to investigate a possible bias in the analysis of the class of interest (3/1), frequencies of cells due to artefacts were used to estimate the burden of artefacts in originating the class of interest. Such a probability was calculated as follows: on pooled data, the mean frequency of 2/1 cells was assumed to be representative of the probability of a ‘minus’ artefact [inefficiency of probe penetration or overlap of hybridization signals (Eastmond and Pinkel, 1990)]. The mean frequency of 3/2 cells was assumed to be representative of the probability of a ‘plus’ artefact [splitting of the hybridization region (Eastmond and Pinkel, 1990) or non-specific hybridization]. Therefore, the probability of obtaining 3/1 cells due to double independent artefacts was estimated by multiplying ‘minus’ by ‘plus’ events. With the present data, the estimated burden of artefacts in originating the class of interest (3/1 cells) was 0.053 and 0.047% for chromosomes 7 and 11, respectively. For each experimental point, at least 500 M1 and 500 M2 c-metaphases (cells fixed at 72 h) with not less than 40 chromosomes were scored. Slides were coded and scored blind by two scorers. Each scorer analysed half of the cells. Statistical analysis For statistical analysis of the data the χ2 and Fisher’s exact test were performed in order to evaluate the differences between: the frequency of chromosome/ chromatid loss, MN and trisomic c-metaphases in control and colchicine-treated cultures; the frequency of hybridization signals observed for chromosomes 7 and 11; expected and observed frequencies of trisomic M2 c-metaphases.. Results Analysis of lagging chromosomes/chromatids in bipolar M1 ana-telophases The frequencies of single lagging chromosomes/chromatids in M1 bipolar ana-telophases obtained scoring FPG stained slides at 66 h culture time in lymphocytes from one donor are reported in Table I. A significant increase in the frequency of. Table II. Percentage frequency of trisomic, hyperdiploid and tetraploid M1 and M2 FPG stained c-metaphases of cultured human lymphocytes treated with colchicine Colchicine concn Mitosis Scored cells 0 10 nM 25 nM. M1a M1b M2b M1a M1b M2b M1a M1b M2b. 150 300 600 150 300 600 150 300 600. 2n 1 1. 2n 1 1 , x , 4n. 4n. 2 0.67 0.33 1.33 0.67 1.83c 1.33 0.33 1.83c. 0.67 0 0 0 0 0 0 0 0.17. 0 0 0.33 0 0 0 0 0 0.33. Colchicine-treated and untreated M2 trisomic c-metaphases were compared by Fisher’s exact test. M1 trisomic c-metaphases at 48 and 72 h were compared by Fisher’s exact test, regardless of colchicine treatment. a48 h cultures. b72 h cultures. cP , 0.025.. laggards was observed following treatment with colchicine being 0.36% in the control culture, 2.90% at 10 nM and 5.05% at 25 nM colchicine. The ratio between the relative frequencies of a single lagging chromosome and a single lagging chromatid was close to 1:1. Similar results were obtained previously (Gustavino et al., 1994). Analysis of micronuclei in M21 prophases Data about the analysis of M21 prophases are also summarized in Table I. MN frequency significantly increased as colchicine concentration increased, being 0.40, 2.56 and 3.78% in control, 10 nM and 25 nM colchicine, respectively. Pooling data from cultures treated with both colchicine concentrations, 77% of single MN in M21 prophase cells were in synchronous mitotic condensation with the main nucleus. Such a high probability of MN recovery is in accordance with that observed in our previous work, where 80% of MN induced in human lymphocytes by colcemid treatment was in synchronous mitotic condensation (Gustavino et al., 1994). No premature chromatin condensation of MN (MN-PCC) was found. Analysis of c-metaphases The spontaneous frequency of trisomic cells was estimated by chromosome counting in M1 c-metaphases in 48 and 72 h cultures (FPG stained slides) (Table II). As expected, no statistically significant difference in trisomic cell frequency was observed either in relationship to colchicine concentration or in relationship to fixing time (Fisher’s exact test, P 5 0.77) 559.
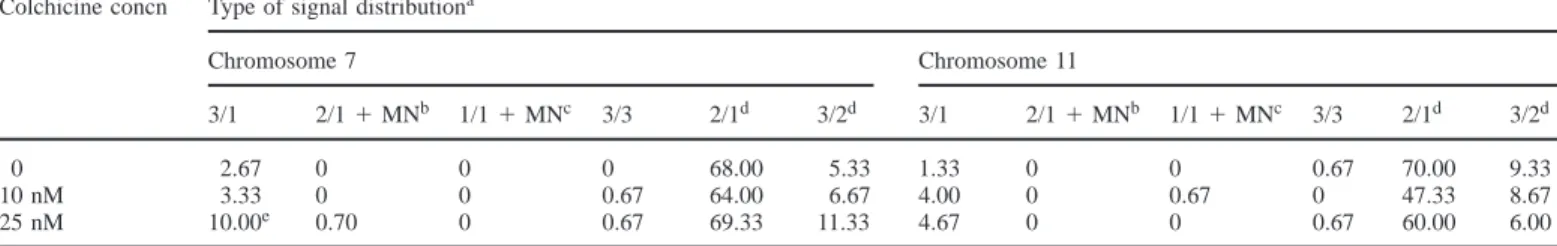
(4) S.Minissi et al.. Table III. Percentage frequency of cells containing one, two, three or four hybridization signals in c-metaphases of 72 h cultured human lymphocytes using centromeric DNA probes for chromosomes 7 and 11 Colchicine concn. Mitosis. Scored cells. Number of hybridization signalsa Chromosome 7. 0, 10 and 25 nM 0 10 nM 25 nM. M1b M2 M2 M2. 1556 526 512 556. Chromosome 11. 1. 2. 3. 4. 1. 2. 3. 4. 1.22 3.23 3.125 0.89. 98.53 96.77 96.875 98.56. 0.06 0 0 0. 0.19 0 0 0.54. 4.43 1.52 4.88 4.32. 95.37 98.48 95.12 95.14. 0 0 0 0. 0.19 0 0 0.54. aCells showing one or three spots for one of the probed chromosomes always had two spots for the other probed chromosome. Cells showing four spots for one probed chromosome always had four spots also for the other probed chromosome: they were polyploid cells. bData from different colchicine concentrations were pooled since, as expected, no significant difference was observed in relation to colchicine concentration.. Table IV. Distribution of hybridization signals in binucleate cells of 66 h cultured human lymphocytes using centromeric DNA probes for chromosomes 7 and 11 Colchicine concn. Type of signal distributiona Chromosome 7. 0 10 nM 25 nM. Chromosome 11. 3/1. 2/1 1 MNb. 1/1 1 MNc. 3/3. 2/1d. 3/2d. 3/1. 2/1 1 MNb. 1/1 1 MNc. 3/3. 2/1d. 3/2d. 2.67 3.33 10.00e. 0 0 0.70. 0 0 0. 0 0.67 0.67. 68.00 64.00 69.33. 5.33 6.67 11.33. 1.33 4.00 4.67. 0 0 0. 0 0.67 0. 0.67 0 0.67. 70.00 47.33 60.00. 9.33 8.67 6.00. Frequencies are expressed per thousand binucleate cells. For each experimental point 1500 cells were scored. Colchicine-treated and untreated 3/1 cells were compared by the χ2 test. aThe numbers separated by the slash indicate the number of spots detected on each nucleus of a binucleate cell; MN indicates a FISH-positive micronucleus in a binucleate cell. bWith one spot. cWith two spots. dData used when calculating burden of artefacts as explained in Materials and methods. eP , 0.025.. among the M1 c-metaphases. Thus, at the same fixing time data were pooled and the mean value of the mean frequencies observed at the two sampling times was assumed to be representative of the spontaneous frequency of trisomy in M1 c-metaphases. This value was 1.06%. Trisomy in M1 c-metaphases was also studied by FISH analysis for the presence of three hybridization signals of chromosome 7 or 11. On pooled data, only one of the 1556 screened cells showed three signals for one of the probed chromosomes (chromosome 7), thus the estimated value for any chromosome is 0.74% (Table III). The colchicine-induced frequency of trisomic cells was estimated by chromosome counting in M2 c-metaphases in 72 h cultures (FPG stained slides) (Table II). A significant increase in the relative frequency of trisomic M2 cells was evident in colchicine-treated cultures compared with untreated ones. M2 c-metaphases were also studied by FISH analysis for the presence of three hybridization signals of either chromosome 7 or 11. None of the scored cells showed three spots (Table III). FISH analysis of interphase nuclei The results of in situ hybridization on binucleate lymphocytes with chromosome 7 and 11 centromeric probes are shown in Table IV. The frequencies of spot distribution in daughter nuclei and MN are expressed per thousand cells. Binucleate cells were 42, 40 and 36% of activated cells in cultures treated with 0, 10 and 25 nM colchicine, respectively; 560. multinucleate (tri- and tetranucleate) cells were 2, 3 and 2% of activated cells in cultures treated with 0, 10 and 25 nM colchicine, respectively. The use of centromeric probes for chromosomes 7 and 11 provided evidence for a significant increase in the frequency of induced MND (3/1) for chromosome 7 in cells treated with 25 nM colchicine compared with control cultures (Table IV). For both the colchicine concentrations, no significant difference in the increase in frequency of 3/1 cells compared with the untreated controls was observed between the probed chromosomes. Furthermore, FISH analysis showed the presence of binucleate cells with 3/3 spot distributions. These cells were likely to originate from trisomic circulating lymphocytes that underwent mitosis (Zijno et al., 1996). Thus, the mean frequency of 3/3 binucleate cells was calculated on pooled data to estimate the spontaneous frequency of trisomy, for probed chromosomes, measured after the first cell division. Both probed chromosomes had a frequency of 0.44 per 1000 cells for spontaneous trisomy. Discussion The present experiments were designed to provide information about the different mechanisms (MND and MIND) involved in the origin of trisomic karyotypes in human lymphocytes treated in vitro with low concentrations of colchicine. Spontaneous and induced chromosome missegregation was evaluated at different cytogenetic levels: (i) chromosome.
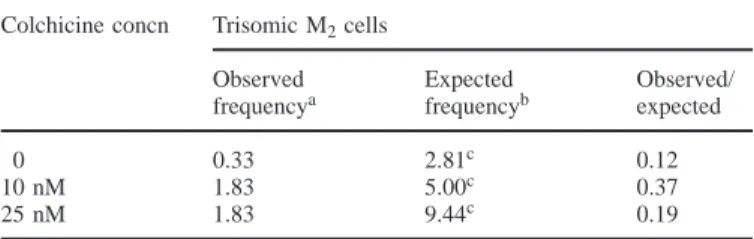
(5) The origin of trisomy in cultured lymphocytes. loss, directly measured by the analysis of lagging chromosomes/chromatids at ana-telophase in M1 (MN-generating event); (ii) recovery of MN at the following prophase, which may be the origin of MIND, directly measured by the frequency of MN synchronous condensation; (iii) co-segregation of sister chromatids in binucleate cells (MND); (iv) spontaneous frequency of trisomic M1 c-metaphases; (v) induced frequency of trisomic M2 c-metaphases. The spontaneous frequency of trisomic cells was estimated based on the results of both FISH analysis and chromosome counting. The frequency estimated by chromosome counting in FPG stained M1 c-metaphases was 1.06%. The spontaneous frequency of trisomic cells estimated by FISH analysis for chromosomes 7 and 11 in M1 c-metaphases was 0.74%. The spontaneous frequency of trisomic cells estimated by FISH analysis for chromosomes 7 and 11 in 3/3 binucleate cells was 1.02%. Estimation based on the results of FISH analysis can be obtained by multiplying the mean frequency, between the probed chromosomes, of the class of interest by 23, assuming that all chromosomes behave similarly. With the exception of sex chromosomes, this is fairly true, as evidenced by Marshall et al. (1996) by FISH probing for six different chromosomes (1, 8, 11, 17, 18 and X) in binucleate cells after aneuploidy induction with spindle poisons. Our results further support this approach, since the different estimations of the spontaneous frequency of trisomy obtained are very similar. The expected relative frequencies of trisomic cells at the first mitosis after misdistribution at each colchicine concentration were calculated on the basis of the model and the assumptions described in Rizzoni et al. (1989), with some modifications due to the introduction of molecular cytogenetic analysis (FISH). The following equation was used: f (2n 1 1) 5 syc(0.5 cmsl 1 0.25 ctdl) 1 23(0.5 nd(7–11)) 1 cnt d. d. d. d. f (2n 1 1) is the expected relative frequency of trisomic cells among all the c-metaphases at the first mitosis after misdistribution. cmsl and ctdl are the sum of the probabilities of chromosome (cmls) and chromatid (ctdl) losses for any chromosome, measured as the relative frequency of ana-telophases with a single lagging chromosome or chromatid among all the M1 ana-telophases. syc is the mean probability of synchronous mitotic condensation of MN (containing any whole chromosome) with the main nucleus, measured as the relative frequency of single MN synchronously condensed with the main nucleus in colchicine-treated prophase cells, among all single MN in colchicine-treated prophase cells at the first mitosis after misdistribution. It is noteworthy that in cells treated with spindle poisons 80–90% of induced MN originated from whole chromosomes (Surralle´s et al., 1995; Huber et al., 1996; Sgura et al., 1997). nd(7–11) is the mean probability of MND for chromosome 7 or 11 measured as the mean frequency of binucleate cells with a 3/1 hybridization signal distribution for either probed chromosome minus the estimated burden both of artefacts due to FISH staining and of the ‘engulfment effect’ due to cyt B treatment (Minissi et al., 1999). The mean value between chromosomes 7 and 11 was multiplied by 23 in order to obtain an overall frequency of MND comparable to cmls and ctdl, under the assumption that all chromosomes behave similarly (Eastmond and Pinkel, 1990; Marshall et al., 1996).. Table V. Comparisons between observed and expected frequencies (%) of induced trisomic M2 cells in cultured human lymphocytes treated with colchicine Colchicine concn. 0 10 nM 25 nM. Trisomic M2 cells Observed frequencya. Expected frequencyb. Observed/ expected. 0.33 1.83 1.83. 2.81c 5.00c 9.44c. 0.12 0.37 0.19. Observed and expected frequencies were compared by the χ2 test. aEvaluated by chromosome counting in M c-metaphases, FPG stained 2 slides (see Table II). bCalculated as follows: f 5 syc(0.5cmsl 1 0.25ctdl) 1 23(0.5 nd (7–11)) 1 cnt, where syc is the observed relative frequency of single MN synchronously condensed with the main nucleus in colchicine-treated M2 prophases, cmsl and ctdl are the observed relative frequencies of anatelophases with a single lagging chromosome or chromatid among all the M1 ana-telophases, nd(7–11) is the mean frequency of binucleate cells with a 3/1 hybridization signal distribution for either probed chromosome minus the estimated artefact burden due to FISH staining (see Materials and methods) and the effect of cyt B (see Introduction) and cnt is the spontaneous frequency of trisomic M1 c-metaphases in FPG stained slides. cP ,, 0.001.. cnt is the spontaneous frequency of trisomic cells for any chromosome measured as the frequency of trisomic M1 c-metaphases in FPG stained slides. Data obtained from cyt B-treated and untreated cultures were used in the same equation since it was demonstrated that, with the present protocol, the addition of 6 µg/ml cyt B does not interfere with the duration of the cell cycle (Minissi et al., 1999). The observed frequencies of M2 trisomic metaphases are much lower than the expected ones, their ratios ranging between 1/6 and 1/3. Such a difference is highly significant using the χ2 test (Table V). This suggests that the induction of a single chromosome misdistribution at anaphase does not result in a corresponding increase in the frequency of M2 trisomic metaphases, at least within the time limit of our investigation. This remarkable difference might be due to a block of cell cycle progression which could result either in a mitotic delay or death of trisomic cells. A similar evolution was observed by other authors: vinblastine-induced hyperdiploid bone marrow cells of mouse treated in vivo underwent a reduction in frequency in the cell population due to selection (Gustavino et al., 1991); a comparison of induced aneuploidy in interphase nuclei with corresponding metaphase cells (Raimondi et al., 1989) showed that hyperdiploidy was greater in interphase cells than in metaphases. The authors suggest that the observed discrepancy may represent a selective block against aneuploid cells. However, in a study on untreated human lymphocytes, similar incidences of hyperdiploid interphases and metaphases at the first mitosis in vitro were recorded (Carere et al., 1998). By FISH analysis it was possible to evaluate MND and consequently to compare the contribution of MND and MIND to the origin of trisomic karyotypes. Following the proposed equation, the contribution of MND is given by 233(0.5 nd(7–11)) 5 cMND. The contribution of MIND is given by syc(0.5 cmsl 1 0.25 ctdl) 5 cMIND. With the present data, for untreated cultures cMND 5 1.68% and cMIND 5 0.07% and their ratio is 24.0. For colchicine-treated cultures cMND 5 3.11% and cMIND 5 0.83% with 10 nM colchicine. d. 561.
(6) S.Minissi et al.. and their ratio is 3.7. With 25 nM colchicine cMND 5 6.94% and cMIND 5 1.44% and their ratio is 4.8. Following our data, in mitotically activated human lymphocytes treated in vitro with low concentrations of colchicine MND plays a more important role than MIND in the induction of trisomy. A major role of MND in the origin of trisomic cells is also suggested by other authors, who observed that 3/1 binucleate cells are more frequent than FISH-positive MN in cultured human lymphocytes treated with spindle poisons (Marshall et al., 1996; Elhajouji et al., 1997; Sgura et al., 1997). However, a more accurate comparison between MND and MIND was possible, allowing the finding of engulfment of MN in the main nucleus due to cyt B treatment (Minissi et al., 1999). In a previous paper, a major role of MIND compared with MND in the origin of trisomic cells was proposed on the basis of the relative frequencies of laggards, MN (in synchronous mitotic condensation with the main nucleus) and M2 trisomic c-metaphases (Gustavino et al., 1994). In the present paper the introduction of FISH analysis allowed us to quantify induced MND and to show its high incidence in colchicinetreated human lymphocytes. However, the observed frequency of induced M2 trisomic c-metaphases does not correspond to the frequency of trisomic cells due to MND, suggesting the possibility of cell cycle lengthening or death among trisomic cells. Even if our conclusions are restricted to data obtained on one single donor, yet they can be indicative of a more general process taking place in human lymphocytes. Our data confirm the suitability of FISH on binucleate lymphocytes as a method for the analysis of chromosome segregation, even if a deeper understanding of the differences observed between approaches (FISH and chromosome counting) and of the evolutionary dynamics of cell populations is needed. As a conclusion, while in plant cells treated with low concentrations of a spindle poison MIND plays a major role in the induction of trisomy, in Chinese hamster cells MND prevails (Rizzoni et al., 1989). In primary human lymphocytes MIND was demonstrated to take place (Gustavino et al., 1994), however, the present study shows that its contribution is of minor importance, as compared with that of MND, in the production of trisomic karyotypes. Acknowledgement The authors thank Prof. M.Rizzoni for helpful discussion and critical reading of the manuscript.. References Carere,A., Antoccia,A., Cimini,D., Crebelli,R., Degrassi,F., Leopardi,P., Marcon,F., Sgura,A., Tanzarella,C. and Zijno,A. (1998) Genetic effects of petroleum fuels: II. Analysis of chromosome loss and hyperploidy in peripheral lymphocytes of gasoline station attendants. Environ. Mol. Mutagen., 32, 130–138. Degrassi,F. and Tanzarella,C. (1988) Immunofluorescence staining of kinetochores in micronuclei: a new assay for the detection of aneuploidy. Mutat. Res., 203, 339–345. Dulout,F.N. and Natarajan,A.T. (1987) A simple and reliable in vitro test system for the analysis of induced aneuploidy as well as other cytogenetic end-points using Chinese hamster cells. Mutagenesis, 2, 121–126. Eastmond,D.A. and Pinkel,D. (1990) Detection of aneuploidy and aneuploidyinducing agents in human lymphocyte using fluorescence in situ hybridization with chromosome-specific DNA probes. Mutat. Res., 234, 303–318.. 562. Elhajouji,A., Tibaldi,F. and Kirsch-Volders,M. (1997) Indication for thresholds of chromosome non-disjunction versus chromosome lagging induced by spindle inhibitors in vitro in human lymphocytes. Mutagenesis, 12, 133–140. Fenech,M. and Morley,A.A. (1985) Measurement of micronuclei in lymphocytes. Mutat. Res., 147, 29–36. Gustavino,B., Bassani,B. and Pacchierotti,F. (1991) Vinblastine-induced numerical chromosome changes and selection processes in mouse bone marrow cells. Mutat. Res., 248, 45–50. Gustavino,B., Degrassi,F., Filipponi,R., Modesti,D., Tanzarella,C. and Rizzoni,M. (1994) Mitotic indirect nondisjunction in phytoemagglutinin stimulated human lymphocytes. Mutagenesis, 9, 17–21. Heddle,J.A., Cimino,M.C., Hayashi,M., Romagna,F., Shelby,M.D., Tucker,J.D., Vanparys,Ph. and MacGregor,J.T. (1991) Micronuclei as an index of cytogenetic damage: past, present and future. Environ. Mol. Mutagen., 18, 27–291. Huber,R., Salassidis,K., Kulka,U., Braselmann,H. and Bauchinger,M. (1996) Detection of centromeres in vinblastine- and radiation-induced micronuclei of human lymphocytes using FISH with an alpha satellite pancentromeric DNA probe. Environ. Mol. Mutagen., 27, 105–109. Kulka,U., Huber,R., Muller,P., Knehr,S. and Bauchinger,M. (1995) Combined FISH painting and harlequin staining for cell cycle-controlled chromosome analysis in human lymphocytes. Int. J. Radiat. Biol., 68, 25–27. Liang,J.C. and Satya-Prakash,K.L. (1985) Induction of aneuploidy by mitotic arrestants in mouse bone marrow. Mutat. Res., 155, 61–70. Marshall,R.R., Murphy,M., Kirkland,D.J. and Bentley,K.S. (1996) Fluorescence in situ hybridisation with chromosome-specific centromeric probes: a sensitive method to detect aneuploidy. Mutat. Res., 372, 233–245. Minissi,S., Gustavino,B., Degrassi,F., Tanzarella,C. and Rizzoni,M. (1999) Effect of cytochalasin B on the induction of chromosome missegregation by colchicine at low concentrations in human lymphocytes. Mutagenesis, 14, 43–49. Moorhead,P.S., Nowell,P.C., Nellman,W.J., Battips,D.M. and Hungerford,D.A. (1960) Chromosome preparation of leucocytes cultured from human peripheral blood. Exp. Cell Res., 20, 613–616. Parry,E.M., Danford,N. and Parry,J.M. (1982) Differential staining of chromosomes and spindle and its use as an assay for determining the effect of diethylstilboestrol on cultured mammalian cells. Mutat. Res., 105, 243–252. Perry,P. and Wolff,S. (1974) New Giemsa method for the differential staining of sister chromatids. Nature, 251, 156–158. Pincu,M., Bass,D. and Norman,A. (1984) An improved micronuclear assay in lymphocytes. Mutat. Res., 139, 61–65. Raimondi,E., Scariolo,S., De Sario,A. and De Carli,L. (1989) Aneuploidy assays on interphase nuclei by means of in situ hybridisation with DNA probes. Mutagenesis, 4, 165–169. Rizzoni,M., Tanzarella,C., Gustavino,B., Degrassi,F., Guarino,A. and Vitagliano,E. (1989) Indirect mitotic nondisjunction in Vicia faba and Chinese hamster cells. Chromosoma, 97, 339–346. Sgura,A., Antoccia,A., Ramirez,M.J., Marcos,R., Tanzarella,C. and Degrassi,F. (1997) Micronuclei, centromere-positive micronuclei and chromosome nondisjunction in cytokinesis blocked human lymphocytes following mitomycin C and vincristine treatment. Mutat. Res., 392, 97–107. Surralle´s,J., Carbonnel,E., Marcos,R., Degrassi,F., Antoccia,A. and Tanzarella,C. (1992) A collaborative study on the improvement of the micronucleus test in cultured human lymphocytes. Mutagenesis, 7, 407–410. Surralle´s,J., Catalan,J., Creus,A., Norppa,H., Xamena,N. and Marcos,R. (1995) Micronuclei induced by alachlor, mitomycin-C and vinblastine in human lymphocytes: presence of centromeres and kinetochores and influence of staining technique. Mutagenesis, 10, 417–423 Vanderkerken,K., Vanparys,P.H., Verschaeve,L. and Kirsch-Volders,M. (1989) The mouse bone marrow micronucleus assay can be used to distinguish aneugens from clastogens. Mutagenesis, 4, 6–11. Yamamoto,K.I. and Kikuchi,Y. (1980) A comparison of diameters of micronuclei induced by clastogens and spindle poisons. Mutat. Res., 71, 127–131. Zijno,A., Marcon,F., Leopardi,P. and Crebelli,R. (1994) Simultaneous detection of X-chromosome loss and non-disjunction in cytokinesis-blocked human lymphocytes by in situ hybridization with centromeric DNA probe; implications for the human lymphocyte in vitro micronucleus assay using cytochalasin B. Mutagenesis, 9, 225–232. Zijno,A., Leopardi,P., Marcon,F. and Crebelli,R. (1996) Sex chromosome loss and nondisjunction in women: analysis of chromosomal segregation in binucleate lymphocytes. Chromosoma, 104, 461–467. Received on March 1, 1999; accepted on August 12, 1999.
(7)
Figura

Documenti correlati
The Pb nuclei do not man- ifest any such effect in their groundstate, the stabilizing effect of the Z=82 shell closure seems to be so strong that even when the neutron shell is
NOTE: In the solution of a given exercise you must (briefly) explain the line of your argument and show the main points of your calculations1. Solutions without adequate
Since the product of (possibly coinciding) eigenvalues of A equals det A = −12, this simple eigenvalue
Find for which values of t and a there is a unique solution, no solution, infinitely many
One of the competing hypotheses suggests that local ischaemia of the tissue, caused by occlusion of the capillaries under pressure and subsequent reperfusion damage by oxygen
Section 3 contains the analysis of the asymptotic behavior near the poles of solutions to Schr¨ odinger equations with Hardy type potentials, the proofs of Lemmas 1.2 and 1.3, and
We consider a class of parabolic equations with critical electromagnetic potentials, for which we obtain a classification of local asymptotics, unique continuation results, and
By combining a parabolic Almgren type monotonicity formula with blow-up methods, we evaluate the exact behavior near the singularity of solutions to linear and subcritical
