Financial literacy: a comparative study across four countries
Gianni Nicolini1, Brenda J. Cude2and Swarn Chatterjee21University of Rome ‘Tor Vergata’, Rome, Italy
2University of Georgia, Athens, GA, USA
Keywords
Financial literacy, multinational study, financial behaviour.
Correspondence
Swarn Chatterjee, 106 Housing Research Center, University of Georgia, Athens, GA 30602, USA.
E-mail: [email protected] doi: 10.1111/ijcs.12050
Abstract
This study analysed differences in financial literacy across four countries: Canada, Italy, the UK and the US. The purpose was to understand whether factors associated with financial literacy in one country can be generalized to other countries as well or whether unique national characteristics make it necessary to examine financial literacy in each country individually. A financial literacy index, based on the number of correct answers to four multiple-choice questions, was used to test the relevance of country of origin to financial literacy. Results suggest significant differences among countries indicating that there are national and cultural differences in what households know and need to know about their personal finances. Policy makers should consider these differences when developing financial literacy assessment tools for their respective countries.
Introduction
Internationally, interest in research about financial literacy is strong and ongoing. However, most research has involved data collection in a single country, often using a survey instrument that is also country specific. In some previous research, financial lit-eracy was the singular focus (Chen and Volpe, 2002; Cude et al., 2006; Huston, 2010); in other research, it was a component of a larger study (Lusardi and Mitchell, 2007, 2008a,b; van Rooij et al., 2011). More often than not, the variables assessed by the research and how they were measured were unique within each study. The lack of cross-national research and the inconsistencies across studies present opportunities as well as challenges. This research examines one opportunity – to assess financial literacy and its influences across countries.
This paper consists of the following four sections. The first is a comprehensive literature review that describes previous studies related to definitions and measurement of financial literacy as well as the relationship between financial literacy and financial behav-iours. The methodology section describes the four data sets used in this research as well as the ordered logistic regression models. Results of the regression analyses are described in the next section; regression analyses were used to test two questions: (1) Are there differences in financial literacy across countries? (2) If financial literacy differs between countries, do socio-demographic or financial behaviours or both explain these differences? The paper concludes by proposing a challenge for the future – coordi-nating data collection related to financial literacy across countries.
Literature review
A definition of financial literacy would seem to be a prerequisite for its measurement. Many scholars have defined financial literacy
but the definitions are inconsistent despite Schuchardt et al.’s (2009) call for consistency. Noctor et al. (1992) offered this defi-nition more than 20 years ago: ‘the ability to make informed judgments and to make effective decisions regarding the use and management of money’ (p. 4). This definition centred on consum-ers’ ability and focused on judgment and decisions. Numerous researchers in the past, including ANZ (2008), Beal and Delpachitra (2003), Schagen and Lines (1996), and Worthington (2004, 2006), have used this definition, in part because of its flexibility.
Others have proposed definitions of financial literacy that take a different perspective. Vitt et al.’s (2000) definition was more spe-cific about the skills and abilities relevant to financial literacy: ‘The ability to read, analyse, manage and communicate about the personal financial conditions that affect material wellbeing’ (p. XII). Others (including Kim, 2001; Bowen, 2003; Courchane and Zorn, 2005) have approached the definition from a knowledge perspective. Danes and Haberman (2007) applied Graham’s (1980) definition to describe financial literacy as: ‘the ability to interpret, communicate, compute, develop independent judgment, and take actions resulting from those processes in order to thrive in our complex financial world’ (p. 49).
In yet another approach, the Jump$tart Coalition for Personal Financial Literacy (2007) definition combined knowledge, skills and action: ‘Financial literacy is the ability to use knowledge and skills to manage one’s financial resources effectively for lifetime financial security’ (p. 1). The U.S. President’s Advisory Council on Financial Literacy (2008) as well as academics (Hung et al., 2009) has adopted this comprehensive definition.
Johnson and Sherraden (2006) explained well the value of a definition that combines knowledge and the ability to apply that knowledge when they argued ‘Participation in economic life should maximize life chances and enable people to lead fulfilling International Journal of Consumer Studies ISSN 1470-6423
lives; this requires knowledge and competencies, ability to act on that knowledge and opportunity to act’ (p. 6). Huston (2010) and Remund (2010) asserted that financial literacy combines ‘both knowledge and application (ability) of human capital specific to personal finance’ (Huston, 2010, p. 307) and ‘measures the degree to which one understands key financial concepts (knowledge) and possesses the ability and confidence to manage personal finances through appropriate, short-term decision-making and sound, long-range financial planning, while mindful of life events and chang-ing economic conditions’ (Remund, 2010, p. 284).
Despite the cogent scholarly arguments that financial literacy is more than merely knowledge, many efforts to measure financial literacy have focused solely or primarily on knowledge. With that as background, there have been a multitude of approaches to assessing knowledge. While some (see e.g. Grable et al., 2009; Lusardi and Tufano, 2009) have asked respondents to assess their own knowledge, the primary effort has been objective assessment. A few researchers have asked respondents to answer knowledge questions with binary yes-or-no responses (see e.g. Borden et al., 2008; Servon and Kaestner, 2008; Hung et al., 2009); however, the majority have built knowledge questions with four response options (Volpe et al., 1996; Chen and Volpe, 2002; Beal and Delpachitra, 2003; NASD, 2003; Worthington, 2004; Jones, 2005; Lusardi and Mitchell, 2008a). Some have argued for the addition of a ‘don’t know’ response to knowledge questions (Manton et al., 2006; Hill and Perdue, 2008; Lusardi and Mitchell, 2008a; van Rooij et al., 2011), suggesting that it reduces the possibility of a correct response by a consumer who was forced to guess.
There is little consistency in the questions used to assess finan-cial literacy other than the repeated use of questions written by Lusardi and Mitchell. These questions test consumers’ knowledge about inflation, compound interest, diversification, and stock and bond ownership. The questions have appeared in multiple tests of financial literacy,1 either exactly as written originally or with modification.
There are inconsistencies in the literature about whether finan-cial literacy measures should assess comprehensive or specific financial knowledge. Both Remund (2010) and Huston (2010) argued for operational definitions of financial literacy that span budgeting, saving, borrowing and investing. Many (Chen and Volpe, 2002; FSA, 2006; NEFE, 2006; U.S. Department of the Treasury, Office of Financial Education, 2006; ANZ, 2008; Financial Fitness for Life, 2008; Jump$tart Coalition for Personal Financial Literacy, 2008; National Foundation for Credit Counseling, 2008) have adopted this broad approach to assess financial literacy. Others (e.g. Worthington, 2006) have argued for a more focused approach in which financial knowledge is
measured in the context of individual needs and circumstances. Researchers following this approach have assessed knowledge in a single area of personal finance such as investments (Volpe et al., 1996), the US stock market (NASD, 2003; Müller and Weber, 2008), credit (Jones, 2005) and debt (Lusardi and Tufano, 2009).
There is greater uniformity among researchers about using responses to financial knowledge questions to create a single measure of financial literacy. Usually, the measure is the total number of questions answered correctly (Volpe et al., 1996; Moore, 2003; NASD, 2003; Worthington, 2004; Atkinson et al., 2006; Borden et al., 2008; Servon and Kaestner, 2008; Hung et al., 2009) but others have asked a limited number of questions and analysed the responses to each question separately (Lusardi and Mitchell, 2008b; Lusardi and Tufano, 2009). Some research-ers (Kempson, 2009) also suggested weighting knowledge data to account for the relative relevance and difficulty of the questions.
Although financial literacy assessment results are not necessar-ily comparable to each other, scholars have been consistent in describing the populations they studied as having a less than ideal level of knowledge. In the US, whether it was investors (NASD, 2003), Washington state residents involved in predatory lending cases (Moore, 2003), American college students (Volpe et al., 1996; Chen and Volpe, 1998, in a study focused on investing), high school students (Mandell and Klein, 2009), older US women (Lusardi and Mitchell, 2008a), or a general population of US adults (Lusardi and Tufano, 2009), financial knowledge tests indi-cated fewer than 50% of respondents were knowledgeable, with a mean score as low as 22% in some assessments. Researchers also have demonstrated low levels of financial knowledge in other countries, including the UK (Atkinson et al., 2006), Japan (OECD, 2005) and the Netherlands (van Rooij et al., 2011). In a more sophisticated approach to determine financial literacy, Huston (2010) assessed both knowledge and the ability to apply knowledge. Using a sample from Ohio State University’s Con-sumer Finance Monthly survey, she evaluated only 14% of respondents as ‘fully financially literate’ and the majority (54%) as failing.
With globalization, individuals have opportunities to buy finan-cial goods and services anywhere. Consumers who live in coun-tries with less sophisticated financial markets no longer are insulated from more sophisticated choices. Thus, cross-national differences in financial literacy are as relevant as within-country differences. The Organisation for Economic Development (2005) called for cross-national work to account for economic, demo-graphic and policy influences on financial literacy.
Reliable estimates of financial knowledge are more critical if financial knowledge leads to improved financial behaviours that ultimately improve consumers’ well-being. The evidence on the relationship between financial knowledge and financial behaviours is mixed, in part due to definitional and measurement issues. Willis (2008) stated that ‘financial literacy is not sufficient for good financial decision making’ (p. 201). In a study of American college students, Borden et al. (2008) found that financial knowledge was not a significant predictor of either effective financial behaviours or risky financial behaviours. However, several researchers have found links between financial knowledge and positive financial behaviours. Researchers have linked financial knowledge with
1The Lusardi and Mitchell questions have been used in surveys in Australia
(Beal and Delpachitra, 2003), Canada (Canadian Financial Capability Survey; Statistics Canada, 2009), France (La culture financière des Français;; Autorité des Marchés Financiers, 2011), Germany (The German SAVE study; Mannheim Research Institute for the Economics of Aging, 2009), Italy (Indagine sui bilanci delle famiglie italiane; Banca d’Italia, 2010), New Zealand (ANZ Retirement Commission Financial Knowledge Survey; ANZ Bank, 2009), Portugal (Survey on the Financial Literacy of the Portuguese Population; Banco de Portugal, 2010), Russia (The Russia Financial Literacy Diagnostic Survey; World Bank, 2009), Sweden (Survey on Financial Literacy in Sweden; Finansinspektionen, 2010) and the Netherlands (DNB Household Survey; CentERdata, 2006).
improved savings rates (Bernheim et al., 1997), a suite of respon-sible financial behaviours (Hilgert et al., 2003; Grable et al., 2009), stock market participation (Yoong, 2010; van Rooij et al., 2011), wealth accumulation (Lusardi and Mitchell, 2011), retire-ment planning (Lusardi, 2008), and more responsible and less expensive credit use (Lusardi and Tufano, 2009; Gerardi et al., 2010; Robb, 2011).
Previous research has identified a number of socio-demographic characteristics, including gender, age, marital status, income and employment (Kempson, 2009; Yoong, 2010), that influence one’s financial literacy. Danes and Haberman (2007), Lusardi and Tufano (2009), and van Rooij et al. (2011) are among those who examined the influence of gender on finan-cial knowledge and concluded that men generally have greater financial literacy. Lusardi and Tufano (2009), van Rooij et al. (2011) and Gerardi et al. (2010) all demonstrated the influence of age, with financial literacy generally increasing as one ages. Income (Lusardi and Tufano, 2009) and wealth (van Rooij et al., 2011) have been shown to be positively associated with financial literacy. Other demographic variables examined in previous research include marital status, employment (van Rooij et al., 2011) and number of children (Gerardi et al., 2010; van Rooij et al., 2011). The possibility that financial knowledge can be developed by experiences gained through use of financial prod-ucts has led to the inclusion of other variables such as home ownership (Xiao, 1997; Chien and DeVaney, 2001; Choi, 2010) in some models. Agarwal et al. (2013) provided evidence about the positive role of the use of financial products on financial knowledge. The authors found that the fees new card holders pay fall by 75% within the first 3 years after an account is opened, suggesting that consumers learn how to avoid triggering fees. The role of experience also is evident in the responses to a University of Michigan Surveys of Consumers question about the most important way respondents learned about personal finance. One-half cited personal financial experience. This proportion was more than twice as large as those who cited friends and family, and four to five times the proportion who cited formal financial education as their most important source of knowledge about personal finance (Hilgert et al., 2003).
Thus, most previous studies analysed data about financial lit-eracy from a single country or a subset of the population of a country. In addition, the literature suggests the value of assessing financial knowledge lies in examining its relationship with finan-cial behaviours, after controlling for socio-demographic charac-teristics. Therefore, in the current research, data from four countries about financial knowledge as well as financial behav-iours were examined.
Data
The lack of data from cross-national surveys about financial lit-eracy required an analysis of comparable data from different national surveys. The criteria for choosing the countries were (1) survey data available to the researchers; (2) questions about finan-cial literacy that were the same (or similar) in all surveys; and (3) cultural, economic and financial systems across the countries. Application of these criteria resulted in the selection of four devel-oped economies: the US, UK, Canada and Italy. Both the US and Canada are large North American countries with similar
econo-mies but important cultural and political differences. The UK and Italy are both members of the European Union but, as with the US and Canada, are different culturally and politically. The similari-ties and differences combine to create an interesting set of coun-tries for analysis.
Data for the US came from the 2009 FINRA National Financial Capability Study (FINRA, 2010). This is a nationally representa-tive study that consisted of three linked surveys conducted in mid-2009: (1) a national, random-digit-dialled telephone survey of 1488 respondents; (2) a state-by-state online survey of approxi-mately 25 000 respondents; and (3) an online survey of 800 mili-tary personnel and spouses. The national data from the telephone survey were used in this study.
The 2006 FSA Financial Capability Baseline Survey provided the data for the UK. This nationally representative survey was commissioned by the British FSA (the Financial Service Authority) to the Personal Finance Research Centre of Bristol (UK) to measure financial capability (literacy) in the UK. The survey was conducted between June and September 2005 and a total of 5328 people were interviewed. Because a later wave of the survey data was not available, the 2005 data were selected for this study.
The Canadian data were from the 2009 Canadian Financial Capability Survey, conducted by Statistics Canada between Feb-ruary and May 2009. The nationally representative survey was conducted as a random-digit-dialled survey, with the cooperation and support of Human Resources and Skills Development Canada, Finance Canada, and the Financial Consumer Agency of Canada. The sample size was 27 555.
The nationally representative data from Italy were from the 2009 ‘Indagine sui bilanci delle famiglie italiane’ (Italian Survey on Household Income and Wealth). This survey has been repli-cated since the 1960s but has only recently been upgraded to include questions about financial literacy. The sample size was 7951.
Across the four data sets, only four financial literacy questions were the same or similar enough to use for comparison across countries. The questions and answer choices are reported in Table 1. A complete list of the questions used from each national survey is available in the Appendix. Limitations of the use of these existing data must be acknowledged. Only the inflation question was identical across the four data sets and even then the wording varied by country. The remaining three questions represented the best matches across the four countries but the content assessed varied somewhat by country. Thus, differences in results across countries may reflect to some extent the inconsistencies in the questions used to assess financial knowl-edge. Other limitations of the study are discussed later in the article.
The independent variables were selected based on previous work. Gender, age, education, the presence of dependent children, income, employment, marital status and home ownership were the independent variables in the regression analyses. They are described in Table 2.
Due to the interest in linking financial literacy and financial behaviours in previous research, nine variables assessing financial behaviours were selected from the data sets for inclusion in the analyses. Summary statistics for the variables are reported in Table 2 and the variables are described in Table 3.
T able 1 Financial literacy questions US UK Canada Italy Investment If interest rates rise, what will typically happen to bond prices? • They will rise • They will fall • They will stay the same • There is no relationship between bond prices and the interest rate • Don’t know • (Refused) Which of these savings and investments do you think would have their cash value directly affected by stock market performance? • Cash ISA • Insurance/investment bond (e.g. managed bond, with-profits bond) • Savings account with a bank or building society • Equity ISA • Endowment policy (with profits or unit linked) • Unit trust • Personal pension plan (with profits or unit linked) • Don’t know • (Refused) Lindsay has saved $12 000 for her university expenses by working part-time. Her plan is to start university next year and she needs all of the money she saved. Which of the following is the safest place for her university money? • Corporate bonds • Mutual funds • A bank savings account • Locked in a safe at home • Stocks • Don’t know • (Refused) A firm can raise money by issuing stocks or bonds. Which one is more risky for the investors? • Stocks • Bonds • Stocks and bonds have the same risk • I don’t know the difference between stocks and bonds • Don’t know • (Refused) Credit (mortgage) A 15-year mortgage typically requires higher monthly payments than a 30-year mortgage, but the total interest paid over the life of the loan will be less. • T rue • False • Don’t know • (Refused) Can you tell me for which of these types of mortgage you would be guaranteed to pay off the full amount borrowed if you kept up the repayments? • Repayment mortgage • Low-cost endowment mortgage • Interest-only mortgage with an associated investment in a stocks and shares ISA or PEP • Interest-only mortgage with no associated investment • Don’t know • (Refused) Which of the following will help lower the cost of a house? • Paying off the mortgage over a long period of time • Agreeing to pay the current rate of interest on the mortgage for as many years as possible • Making a larger down payment at the time of purchase • Making a smaller down payment at the time of purchase • Don’t know • (Refused) With which of the following mortgages can you know from the beginning the maximum value and the total number of the instalments that you’ll have to pay to repay your debt? • Floating rate mortgage • Fix rate mortgage • Fix rate mortgage with fix instalment • Don’t know • (Refused) Inflation Imagine that the interest rate on your savings account was 1% per year and inflation was 2% per year . After 1 year , how much would you be able to buy with the money in this account? • More than today • Exactly the same • Less than today • Don’t know • (Refused) If the inflation rate is 5% and the interest rate you get on your savings is 3%, will your savings have at least as much buying power in a year’s time? •Y e s •N o • Don’t know • (Refused) If the inflation rate is 5% and the interest rate you get on your savings is 3%, will your savings have at least as much buying power in a year’s time? •Y e s •N o • Don’t know • (Refused) Suppose you have € 1000 in your bank account with an interest rate of 1% and no fees or other expenses. Suppose that the inflation rate is equal to 2%. Do you think that at the end of the year , when you’ll have back your money , you’ll be able to buy the same amount of goods that you can buy today with your € 1000? •Y e s • No, I’ll be able to buy less • No, I’ll be able to buy more • Don’t know Money management (bank account) Suppose you had $100 in a savings account and the interest rate was 2% per year . After 5 years, how much do you think would you have in the account if you left the money to grow? • More than $102 (EUR 76) • Exactly $102 • Less than $102 • Don’t know • (Refused) Looking at this example of a bank statement, please can you tell me how much money was in the account at the end of February? If you had a savings account at a bank, which of the following statements would be correct concerning the interest that you would earn on this account? • Sales tax may be charged on the interest that you earn • Y ou cannot earn interest until you pass your 18th birthday • Earnings from savings account interest may not be taxed • Income tax may be charged on the interest if your income is high enough. • Don’t know • (Refused) Look at this bank statement. Can you tell me how much money you have in your account at the end of the period?
Table 2 Descriptive statistics
Variables (Quiz)
US UK Canada Italy
Correct answer (%) Correct answer (%) Correct answer (%) Correct answer (%)
Question 1 – Investment 22.24 35.21 59.79 33.48
Question 2 – Credit (mortgage) 71.10 70.92 81.68 66.41
Question 3 – Inflation 65.86 44.76 61.71 72.55
Question 4 – Money management (bank account)
65.76 91.00 57.16 60.38
Financial literacy index mean (SD) 2.251 (1.137) 2.419 (0.982) 2.603 (1.275) 2.328 (1.192)
Variables Values
US UK Canada Italy
Obs. % Obs. % Obs. % Obs. %
Gender 1 = Male 768 51.61 2678 50.26 6 925 44.62 4934 61.85 2 = Female 720 48.39 2650 49.74 8 594 55.38 3043 38.15 Total 1488 100 5328 100 15 519 100 7977 100 Age 1 = 18–24 205 13.78 699 13.13 1 199 7.73 61 0.76 2 = 25–34 250 16.80 996 18.71 2 212 14.25 480 6.02 3 = 35–44 284 19.09 1012 19.02 2 902 18.70 1272 15.95 4 = 45–54 273 18.35 833 15.65 3 137 20.21 1556 19.51 5 = 55–64 220 14.78 795 14.94 2 822 18.18 1611 20.20 6 = 65 + 256 17.20 987 18.55 3 247 20.92 2997 37.57 Total 1488 100 5322 100 15 519 100 7977 100
Education 1 = Less than high school 152 10.22 2969 55.72 2 768 17.84 319 66.68
2 = High school 411 27.62 1353 25.39 3 284 21.16 2603 32.63
3 = Some college/university 431 28.97 1 0.02 1 670 10.76 1 0.01
4 = College/university 307 20.63 620 11.64 6 348 40.90 53 0.66
5 = PhD/postgraduate 187 12.57 385 7.23 1 449 9.34 1 0.01
Total 1488 100 5328 100 15 519 100 7977 100
Income 1 = Less than $25 000 457 30.71 209 3.92 2 816 18,15 1992 24.97
2 = At least $25 000 but less than $50 000 359 24.13 2668 50.08 3 661 23,59 3408 42.72
3 = At least $50 000 but less than $75 000 275 18.48 1474 27.67 3 162 20,38 1519 19.04
4 = At least $75 000 but less than $100 000 147 9.88 605 11.36 1 949 12,56 538 6.74
5 = At least $100 000 but less than $150 000 148 9.95 208 3.90 1 592 10,26 257 3.22
6 = $150 000 or more 102 6.85 108 2.03 748 4,82 263 3.30 Total 1488 100 5328 100 15 519 100 7977 100 Employment 0 = Disabled 94 6.32 241 4.52 1 0.01 1 0.01 1 = Unemployed/not working 113 7.59 392 7.36 1 601 10.32 1710 21.44 2 = Student 51 3.43 270 5.07 597 3.85 12 0.15 3 = Household work 93 6.25 507 9.52 402 2.59 1 0.01 4 = Employed 728 48.92 2761 51.82 7 541 48.59 2629 32.96 5 = Self-employed 145 9.74 1 0.02 1 395 8.99 771 9.67 6 = Retired 263 17.67 1155 21.68 3 938 25.38 2852 35.75 7 = Other 1 0.07 1 0.02 44 0.28 1 0.01 Total 1488 100 5328 100 15 519 100 7977 100
Marital status 1 = Single 823 55.31 2656 49.85 9 080 58.51 5045 63.24
2 = Married 382 25.67 1621 30.42 3 191 20.56 903 11.32
3 = Separated 145 9.74 491 9.22 1 291 8.32 586 7.35
4 = Divorced 114 7.66 435 8.16 1 369 8.82 1442 18.08
5 = Widow 24 1.61 125 2.35 588 3.79 1 0.01
Total 1488 100 5328 100 15 519 100 7977 100
Home ownership (Value equal to 1) 917 61.63 3097 58.13 11 044 71.16 5641 70.72
Financial behaviour variables
Advice (Value equal to 1) 843 56.65 1482 27.82 3 254 20.97 16 0.20
Bank account (Value equal to 1) 1333 89.58 4834 90.73 13 395 86.31 6613 82.90
InfoIntermediaries (Value equal to 1) 495 33.27 50 0.94 7 930 51.10 118 1.48
InfoNewspapers (Value equal to 1) 934 62.77 11 0.21 2 908 18.74 6 0.08
InfoFriends (Value equal to 1) NA NA 25 0.47 6 178 39.81 8 0.10
Compare shop (Value equal to 1) 139 9.34 352 6.61 10 931 70.44 365 4.58
Investment (Value equal to 1) 637 42.81 563 10.57 6 193 39.91 975 12.22
Mortgage (Value equal to 1) 571 38.37 1694 31.79 6 389 41.17 736 9.23
Loans (Value equal to 1) 430 28.90 NA NA 4 348 28.02 1005 12.60
Variable Mean SD Mean SD Mean SD Mean SD
Children 0.047 0.336 0.103 0.489 0.152 0.359 0.198 0.593
Methodology
As the aim of this paper was to analyse financial literacy in different countries, the following research questions were pro-posed: (1) Are there differences in financial literacy across coun-tries? (2) If financial literacy differs between countries, do differences in socio-demographic characteristics or levels of par-ticipation in financial markets or differences in financial behaviour explain these differences?
A quantitative measure of financial literacy was created based on responses to the four financial literacy questions that appeared in all four data sets. The four questions included one each on the topics of investment, credit, inflation and money management. Creation of an index to measure financial literacy, equal to the number of correct answers to the four questions, was consistent with previous literature (see Volpe et al., 1996; Moore, 2003; NASD, 2003; Worthington, 2004; Atkinson et al., 2006; Borden et al., 2008; Servon and Kaestner, 2008; Hung et al., 2009). The value of the index could range from 0, if the respondent answered all four questions incorrectly, to 4, if all of the answers were right. The descriptive statistics in Table 2 show the distribution of the sample. To further examine the factors that may be predictors of financial literacy after controlling for other related variables, regression analyses were conducted. To address the first research question regarding differences in financial literacy between coun-tries, an ordered logistic regression was used to analyse a data set that included the data from all four countries. An ordered logistic regression model was selected because of the limited nature of the dependent variable (Greene, 2011). Greene suggested the use of ordered logit for dependent variables that are not continuous, such as the financial literacy index, rather than ordinary least squares (OLS) regression because one of the key assumptions for using OLS is that the dependent variable is continuous. The financial literacy index was the dependent variable and the full sets of socio-demographic and financial behaviour variables were included as independent variables. Four dummy variables also were included to account for differences by country.
To address possible bias due to differences in sample sizes, the same regression was replicated applying weights to the national data. First, the weights were applied to resize all of the individual
country data to the largest sample size (Canada). Second, weights were applied to resize all of the individual country data to the smallest sample (US). Results from the three different regressions shed light on the possible bias on results due to differences in sample sizes.
Data about five financial behaviour variables (InfoFriends in the US, Loans in the UK, and Advice, InfoIntermediaries and InfoFriends in Italy) were unavailable in at least one of the data sets. In the by-country regression analyses, these variables were eliminated from the model for the countries for which the data were missing.
The second research question regarding differences in the factors that influence financial literacy between countries also was investigated using an ordered logistic regression analysis. The data from each country were analysed separately, adopting the financial literacy index as dependent variable. In Model 1, the independent variables were the full set of socio-demographic variables. In Model 2, the socio-demographic variables as well as the financial behaviour variables were included in the analysis.
Results
Descriptive statistics
Descriptive statistics for the dependent and independent variables are reported in Table 2. Demographically, the Italian sample was considerably older than the US sample and less well educated than any of the other three samples. The Canadian sample reported the highest levels of education. Relative to the other countries, the UK sample was much less likely to be self-employed. The Italian sample included proportionately more divorced individuals than any of the other three samples.
The mean of the financial literacy index across the four coun-tries was 2.48; the means for the individual councoun-tries ranged from a low of 2.25 in the US to a high of 2.60 in Canada. Question 1 (investment) was the most difficult question in each country except Canada where a roughly equal proportion also incorrectly answered Question 4 (money management). In contrast, Question 4 was the question most often answered correctly in the UK. In the US and Canada, Question 2 (credit) was most often answered Table 3 Description of consumer attitude and behaviour variables
Variable Description
Advice Dummy variable equal to 1 if the consumer uses a financial adviser (and 0 otherwise)
Bank account Dummy variable equal to 1 if the consumer owns in his/her name at least 1 bank account (and 0 otherwise)
InfoIntermediaries Dummy variable equal to 1 if the consumer uses intermediaries (banks, etc.) as a source of information (and 0
otherwise)
InfoNewspapers Dummy variable equal to 1 if the consumer uses regularly financial newspapers or reads the financial section of
newspapers in order to be updated on financial topics (and 0 otherwise)
InfoFriends Dummy variable equal to 1 if the consumer talks with friends and relatives about financial topics on a regular base (and
0 otherwise)
Compare shop Dummy variable equal to 1 if the consumer compares different providers when he wants to buy financial products or
services (and 0 otherwise)
Investment Dummy variable equal to 1 if the consumer owns investment products such as bonds, stocks and mutual funds (and 0
otherwise)
Mortgage Dummy variable equal to 1 if the consumer has a mortgage (and 0 otherwise)
correctly while Question 3 (inflation) was most often answered correctly in Italy.
There also was a considerable range in financial behaviours across countries. Italian consumers were less likely to have a mortgage or a loan than those in the other three countries. More than one-half of US consumers used a financial advisor (Advice) while this was rare in Italy. One-third of US consumers and one-half of those in Canada used intermediaries as a source of infor-mation, something the Britons and Italians rarely did. Reading financial newspapers or the financial sections of newspapers was common in the US but rare in the UK and Italy. Canadians were more likely than those in other countries to talk with friends and relatives about financial topics on a regular basis and to compare providers before buying financial products or services. Relative to the two other countries, a higher proportion of the US and Cana-dian samples owned investment products.
Across-country differences in financial literacy
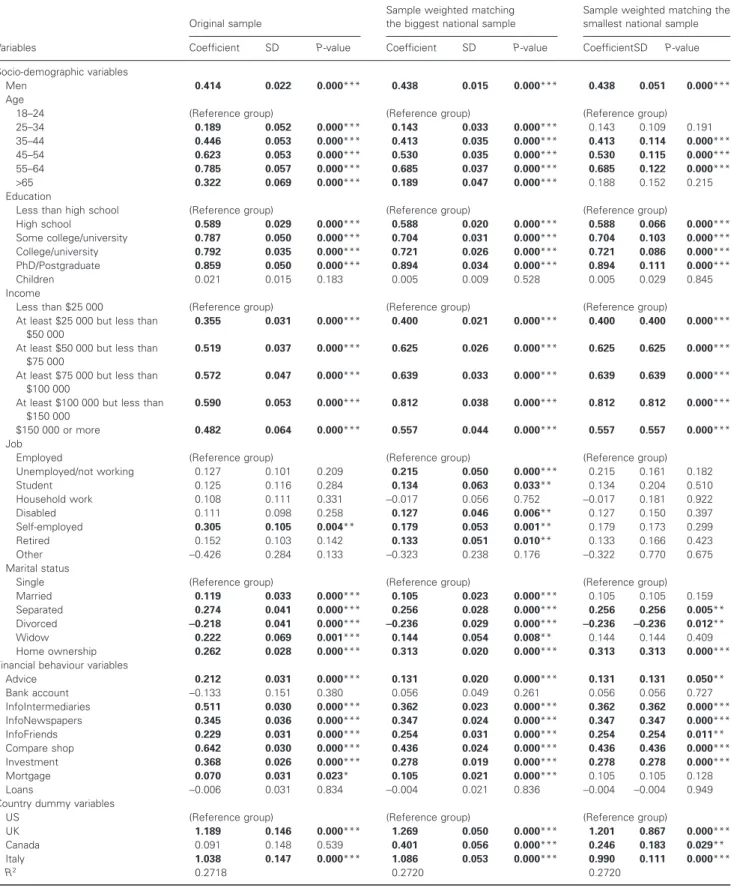
Results from the ordered logistic regression analysis using the full international data set are reported in Table 4. Results of regres-sions from the original data and from the weighted data are reported side by side to stress the differences in results due to different sample sizes: stronger similarities within results suggest their robustness against the sample size effect. The results from the original sample indicate that men, those older than 24 years old, those with at least a high school education and those with annual incomes greater than $25 000 (EUR 18 746; £16 139), were more financially literate than the reference groups. Self-employment, being married, separated, or widowed, and homeownership were positively associated with financial literacy. The nature of the relationships was as suggested by previous research (Lusardi and Tufano, 2009; van Rooij et al., 2011). The coefficients for age and income increased continuously until reaching the oldest and highest income and age groups. Those who were divorced were less literate than the reference group of single respondents.
All of the financial behaviour variables except bank account and loans were positive and statistically significantly related to finan-cial literacy at the P< 0.001 level (see Table 4).
The significance for the country dummy variables supports the hypothesis that country of origin matters when explaining finan-cial literacy. Using the US as the reference country, the signs and values of the coefficients for the other dummy variables suggest the influence of country of origin was stronger among the Britons (1.189, P-value<0.001) and also significant among the Italians (1.038, P-value<0.001), but not the Canadians.
A potential concern is the differences in the sample sizes (from 1488 in the US to 15 519 in Canada). To test for sample size effects, ordered logistic regressions for both models were rerun, once with the sample sizes for the other three countries standard-ized to equal the Canadian sample size and once with the sample sizes standardized to equal the US sample size. Results indicated some differences between the weighted and unweighted models, but primarily for the job status variable. While only self-employment (relative to self-employment) was significant in the unweighted data, multiple categories of job status were significant when the data were weighted to equal the Canadian sample size and none was significant when the data were weighted to equal the US sample size. Thus, the results regarding job status appear to
be influenced by the differences in the sample sizes. However, among the financial behaviour variables, only the mortgage vari-able appears influenced by the differences in the sample sizes. In addition, the dummy variable for Canada was not significant in the unweighted data but was in both of the weighted data analyses.
Because of concerns about the sample size effect on the job status variable, that variable was removed from the by-country regression analysis, which used unweighted data. Across the four Model 1 by-country regression analyses (Table 5), the only con-sistency was the influence of education on financial literacy. The coefficients for men were positive and significant in each country with the exception of UK (Model 1) where being male was nega-tively associated with financial literacy. Education was significant and positive across the countries but the relationships were strong-est in Canada. Those who owned their houses had significantly higher financial literacy than those in other living conditions in the three countries (US, UK and Canada).
There were, however, also inconsistencies in the results across countries. Relative to the reference group (18- to 24-year-olds), only the 55- to 64-year-olds in the US were more financially literate while all Canadian age groups with the exception of the 35- to 44-year-olds were more financially literate. Income was significant and positive in Italy (except for the highest income group), Canada (for all groups) and the US (but not significant for the greater than $100 000 income groups). Marital status was significant in Canada and Italy but the specific nature of the rela-tionship was different between the two countries.
Financial behaviour variables were added to the regression analyses in Model 2 (see Table 5, Model 2 columns). Using this larger set of variables, the R2 increased in each analysis and the majority of the socio-demographic variables retained their significance.
In Model 2, gender was the only consistent socio-demographic influence across countries. Men had higher scores in each country. The influence of education in all countries, age in the US and Canada, marital status in Canada and Italy, and income in Italy was consistent between Models 1 and 2. The introduction of finan-cial behaviour variables seems to have reduced the influence of higher education on financial literacy in the US and occupation and home ownership in Canada.
Conclusions
This research used variables from four data sets to assess financial literacy and its influences in four countries as well as across the four countries. The results suggest varying levels of financial knowledge across the four countries. In addition, there were incon-sistencies in the influence of socio-demographic variables. Adding financial behaviour variables to the ordered logistic regression model increased the explanatory power of the model in each country but the socio-demographic variables generally retained their explanatory power.
The results clearly indicate the need to coordinate if not stand-ardize financial literacy assessments across countries. Asking identical financial literacy questions (with appropriate adjustments for country-specific information, such as currencies) would facili-tate comparison. While the Lusardi and Mitchell questions are a start, they cover a relatively narrow range of content. Little is
Table 4 Results of ordered logistic regression analysis using full international data set
Variables
Original sample
Sample weighted matching the biggest national sample
Sample weighted matching the smallest national sample
Coefficient SD P-value Coefficient SD P-value CoefficientSD P-value
Socio-demographic variables
Men 0.414 0.022 0.000*** 0.438 0.015 0.000*** 0.438 0.051 0.000***
Age
18–24 (Reference group) (Reference group) (Reference group)
25–34 0.189 0.052 0.000*** 0.143 0.033 0.000*** 0.143 0.109 0.191 35–44 0.446 0.053 0.000*** 0.413 0.035 0.000*** 0.413 0.114 0.000*** 45–54 0.623 0.053 0.000*** 0.530 0.035 0.000*** 0.530 0.115 0.000*** 55–64 0.785 0.057 0.000*** 0.685 0.037 0.000*** 0.685 0.122 0.000*** >65 0.322 0.069 0.000*** 0.189 0.047 0.000*** 0.188 0.152 0.215 Education
Less than high school (Reference group) (Reference group) (Reference group)
High school 0.589 0.029 0.000*** 0.588 0.020 0.000*** 0.588 0.066 0.000*** Some college/university 0.787 0.050 0.000*** 0.704 0.031 0.000*** 0.704 0.103 0.000*** College/university 0.792 0.035 0.000*** 0.721 0.026 0.000*** 0.721 0.086 0.000*** PhD/Postgraduate 0.859 0.050 0.000*** 0.894 0.034 0.000*** 0.894 0.111 0.000*** Children 0.021 0.015 0.183 0.005 0.009 0.528 0.005 0.029 0.845 Income
Less than $25 000 (Reference group) (Reference group) (Reference group)
At least $25 000 but less than $50 000
0.355 0.031 0.000*** 0.400 0.021 0.000*** 0.400 0.400 0.000***
At least $50 000 but less than $75 000
0.519 0.037 0.000*** 0.625 0.026 0.000*** 0.625 0.625 0.000***
At least $75 000 but less than $100 000
0.572 0.047 0.000*** 0.639 0.033 0.000*** 0.639 0.639 0.000***
At least $100 000 but less than $150 000
0.590 0.053 0.000*** 0.812 0.038 0.000*** 0.812 0.812 0.000***
$150 000 or more 0.482 0.064 0.000*** 0.557 0.044 0.000*** 0.557 0.557 0.000***
Job
Employed (Reference group) (Reference group) (Reference group)
Unemployed/not working 0.127 0.101 0.209 0.215 0.050 0.000*** 0.215 0.161 0.182 Student 0.125 0.116 0.284 0.134 0.063 0.033** 0.134 0.204 0.510 Household work 0.108 0.111 0.331 −0.017 0.056 0.752 −0.017 0.181 0.922 Disabled 0.111 0.098 0.258 0.127 0.046 0.006** 0.127 0.150 0.397 Self-employed 0.305 0.105 0.004** 0.179 0.053 0.001** 0.179 0.173 0.299 Retired 0.152 0.103 0.142 0.133 0.051 0.010** 0.133 0.166 0.423 Other −0.426 0.284 0.133 −0.323 0.238 0.176 −0.322 0.770 0.675 Marital status
Single (Reference group) (Reference group) (Reference group)
Married 0.119 0.033 0.000*** 0.105 0.023 0.000*** 0.105 0.105 0.159
Separated 0.274 0.041 0.000*** 0.256 0.028 0.000*** 0.256 0.256 0.005**
Divorced −0.218 0.041 0.000*** −0.236 0.029 0.000*** −0.236 −0.236 0.012**
Widow 0.222 0.069 0.001*** 0.144 0.054 0.008** 0.144 0.144 0.409
Home ownership 0.262 0.028 0.000*** 0.313 0.020 0.000*** 0.313 0.313 0.000***
Financial behaviour variables
Advice 0.212 0.031 0.000*** 0.131 0.020 0.000*** 0.131 0.131 0.050** Bank account −0.133 0.151 0.380 0.056 0.049 0.261 0.056 0.056 0.727 InfoIntermediaries 0.511 0.030 0.000*** 0.362 0.023 0.000*** 0.362 0.362 0.000*** InfoNewspapers 0.345 0.036 0.000*** 0.347 0.024 0.000*** 0.347 0.347 0.000*** InfoFriends 0.229 0.031 0.000*** 0.254 0.031 0.000*** 0.254 0.254 0.011** Compare shop 0.642 0.030 0.000*** 0.436 0.024 0.000*** 0.436 0.436 0.000*** Investment 0.368 0.026 0.000*** 0.278 0.019 0.000*** 0.278 0.278 0.000*** Mortgage 0.070 0.031 0.023* 0.105 0.021 0.000*** 0.105 0.105 0.128 Loans −0.006 0.031 0.834 −0.004 0.021 0.836 −0.004 −0.004 0.949
Country dummy variables
US (Reference group) (Reference group) (Reference group)
UK 1.189 0.146 0.000*** 1.269 0.050 0.000*** 1.201 0.867 0.000***
Canada 0.091 0.148 0.539 0.401 0.056 0.000*** 0.246 0.183 0.029**
Italy 1.038 0.147 0.000*** 1.086 0.053 0.000*** 0.990 0.111 0.000***
R2 0.2718 0.2720 0.2720
*P< 0.10; **P < 0.05; ***P < 0.001.
T able 5 Results from ordered logistic regression on financial literacy index (national database, n = 3 0 312) V ariables US UK Canada Italy Model 1 Model 2 Model 1 Model 2 Model 1 Model 2 Model 1 Model 2 Coefficient SD Coefficient SD Coefficient SD Coefficient SD Coefficient SD Coefficient SD Coefficient SD Coefficient SD Men 0.552 ** 0.217 0.532 ** 0.220 − 0.020 0.183 − 0.022 0.184 0.208 *** 0.059 0.273 *** 0.066 0.432 *** 0.087 0.465 *** 0.094 Age 18–24 (Reference group) (Reference group) (Reference group) (Reference group) (Reference group) (Reference group) (Reference group) (Reference group) 25–34 0.289 0.356 0.180 0.361 0.144 0.347 0.089 0.348 0.330 ** 0.131 0.243 0.149 0.297 0.525 0.291 0.583 35–44 0.251 0.386 0.161 0.393 0.333 0.393 0.282 0.394 0.194 0.130 0.268 ** 0.148 0.384 0.513 0.430 0.573 45–54 0.531 0.394 0.441 0.402 0.007 0.395 − 0.060 0.398 0.463 *** 0.129 0.524 *** 0.147 0.288 0.511 0.325 0.571 55–64 0.978 ** 0.488 0.855 * 0.497 − 0.160 0.415 − 0.173 0.416 0.565 *** 0.140 0.665 *** 0.159 0.385 0.511 0.554 0.572 > 65 0.252 0.546 0.113 0.562 − 0.685 0.466 − 0.652 0.469 0.093 0.161 0.277 0.184 − 0.133 0.569 0.216 0.642 Education Less than high school (Reference group) (Reference group) (Reference group) (Reference group) (Reference group) (Reference group) (Reference gro up) (Reference group) High school 0.311 0.285 0.273 0.290 1.095 *** 0.304 1.042 ** 0.306 0.398 *** 0.077 0.151 * 0.087 1.140 *** 0.132 1.015 *** 0.136 Some college/university 0.838 ** 0.324 0.700 ** 0.332 (Dropped) (Dropped) 0.827 *** 0.110 0.511 *** 0.124 (Dropped) (Dropped) College/university 0.785 ** 0.395 0.543 0.406 1.097 ** 0.468 1.018 ** 0.469 0.807 *** 0.079 0.422 *** 0.088 0.468 0.745 0.260 0.748 PhD/postgraduate 0.937 * 0.505 0.744 0.519 0.576 0.524 0.468 0.528 0.913 *** 0.130 0.455 ** 0.145 (Dropped) (Dropped) Children 0.137 0.108 0.161 0.111 0.068 0.121 0.065 0.120 0.188 ** 0.083 0.101 0.092 − 0.050 0.053 − 0.067 0.057 Income < $25 000 (Reference group) (Reference group) (Reference group) (Reference group) (Reference group) (Reference group) (Reference group) (Referenc e group) $25 000–$50 000 0.476 * 0.273 0.298 0.282 0.910 ** 0.295 0.831 ** 0.296 0.206 ** 0.079 0.053 0.089 1.043 *** 0.084 0.980 *** 0.090 $50 000–$75 000 0.660 * 0.392 0.389 0.407 0.907 * 0.496 0.736 0.502 0.274 ** 0.095 − 0.019 0.107 1.880 *** 0.170 1.802 *** 0.181 $75 000–$100 000 1.324 ** 0.640 0.985 0.653 (Dropped) (Dropped) 0.402 ** 0.120 0.082 0.136 2.247 *** 0.333 2.189 *** 0.352 $100 000–$150 000 0.458 0.511 0.076 0.525 (Dropped) (Dropped) 0.217 * 0.125 − 251 * 0.144 2.676 *** 0.591 2.456 *** 0.594 > $150 000 0.150 0.579 − 0.228 0.594 (Dropped) (Dropped) 0.461 * 0.185 − 0.056 0.206 0.138 0.172 0.006 0.180 Marital status Single (Reference group) (Reference group) (Reference group) (Reference group) (Reference group) (Reference group) (Reference group) (Referenc e group) Married − 0.223 0.304 − 0.170 0.309 0.065 0.272 0.092 0.273 0.172 ** 0.086 0.251 ** 0.098 0.216 0.141 0.224 0.152 Separated 0.318 0.416 0.403 0.425 0.210 0.328 0.216 0.329 0.348 ** 0.115 0.372 ** 0.126 0.360 ** 0.166 0.378 ** 0.178 Divorced 0.362 0.423 0.429 0.431 − 0.374 0.258 − 0.335 0.258 − 0.097 0.098 − 0.090 0.111 − 0.144 0.106 − 0.077 0.114 Widow − 0.525 0.684 − 0.438 0.694 0.047 0.540 0.072 0.540 0.251 0.153 0.344 ** 0.169 (Dropped) (Dropped) Home ownership 0.678 ** 0.248 0.598 * 0.309 0.731 *** 0.201 0.498 ** 0.222 0.580 *** 0.061 0.004 0.075 0.037 0.083 0.027 0.089 Advice 0.373 0.275 0.256 0.264 0.408 ** 0.123 (Dropped) Bank account 0.147 0.276 (Dropped) (Dropped) (Dropped) InfoIntermediaries − 0.300 0.330 − 0.548 0.055 1.260 *** 0.082 (Dropped) InfoNewspapers 0.433 ** 0.207 (Dropped) 0.511 *** 0.109 (Dropped) InfoFriends (Dropped) (Dropped) 1.053 *** 0.080 (Dropped) Compare shop − 0.097 0.520 0.648 0.052 1.812 *** 0.063 − 0.487 0.298 Investment 0.749 0.295 0.628 0.433 0.760 *** 0.083 0.097 0.120 Mortgage − 0.120 0.357 0.474 0.368 0.446 *** 0.098 1.031 *** 0.268 Loans 0.384 0.288 (Dropped) − 414 *** 0.077 0.990 *** 0.223 R 2 0.1161 0.1368 0.0913 0.0960 0.0610 0.2809 0.1805 0.1846 * P < 0.10; ** P < 0.05; *** P < 0.001. Significant variables are in bold.
known about how well responses to these questions correlate with knowledge about other aspects of financial management. In addi-tion, all of the questions include numbers; it is unknown whether they assess financial literacy or numeracy or both. Methodologi-cally, it could be important to administer the survey in a similar fashion and to similar numbers and types of respondents across cultures.
Furthermore, including financial behaviour questions appears critical given their explanatory power. While we cannot directly change one’s socio-demographic characteristics, we can ensure their access to financial behaviours that increase their financial knowledge. The effect on financial literacy of access to financial products and services has been highlighted in previous literature (see e.g. Atkinson et al., 2006). Results from previous studies suggest that lack of access to financial products does play an important role in financial literacy. For instance, Agarwal et al. (2013) found that financial knowledge of consumers about credit cards is affected by using these cards. Hilgert et al. (2003) highlighted survey results reporting that personal financial expe-rience was the primary way respondents learned about personal finance.
As noted earlier, an important limitation is the use of existing data. The fact that the knowledge score on the inflation question in the UK sample was the lowest of the four while the overall UK knowledge score was the highest across the four countries sug-gests, at a minimum, some inconsistencies in the measure of financial knowledge that merit further examination. In addition, the latest available data for the UK were from 2006 while the data from the other three countries were from 2009. The UK results may be different in unknown ways due to differences in economic conditions between 2006 and 2009.
Thus, there is a need to develop a broader scale to measure financial literacy in a more comprehensive and reliable way in future international studies. To better understand the factors that affect financial literacy and the negative consequences of financial illiteracy on the economy and society, a standardized measure that could be used anywhere seems necessary. Financial literacy can impact both financial market development and con-sumers’ use of that market. For example, a study by Khorana et al. (2005) showed an association between financial innovation in the mutual fund industry and the mean number of years of education in a country. A related stream of research (see e.g. Grimes et al., 2010) has connected consumers’ use of financial services to economic and financial education. In a globalized economy, financial institutions are more likely to participate in places where the population is better informed and a financially literate population is more likely to participate in the financial products and services that the institutions have to offer. As a result, the development of a uniform financial literacy measure is of interest to both public and private decision makers. In addition, previous research has demonstrated the influence of cognitive abilities as well as numeracy on consumers’ financial choices (see e.g. Beal and Delpachitra, 2003 and Christelis et al., 2010), sug-gesting the value of an even more comprehensive data set. While designing and collecting such data across countries may prove challenging due to differences in countries’ economic and finan-cial systems, it is important as part of a larger effort to coordinate if not standardize data collection regarding financial literacy and related variables across countries.
Acknowledgements
The authors want to thank the following data providers for data and support: the Financial Services Authority, the British Market Research Bureau, the UK Data Archive and the Crown copyright for providing data from the Financial Capability Baseline Survey, 2005; the Statistics Canada for providing data from the 2008 Canadian Financial Capability Survey (This analysis is based on Statistics Canada Micro data file Canadian Financial Capability Survey which contains anonymized data collected in the 2008 Canadian Financial Capability Survey. All computations on these micro data were prepared by Gianni Nicolini and the responsibil-ity for the use and interpretation of these data is entirely that of the author.); the FINRA Investor Education Foundation for providing data from the US National Financial Capability Survey 2009; the Banca d’Italia (Bank of Italy) for providing data from the ‘Indagine sui bilanci delle famiglie italiane 2010’ (Survey on Household Income and Wealth). The authors would like to acknowledge Roberto Rocci for his comments and suggestions.
References
Agarwal, S., Driscoll, J., Gabaix, X. & Laibson, D. (2013) Learning in the credit card market. SSRN Working Paper. [WWW document].
URL http://papers.ssrn.com/sol3/papers.cfm?abstract_id=1091623
(accessed on 15 May 2013).
ANZ (2008) ANZ survey of adult financial literacy in Australia. [WWW document]. URL www.anz.com/Documents/AU/Aboutanz/AN_5654 _Adult_Fin_Lit_Report_08_Web_Report_full.pdf (accessed on 4 June 2012).
ANZ Bank (2009) ANZ/Retirement Commission financial knowledge survey. New Zealand. [WWW document]. URL http://www .financialliteracy.org.nz/research-/results-anz-retirement-commission -financial-knowledge-survey/2009 (accessed on 4 June 2012). Atkinson, A., McKay, S., Kempson, E. & Collard, S. (2006) Levels of
financial capability in the UK: results of a baseline survey. Financial Services Authority Consumer Research Paper 47. [WWW document]. URL http://www.fsa.gov.uk/pubs/consumer-research/crpr47.pdf (accessed on 4 June 2012).
Autorité des Marchés Financiers (2011) La culture financière des Français. Paris. [WWW document]. URL http://www.amf-france.org/ documents/general/10196_1.pdf (accessed on 4 June 2012). Banca d’Italia (2010) Indagini sui bilanci delle famiglie. Rome. Banco de Portugal – Eurosistema (2010) Survey on the financial
literacy of the Portuguese population. Lisbon. [WWW document]. URL http://clientebancario.bportugal.pt/ptPT/Publicacoes/ InqueritoLiteraciaFinanceira/Documents/Survey%20on%20the%20 Financial%20Literacy%20of%20the%20Portuguese%20Population %20(2010)%20-%20Presentation%20of%20key%20findings.pdf (accessed on 4 June 2012).
Beal, D. & Delpachitra, S.B. (2003) Financial literacy among Australian university students. Economic Papers, 22, 65–78.
Bernheim, B.D., Garrett, D.M. & Maki, D.M. (1997) Education and saving: the long-term effects of high school financial curriculum mandates. NBER Working Paper 6085. [WWW document]. URL http://www.nber.org/papers/w6085 (accessed on 4 June 2012).
Borden, L., Lee, S., Serido, J. & Collins, D. (2008) Changing college students’ financial knowledge, attitudes, and behavior through seminar participation. Journal of Family and Economic Issues, 29, 23–40. Bowen, C. (2003) Financial knowledge of teens and their parents.
CentERdata – Tilburg University (2006) DNB Household Survey (DHS). Tilburg. [WWW document]. URL http://www.centerdata.nl/en/ TopMenu/Projecten/DNB_household_study/ (accessed on 4 June 2012).
Chen, H. & Volpe, R.P. (1998) An analysis of personal financial literacy among college students. Financial Services Review, 7, 107–128.
Chen, H. & Volpe, R.P. (2002) Gender differences in personal financial literacy among college students. Financial Services Review, 11, 289–307.
Chien, Y. & Devaney, S. (2001) The effects of credit attitude and socio-economic factors on credit card and installment debt. Journal of
Con-sumer Affairs, 35, 162–179.
Choi, L. (2010) Bank accounts and youth financial knowledge: connect-ing experience and education. Consumer Interests Annual, 56, 75–90.
Christelis, D., Jappelli, T. & Padula, M. (2010) Cognitive abilities and portfolio choice. European Economic Review, 54, 18–38.
Courchane, M. & Zorn, P. (2005) Consumer literacy and credit worthiness. Presented at Federal Reserve System Conference, Promises and Pitfalls: as consumer options multiply, who is being served and at what cost? April 7, 2005, Washington, DC.
Cude, B.J., Lawrence, F.C., Lyons, A.C., Metzger, K., LeJeune, E., Marks, L. & Machtmes, K. (2006) College students and financial lit-eracy: what they know and what we need to learn. Eastern Family
Economics and Resource Management Association Conference Proceedings, 102–109, February 23–25, 2006, Knoxville,
TN.
Danes, S. & Haberman, H. (2007) Teen financial knowledge, self-efficacy, and behavior: a gender view. Journal of Financial
Counseling and Planning, 18, 48–60.
Financial Fitness for Life (2008) About the program. National Council on Economic Education. [WWW document]. URL http://fffl.ncee.net (accessed on 4 June 2012).
Financial Services Authority (FSA) (2006) Financial capability baseline survey: questionnaire. Financial Service Authority, Consumer Research 47b. [WWW document]. URL http://www.dartmouth.edu/ ~alusardi/Papers/FCW/Fincap_baseline_questionnaire_06.pdf (accessed on 4 June 2012).
Finansinspektionen (2010) Survey on financial literacy in Sweden. Stockholm. [WWW document]. URL http://www.fi.se/upload/ 90_English/20_Publications/10_Reports/2009/report_2009_11_eng.pdf (accessed on 4 June 2012).
FINRA (2010) Financial capability in the United States. US summary. [WWW document]. URL http://www.finrafoundation.org/
surveyexecsum.pdf (accessed on 1 December 2011).
Gerardi, K., Goette, L. & Meier, S. (2010) Financial literacy and sub-prime mortgage delinquency: evidence from a survey matched to administrative data. Working Paper 2010-10. Federal Reserve Bank of Atlanta, Atlanta, GA.
Grable, J.E., Park, J.Y. & Joo, S.H. (2009) Explaining financial manage-ment behavior for Koreans living in the United States. Journal of
Consumer Affairs, 43, 80–107.
Graham, P. (1980) Whither the equality of educational opportunity?
Daedalus, 109, 115–132.
Greene, W.H. (2011) Econometric Analysis. Prentice Hall, Upper Saddle River, NJ.
Grimes, P.W., Rogers, K.E. & Smith, R.C. (2010) High school economic education and access to financial services. Journal of Consumer
Affairs, 44, 317–335.
Hilgert, M., Hogarth, J.M. & Beverly, S. (2003) Household financial management: the connection between knowledge and behaviour.
Federal Reserve Bulletin, 89, 309–322.
Hill, R. & Perdue, G. (2008) A methodological issue in the measure-ment of financial literacy. Journal of Economics and Economic
Education Research, 9, 150–162.
Hung, A.A., Parker, A.M. & Yoong, J.K. (2009) Defining and measur-ing financial literacy. RAND Labor and Population Workmeasur-ing Paper WR-708. Rand Corporation, Santa Monica, CA.
Huston, S.J. (2010) Measuring financial literacy. Journal of Consumer
Affairs, 44, 296–316.
Johnson, E. & Sherraden, M.S. (2006) From financial literacy to finan-cial capability among youth. Center for Sofinan-cial Development Working Paper 06-11. Washington University, St. Louis, MO.
Jones, J. (2005) College students’ knowledge and use of credit. Journal
of Financial Counseling and Planning, 16, 9–16.
Jump$tart Coalition for Personal Financial Literacy (2007) National standards in K-12 personal finance education. [WWW document]. URL http://www.jumpstart.org/assets/files/standard_book-ALL.pdf (accessed on 4 June 2012).
Jump$tart Coalition for Personal Financial Literacy (2008) Mission of Jump$tart financial smarts for students. [WWW document]. URL http://www.jumpstartcoalition.org (accessed on 1 December 2011).
Kempson, E. (2009) Framework for the development of financial lit-eracy baseline surveys. OECD Working Papers on Finance, Insurance and Private Pensions, No. 1. OECD Publishing. doi: 10.1787/ 5kmddpz7m9zq-en.
Khorana, A., Servaes, H. & Tufano, P. (2005) Explaining the size of the mutual fund industry around the world. Journal of Financial
Econom-ics, 78, 145–185.
Kim, J. (2001) Financial knowledge and subjective and objective finan-cial well-being. Consumer Interests Annual, 47, 1–3. [WWW docu-ment]. URL http://www.consumerinterests.org/files/public/Kim –Financialknowledge.pdf (accessed on 1 December 2011). Lusardi, A. (2008) Household saving behavior: the role of financial
lit-eracy, information, and financial education programs. National Bureau of Economic Research Working Paper 13824. [WWW document]. URL http://www.nber.org/papers/w13824 (accessed on 24 October 2011).
Lusardi, A. & Mitchell, O.S. (2007) Financial literacy and retirement preparedness. Business Economics, 42, 35–44.
Lusardi, A. & Mitchell, O.S. (2008a) Planning and financial literacy: how do women fare? . American Economic Review – Paper and
Proceedings, 98, 413–417.
Lusardi, A. & Mitchell, O.S. (2008b) How much do people know about economics and finance? Financial illiteracy and the importance of financial education. Michigan Retirement Research Center. Policy Brief, No. 5. [WWW document]. URL http://www.dartmouth.edu/ ~alusardi/Papers/Lusardi-Mitchell08.pdf (accessed on 4 June 2012). Lusardi, A. & Mitchell, O.S. (2011) Financial literacy and retirement
planning in the United States. Journal of Pension Economics and
Finance, 10, 509–525.
Lusardi, A. & Tufano, P. (2009) Debt literacy, financial experiences, and overindebtedness. NBER Working Paper 14808. [WWW document]. URL http://www.nber.org/papers/w14808 (accessed on 4 June 2012). Mandell, L. & Klein, L. (2009) The impact of financial literacy
educa-tion on subsequent financial behavior. Journal of Financial
Counseling and Planning, 20, 15–24.
Mannheim Research Institute for the Economics of Aging (MEA) Universität Mannheim, Germany (2009) The German SAVE study. Mannheim. [WWW document]. URL http://mea.mpisoc.mpg.de/ fileadmin/files/polstudies/3aferngy0iaowiys_MEA_Study_6.pdf (accessed on 4 June 2012).
Manton, E.J., English, D.E., Avard, S. & Walker, J. (2006) What college freshmen admit to not knowing about personal finance. Journal of
Moore, D. (2003) Survey of Financial Literacy in Washington State:
Knowledge, Behavior, Attitudes and Experiences, Technical Report
03-39, Washington State University Social and Economic Sciences Research Center.
Müller, S. & Weber, M. (2008) Financial literacy and mutual fund investments: who buys actively managed funds? Schmalenbach
Busi-ness Review, 62, 126–153.
NASD Investor Literacy Research (2003) NASD investor literacy research: executive summary. [WWW document]. URL http://www .finrafoundation.org/web/groups/foundation/@foundation/documents/ foundation/p118411.pdf (accessed on 4 June 2012).
National Endowment for Financial Education (2006) USA today/national endowment for financial education ‘young adults finance poll’. [WWW document]. URL http://www.nefe.org (accessed on 1 December 2011).
National Foundation for Credit Counseling (2008) 2008 financial lit-eracy survey. [WWW document]. URL http://www.nfcc.org/ newsroom/FinancialLiteracy/files/2008SummaryReportTopline.pdf (accessed on 4 June 2012).
Noctor, M., Stoney, S. & Stradling, R. (1992) Financial literacy: a dis-cussion of concepts and competences of financial literacy and oppor-tunities for its introduction into young people’s learning. Report prepared for the National Westminster Bank, National Foundation for Education Research, London.
Organisation for Economic Co-Operation and Development (OECD) (2005) Improving Financial Literacy: Analysis of Issues and Policies. OECD, Paris.
Remund, D.L. (2010) Financial literacy explicated: the case for a clearer definition in an increasingly complex economy. Journal of Consumer
Affairs, 44, 276–295.
Robb, C.A. (2011) Financial knowledge and credit card behavior of college students. Journal of Family and Economic Issues, 32, 690–698.
van Rooij, M., Lusardi, A. & Alessie, R. (2011) Financial literacy and stock market participation. Journal of Financial Economics, 101, 449–472.
Schagen, S. & Lines, A. (1996) Financial Literacy in Adult Life: A
Report to the Nut West Group Charitable Trust. National Foundation
for Educational Research, Slough, Berkshire.
Schuchardt, J., Hanna, S., Hira, T., Lyons, A., Palmer, L. & Xiao, J. (2009) Financial literacy and education research priorities. Journal of
Financial Counseling and Planning, 20, 84–95.
Servon, L.J. & Kaestner, R. (2008) Consumer financial literacy and the impact of online banking on the financial behavior of lower-income bank customers. Journal of Consumer Affairs, 42, 271–305. Statistics Canada (2009) Canadian financial capability survey. Ottawa,
ON.
U.S. Department of the Treasury, Office of Financial Education (2006) Taking ownership of the future: the national strategy for financial lit-eracy. [WWW document]. URL http://www.mymoney.gov/sites/ default/files/downloads/ownership.pdf (accessed on 4 June 2012). U.S. President’s Advisory Council on Financial Literacy (2008) 2008
annual report to the president. [WWW document]. URL http://www .jumpstart.org/assets/files/PACFL_ANNUAL_REPORT_1-16-09.pdf (accessed on 4 June 2012).
Vitt, L.A., Anderson, C., Kent, J., Lyter, D.M., Siegenthaler, J.K. & Ward, J. (2000) Personal Finance and the Rush to Competence:
Financial Literacy Education in the U.S. Fannie Mae Foundation,
Middleburg, VA.
Volpe, R., Chen, H. & Pavlicko, D. (1996) Personal investment literacy among college students: a survey. Financial Practice and Education, 6, 86–94.
Willis, L.E. (2008) Against financial literacy education. Public Law and Legal Theory Research Paper No. 08-10. University of Pennsylvania Law School.
World Bank (2009) The Russia financial literacy diagnostic survey. Washington, DC. [WWW document]. URL http://microdata .worldbank.org/index.php/catalog/1028 (accessed on 4 June 2012). Worthington, A. (2004) The distribution of financial literacy in
Aus-tralia. Working Paper No. 185. Queensland University of Technology. Worthington, A. (2006) Predicting financial literacy in Australia.
Finan-cial Services Review, 15, 59–79.
Xiao, J.J. (1997) College students and credit cards: do attitudes affect behavior? The Journal of Consumer Education, 15, 25–35.
Yoong, J. (2010) Financial illiteracy and stock market participation: evi-dence from the RAND American Life Panel. Pension Research Council Working Paper PRC WP2010-29. Wharton School, University of Pennsylvania.