Preparation and Characterization of a PEDOT-Manganese Oxide
Composite, and Its Application to Electrochemical Sensing
To cite this article: A. Arena 2016 IOP Conf. Ser.: Mater. Sci. Eng. 108 012047
View the article online for updates and enhancements.
Preparation and Characterization of a PEDOT-Manganese
Oxide Composite, and Its Application to Electrochemical
Sensing
A. Arena
Dipartimento di Ingegneria Elettronica, Chimica e Ingegneria Industriale Università di Messina, Contrada di Dio, 98166, Messina, Italy
E-mail: [email protected]
Abstract. Stable and transparent aqueous dispersions of a hybrid organic-inorganic composite, are prepared by electrochemically doping Manganese Oxide into Polyethylendioxythiophene (PEDOT). Films deposited from the PEDOT-MnOx dispersions, are characterized by means of electrical and optical measurements, and by means of Atomic Force Microscopy (AFM) investigations. The PEDOT-MnOx composite is then used to modify one of the gold electrodes of a simple electrochemical cell, in which Nafion is used as a solid electrolyte. The cell is characterized using time domain electrical measurements. It is found that distinguishable redox peaks arise in the current-voltage loops of the cell, as nanomolar amounts of either acetic acid and ammonia, are added to the deionized water into which the cell is immersed. The intensity of such current peaks, is linearly related to the concentration of the analytes, in the nanomolar range of concentrations.
1. Introduction
The development of hybrid composites combining the attractive properties of organic polymers with the peculiar behaviour of metal oxides, represents one of the most relevant contributions that materials science has given to the advancements in a variety of applied research fields, including energy storage [1, 2], photovoltaic energy generation [3, 4], sensing [5, 6], and catalysis [7]. As far as it concerns sensing, for instance, it is well known that the performance of chemical sensors can be substantially improved by replacing the metal oxides on which commercially available sensors are often based on, with organic-inorganic composites. Hybrid materials, in fact, can be tailored to combine the advantages of doped conjugated polymers, namely the low working temperature and the good mechanical and electrical transport properties, with the sensitivity, and often the selectivity of metal oxides. In such a framework, in 2012 Wu et al. [5] demonstrated the electrochemical sensing properties of a hybrid composite consisting of PEDOT and Manganese Oxide, synthesised by electropolymerization of the 3,4-ethylenedioxythiophene monomer in the presence of Manganese Acetate. Here a similar composite, PEDOT-MnOx, is prepared by electrochemical doping Manganese Oxide into Polyethylendioxythiophene. Electrical measurements performed in the frequency and time domains show that films deposited from the PEDOT-MnOx dispersions have good charge transport properties, that make them a suitable choice for use as electrodes in electrochemical devices. Sensing tests performed in deionized water, reveal that that simple electrochemical cells having one of the electrodes modified with PEDOT-MnOx, reversibly respond to the presence of nanomolar amounts of acetic acid and of ammonia.
2. Experimentals
Water dispersions of highly conducting Polyethilendioxythiophene and Manganese were purchased from Aldrich. Alcoholic dispersions of Nafion 117 were purchased from Ion Power. The PEDOT-MnOx composite was obtained as a fine dispersion by applying an electric field of about 10V/cm between a couple of manganese electrodes placed inside of a beaker containing PEDOT in a water/ethanol mixture. Immediately, as the manganese cathode started to dissolve, the blue transparent colour of the PEDOT dispersion started to change, reaching the dark brown. Thin films deposited from the developed brown dispersions, were characterized by means of spectrophotometric measurements in the VIS-NIR range performed using an Ocean Optics microspectrophotometer HR4000, and by means of AFM morphological analysis performed in the noncontact mode, using a Nanosurf FlexAFM equipped with a C3000 controller. The electrical properties of the PEDOT-MnOx films were characterized by means of impedance measurements, performed in air using an Agilent 4284A LCR meter, in the frequency range between 20 Hz and 1MHz, with a 100 mV amplitude sinusoidal input. Simple electrochemical cells based on PEDOT-MnOx, were developed using as substrates copier grade transparency sheets, onto the surface of which rectangular parallel gold electrodes, spaced by half a millimetre, were thermally evaporated in vacuum. The PEDOT-MnOx composite was applied onto the top of one of the gold electrodes. The device was then accomplished by depositing a thin Nafion layer onto the insulating gap between the gold electrode and the Au/PEDOT-MnOx electrode, to provide a proton conducting electrical bridge between the electrodes. Time domain electrical characterization of the Au/Nafion/MWNT-Nafion:Cu/Au cells was performed using the 2400 Keithley source meter, by measuring the current flowing through the device, in response to zero average triangular voltage inputs. Measurements were carried out over symmetric voltage windows. Sensing tests were performed with the cells immersed in deionized water. Diluted acetic acid and ammonia were injected into the solution containing the sensor under test by using a micro syringe, in order to increase the analytes concentration in steps of 2Â10-9 M.
3. Results and Discussion
Manganese cathodes, immersed into water/ethanol polyethilendioxythiophen mixtures, dissolve in the presence of externally applied electric fields, due to the formation of hydroxides species at the metal surface. After a few minutes of electrochemical doping under 10V/cm electric field, the polyethilendioxythiophen mixtures turn their colour from the original transparent blue to the brown, due to the dispersions of the dissolution products originating form the cathode. Such colour changes
500 600 700 800 900 Ab so rb an ce ( a. s. ) Wavelenght (nm)
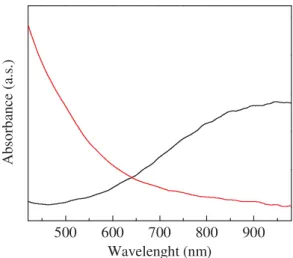
Figure 1. Absorption spectrum of a PEDOT thin
film (black) and of PEDOT-MnOx thin film (red).
Figure 2. AFM micrography of a film
deposited from an aqueous dispersion of PEDOT-MnOx.
are evidenced in Fig.1, where the optical absorption spectrum of PEDOT, nearly transparent in the visible range, and slightly absorbing in the near infrared, is compared with the absorption of PEDOT-MnOx. This latter is found to increase smoothly, as the wavelength decreases.
Figure 2 shows the AFM image, collected in the non contact mode, of a thin film deposited onto a silicon substrate from the electrochemically prepared PEDOT-MnOx aqueous suspensions. The film has a granular morphology, and seems to consist of densely packed particles, having hundreds nanometers average size, randomly distributed into the polymer host. The ratio between the organic and the inorganic counterpart, can be adjusted by acting on the electrochemical doping time: the higher is the doping time, the higher is the nanoparticles concentration. From the electrical point of view, the electrochemical doping of Manganese Oxide into PEDOT has remarkable effects. The data shown in figure 3 represent the frequency dependence of the complex impedance of a thin PEDOT-MnOx film, deposited onto the gap between a couple of symmetric gold electrodes spaced by about half a mm. Compared with the predominantly resistive impedance of highly conducting pure PEDOT, the composite film has one order of magnitude higher resistive part of the impedance, and six order of magnitude higher modulus of the reactive part.
Time domain electrical characterization of the Au/Nafion/PEDOT-MnOx/Au cells is performed by measuring the current that flows through the cell in response to triangular voltage inputs, as it is sketched in figure 4. 102 103 104 105 106 4 8 12 4 8 12 -Im{ Z ( ω )} (k Ω ) Re{ Z (w )} (k Ω ) Frequency (Hz)
Figure 3. Frequency dependence of the real part (black) and of
the opposite of the imaginary part (red) of the complex impedance of a PEDOT-MnOx film.
Figure 4. Sketch of the time dependence of the triangular voltage input V (a) and typical
shape of the corresponding current output I (b). With increasing time, the current I plotted against voltage V describes loops as the one sketched in (c), advancing in sense of the arrow as the time increases. A schematic view of the cell and the voltage polarity are shown in (d).
t V (a) Au Pedot-MnOx Nafion V I (d) t I (b) I V (c)
It is found that the current measured through a typical Au/Nafion/PEDOT-MnOx/Au cell in deionized water, after a short transient phase, forms stable loops when plotted against voltage. Loops form because the current is affected not only by the applied voltage, but it depends also on the time rate at which the voltage changes, therefore the direct current (i.e. the current measured during the half wave of increasing input voltage) does not coincide with the reverse current, measured while the input voltage has a negative time derivative. This is found to be the case whenever the device under test has a capacitive-resistive behaviour, as it likely happens in the Au/Nafion/PEDOT-MnOx/Au cells, where capacitive effects may arise both from faradaic effects, and from the double layer capacitance that forms at the interface between the electrodes and the ion conducting NAFION layer.
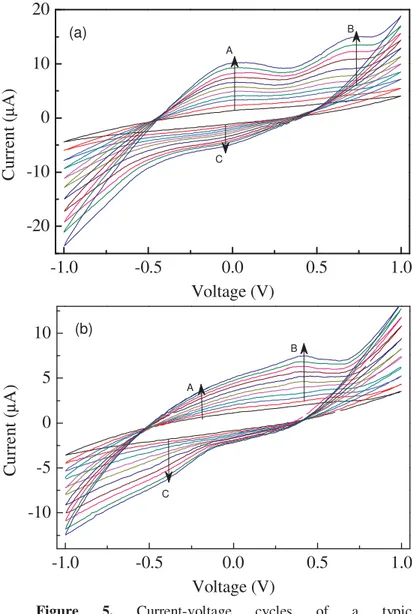
Figures 5a and 5b show examples of steady state current-voltage loops of a typical Au/Nafion/PEDOT-MnOx/Au cell, measured in response to the same voltage inputs (zero average triangular voltage pulse, with 1 V amplitude and 40 s period). The loops differ one from each other by the environment in which the measurements are carried out. In particular, the inner cycle of both figures 5a and 5b (black line), is measured in pure deionized water. The outer cycles represent the steady state current measured respectively when acetic acid (Fig. 5a), and when ammonia (Fig. 5b), are added to the pure water, in subsequent steps of 2 nM.
It can be noticed that the area subtended by the current-voltage cycles shown in Figure 5a, enlarges with the increasing acetic acid concentration. In addition, as the acetic acid content is increased, it is found that a couple of forward current peaks arises, centred at about 100 mV and 700 mV (marked by the arrows, and indicated as A and B in the Figure 5a), while a reverse current peak (marked as C) seems to appear at -30 mV approximately.
-1.0
-0.5
0.0
0.5
1.0
-10
-5
0
5
10
C BCu
rr
en
t (
μA)
Voltage (V)
A (b)-1.0
-0.5
0.0
0.5
1.0
-20
-10
0
10
20
C BCu
rre
n
t (
μA)
Voltage (V)
A (a)Figure 5. Current-voltage cycles of a typical
Au/Nafion/PEDOT-MnOx/Au device, measured in distilled deionized water (black line), and in the presence of acetic acid (a) and of ammonia (b) respectively. The analyte concentration increases going from the inner to the outer loops, in the direction marked by the arrows.
Similar results, with current peaks distinguishable from the former case, are obtained when the cell having a gold electrode modified with PEDOT-MnOx, is exposed to the presence of ammonia. As the NH3 content increases, in steps of 2 nM going from the inner to the outer current loops of Figure 5b, a forward current peak (marked as B) grows at about 420 mV, and a couple of forward and reverse broad structures seem to arise (marked by A and C in figure 5b), with shoulders positioned at about -200 mV and -400 mV respectively.
Based on the results of figures 5a and 5b, it can be argued that the Au/Nafion/PEDOT-MnOx/Au electrochemical cells are able to detect the presence of weak acids as acetic acid is, and of bases like ammonia, at concentration in the nanomolar range. To demonstrate that the currents peaks of figures 5 are a peculiarity of the PEDOT-MnOx modified electrode, sensing test have been performed using Au/Nafion/Au, and Au/Nafion/PEDOT/Au cells, without obtaining any meaningful response. It can be concluded that the sensitivity towards acetic acid and ammonia is ascribable to the presence of the metal oxide nanoparticles. Responsible of the current peaks shown in figures 5a and 5b may be redox transitions involving the Manganese Oxides, similar to those described by Latif et al. [8], in their review concerning the development of pH sensors [8]. As Latif et al. suggest, in alkaline environment, electrochemical sensing may arise from the reversible transition between the Manganese Oxide and the Manganese Oxyhydroxide redox couple (MnO2/MnOOH):
In acidic medium, and in the presence of Nafion [8], the redox equilibrium may instead involve a different couple, consisting of Manganese Oxide and ionized Manganese (MnO2/Mn+2):
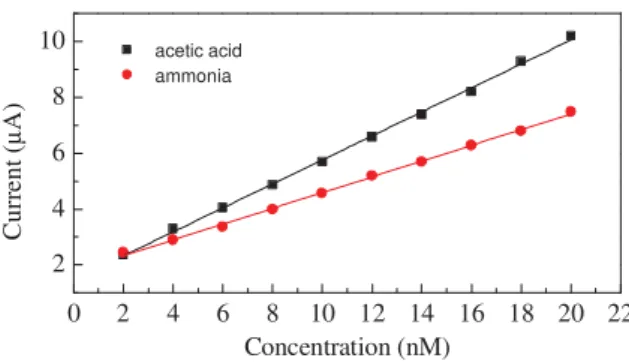
Data extracted from figures 5a and 5b, can be used to determine how the intensity of the current peaks due to redox transitions promoted by the analytes, are related to the analytes concentration. Figure 6 shows that the peak marked as A in figure 5a, and the peak marked as B in figure 5b, have intensity that linearly grows, respectively as the acetic acid and as the ammonia concentration grows.
4. Conclusions
A conducting organic-inorganic composite of Manganese Oxide nanoparticles dispersed in PEDOT, has been prepared using a simple electrochemical method, and characterized by means of electrical and optical measurements. The material, applied on gold, has been used as an electrode in electrochemical cells, having Nafion as solid electrolyte. The current-voltage loops of the cells, measured in deionized water, reversibly modify in the presence of acetic acid and ammonia, showing current peaks originating from redox transitions involving the metal oxide. Since the current peaks that arise in response to acetic acid and ammonia, likely originate from different redox systems, it follows that the presence of a weak acid at nanomolar concentration, can be potentially detected and distinguished from the presence of a base. Furthermore, it is found that the current peaks’ intensity is a linear function of the analytes’ concentration in the nanomolar range. These results, seem to make the PEDOT-MnOx a promising candidate for electrochemical sensing applications.
Figure 6. Intensity of the current peak marked as A
in figure 5a (squares), and of the current peak marked as B in figure 5b, respectively as a function of the acetic acid and of the ammonia concentration. 0 2 4 6 8 10 12 14 16 18 20 22 2 4 6 8 10 acetic acid ammonia Cu rr en t ( μ A) Concentration (nM) MnO2+H++e-
ĺ
ĸ
MnOOH.References
[1] Luo J, Tung VC, Koltonow AR, Jang HD, and Huang J 2012 J. Mater. Chem. 22 12993 [2] Sidhu NK and Rastogi AC 2014 Nanoscale Res. Lett. 9 453
[3] Boucle J, Ravirajanac P and Nelson J 2007 J. Mater. Chem. 17 3141 [4] Skompska M 2010 Synt. Met. 160 1
[5] Wu ZY, Thiagarajan S, Chen SM, and Lin KC 2012 Int. J. Electrochem. Sci. 7 1230 [6] Yinhua L, Gong J, He G and Deng G 2011 Mat. Chem. Phys. 129 477
[7] Zhang L, Jamal R, ZhaoQ, Wang M and Abdiryim T 2015 Nanoscale Res. Lett. 10 148
[8] Latif U. and F.L. Dickert in Environmental analysis by electrochemical sensors and biosensors Vol II Applications ISBN 978-1-4939-1300-8 Springer, edited by L.M. Moretto and K. Kalcher 751-777 2014.