JHEP10(2020)047
Published for SISSA by SpringerReceived: June 29, 2020 Accepted: September 7, 2020 Published: October 7, 2020
Upper limit on the η → π
+π
−branching fraction with
the KLOE experiment
The KLOE-2 collaboration
D. Babusci,d M. Berlowski,v C. Bloise,d F. Bossi,d P. Branchini,s A. Budano,r,s B. Cao,u F. Ceradini,r,s P. Ciambrone,d F. Curciarello,a,d E. Czerwiński,c
G. D’Agostini,n,o E. Danè,d V. De Leo,n,o E. De Lucia,d A. De Santis,d
P. De Simone,d A. Di Cicco,r,s A. Di Domenico,n,o D. Domenici,d A. D’Uffizi,d A. Fantini,p,q P. Fermani,d S. Fiore,t,o A. Gajos,c P. Gauzzi,n,o S. Giovannella,d E. Graziani,s V.L. Ivanov,g,h T. Johansson,u X. Kang,w,d,1 D. Kisielewska-Kamińska,c E.A. Kozyrev,g,h W. Krzemien,v A. Kupsc,u P.A. Lukin,g,h G. Mandaglio,f,b
M. Martini,d,m R. Messi,p,q S. Miscetti,d D. Moricciani,d P. Moskal,c S. Parzych,c A. Passeri,s V. Patera,l,o E. Perez del Rio,n,o P. Santangelo,d M. Schioppa,j,k A. Selce,r,s M. Silarski,c F. Sirghi,d,e E.P. Solodov,g,h L. Tortora,s G. Venanzoni,i W. Wiślickiv and M. Wolkeu
aDipartimento di Fisica e Astronomia “Ettore Majorana”, Università di Catania, Italy bINFN Sezione di Catania, Catania, Italy
cInstitute of Physics, Jagiellonian University, Cracow, Poland dLaboratori Nazionali di Frascati dell’INFN, Frascati, Italy
eHoria Hulubei National Institute of Physics and Nuclear Engineering, Mˇagurele, Romania fDipartimento di Scienze Matematiche e Informatiche,
Scienze Fisiche e Scienze della Terra dell’Università di Messina, Messina, Italy
gBudker Institute of Nuclear Physics, Novosibirsk, Russia hNovosibirsk State University, Novosibirsk, Russia
iINFN Sezione di Pisa, Pisa, Italy
jDipartimento di Fisica dell’Università della Calabria, Rende, Italy kINFN Gruppo collegato di Cosenza, Rende, Italy
lDipartimento di Scienze di Base ed Applicate per l’Ingegneria dell’Università “Sapienza”,
Roma, Italy
mDipartimento di Scienze e Tecnologie applicate, Università “Guglielmo Marconi”, Roma, Italy nDipartimento di Fisica dell’Università “Sapienza”, Roma, Italy
oINFN Sezione di Roma, Roma, Italy
JHEP10(2020)047
pDipartimento di Fisica dell’Università “Tor Vergata”, Roma, Italy qINFN Sezione di Roma Tor Vergata, Roma, Italy
rDipartimento di Matematica e Fisica dell’Università “Roma Tre”, Roma, Italy sINFN Sezione di Roma Tre, Roma, Italy
tENEA, Department of Fusion and Technology for Nuclear Safety and Security,
Frascati (RM), Italy
uDepartment of Physics and Astronomy, Uppsala University, Uppsala, Sweden vNational Centre for Nuclear Research, Warsaw, Poland
wSchool of Mathematics and Physics, China University of Geosciences (Wuhan), Wuhan, China
E-mail: [email protected]
Abstract: Based on an integrated luminosity of 1.61 fb−1 e+e− collision data collected
with the KLOE detector at DAΦNE, the Frascati φfactory, a search for the P and CP
-violating decay η → π+π− has been performed. Radiative φ → ηγ decay is exploited to
access the η mesons. No signal is observed in the π+π− invariant mass spectrum, and the
upper limit on the branching fraction at 90% confidence level is determined to be B(η →
π+π−) < 4.9 × 10⁻⁶, which is approximately three times smaller than the previous KLOE
result. From the combination of these two measurements we get B(η → π+π−) < 4.4×10⁻⁶
at 90% confidence level.
Keywords: Branching fraction, CP violation, e+-e− Experiments, Rare decay
JHEP10(2020)047
Contents
1 Introduction 1
2 The KLOE detector at DAΦNE 2
3 Data sample and event selection 2
4 Upper limit on the branching fraction 5
5 Systematic uncertainty 6
6 Combination with 2001/2002 data 6
1 Introduction
Violation of CP symmetry is a crucial ingredient in understanding the origin of the Baryon Asymmetry in the Universe (BAU). Although the Standard Model (SM) can explicitly accommodate CP violation through a single relevant phase in the Cabibbo-Kobayashi-Maskawa (CKM) quark mixing matrix, this source of CP violation appears largely insuf-ficient to explain the observed value of the BAU.
In the SM the P and CP violating decay η → π+π− can proceed only through CP
violating weak interactions via a virtual KS0 meson, with an expected branching fraction
less than 2 × 10⁻²⁷[1]. Introducing CP violation in strong interactions through a possible
θ-term in the QCD Lagrangian [2] would enhance this limit at the level of ∼ 3 × 10⁻¹⁷. Allowing additional CP violation phases in the extended Higgs sector of the electroweak
theory could generate the decay with a branching fraction up to 1.2 × 10⁻¹⁵ [3, 4]. By
taking into account the higher-order chiral Lagrangian, the couplings of η(η0)ππ can be
connected with the neutron electric dipole moment (nEDM) [5]. A recent work using the
present upper bound on the nEDM indicates an upper limit for η → π+π−of 5.3×10⁻¹⁷[6].
A branching fraction larger than the above mentioned levels would be an indication of unconventional sources of CP violation, which would possibly help solving the
prob-lem of the origin of the BAU, and making the search for the η → π+π− decay worth of
experimental investigation at any accessible level at present experimental facilities. The best upper limit to date on this branching fraction is from the KLOE experiment,
B(η → π+π−) < 1.3 × 10⁻⁵ at 90% confidence level (CL) [7], based on the analysis of 350
pb−1of data collected at the φ resonance peak in years 2001 and 2002. A recent upper limit
has been obtained by the LHCb Collaboration [8], B(η → π+π−) < 1.6 × 10⁻⁵ at 90% CL,
searching for the signal in D+ → π+η and D+
s → π+η decays produced in proton-proton
collisions. The result of a new search for the decay η → π+π− based on an integrated
luminosity of 1.61 fb−1 of data collected by the KLOE experiment in years 2004 and 2005
JHEP10(2020)047
2 The KLOE detector at DAΦNE
DAΦNE [9] is an e+e− collider operated at center-of-mass energy of the φ meson peak,
∼1.020 GeV, with a beam energy spread of (0.302 ± 0.001) MeV. Positron and electron beams collide with a period of 2.7 ns at an angle of ∼25 mrad, producing φ mesons with
a small transverse momentum ∼ 13 MeV/c. The longitudinal and horizontal width of
the beam-beam collision region is ∆z ∼12 mm and ∆x ∼1.2 mm respectively. All these quantities are measured run-by-run to obtain a good precision of the integrated
luminos-ity [10]. The KLOE detector at DAΦNE is composed of a large cylindrical drift chamber
(DC) [11] and an electromagnetic calorimeter (EMC) [12] made of lead and scintillating
fibres surrounded by a superconducting coil providing a 0.52 T axial magnetic field. The cylindrical drift chamber, 2 m radius and 3.3 m length, is operated with a 90% helium
and 10% isobutane gas mixture; its spatial resolution is σxy ∼ 150 µm and σz ∼ 2 mm in
the transverse and longitudinal projections, respectively. The transverse-momentum
reso-lution for large-angle tracks is σpT/pT ∼ 0.4%. Vertices are reconstructed with a spatial
resolution of ∼ 3 mm. The calorimeter made by lead and scintillating fibers consists of a cylindrical barrel and two end-caps providing a solid angle coverage of ∼ 98%. The energy
resolution for photons is σE/E = 0.057/p
E(GeV ) and the time resolution is σt = 54
ps/pE(GeV ) ⊕ 100 ps. The spatial resolution is 1.4 cm/p
E(GeV ) along the fibers and
1.3 cm in the orthogonal direction.
The KLOE trigger system [13] uses a two level scheme. The first level trigger is a fast
trigger with a minimal delay which starts the acquisition of the EMC front-end-electronics. The second level trigger is based on the energy deposits in the EMC (at least 50 MeV in the barrel and 150 MeV in the end-caps) or on the hit multiplicity information from the DC. The trigger conditions are chosen to minimise the machine background, and recognise Bhabha scattering or cosmic-ray events. Both the calorimeter and drift chamber triggers are used for recording physical events.
The GEANFI Monte Carlo (MC) [14] simulation describes the geometry and material
of the KLOE detector, as well as the detector response. Run-by-run machine background conditions are taken into account; the calorimeter energy deposits and drift chamber hits from beam background events triggered at random are overlaid onto the simulated events. The simulated events are processed with the same reconstruction algorithms as the data. The MC production includes all the relevant φ decay channels, and continuum processes
e+e−→ e+e−γ, µ+µ−γ, π+π−γ to estimate the background contributions. Proper scaling due to the different integrated luminosity of the samples is taken into account when the different MC contributions are merged together. A sample of the signal φ → ηγ with
η → π+π− is generated to optimise the event selection criteria and to determine the detector efficiency.
3 Data sample and event selection
For the selection of signal candidate events φ → ηγ with η → π+π−, two opposite charged
tracks with a vertex near the e+e− interaction point (IP) are required together with an
JHEP10(2020)047
energy deposit (cluster) in the EMC compatible with the photon recoiling against the η meson from the IP. The tracks are reconstructed from hits in drift chamber within the
polar angle range 45◦ < θ < 135◦. The vertex is required to be within a cylinder, 20 cm
long and 8 cm of radius, centered on the IP. To evaluate the time of flight of particles both tracks are required to be associated to a cluster in the EMC. The transverse and three-dimensional distances between the centroid of the associated cluster and the track extrapolation point to the calorimeter front surface are required to be less than 30 cm and 100 cm, respectively (track-to-cluster association). The cluster energy is required to be greater than 10 MeV. If there is more than one cluster satisfying the above requirements, the cluster with the lowest transverse distance is assigned as the associated cluster. The scalar sum of the momenta of the two tracks must lie in the range [0.15,1.03] GeV/c. Selected φ → ρπ events are used to study the tracking and vertex efficiencies on data and MC. Efficiency corrections as a function of transverse and longitudinal momenta for charged pions reconstruction are applied to all MC samples. The correction for the vertex
efficiency is negligible. A background filter algorithm [14] based only on information from
the EMC is used to reject cosmic rays and Bhabha scattering background events.
The recoil photon candidate is selected by requiring an isolated energy cluster in
the EMC not associated to any track. The condition on cluster time |Tcl − Rcl/c| <
min(5σt(Ecl), 2ns) is used to identify a photon originating from the IP (prompt photon),
where Tcl is the cluster time, Rcl is the distance from the IP, σt is the energy-dependent
time resolution. To suppress background from e+e− → π+π−γ process, the cluster is also
required to be at large polar angle 45◦ < θγ< 135◦. As for the two body decay φ → ηγ the
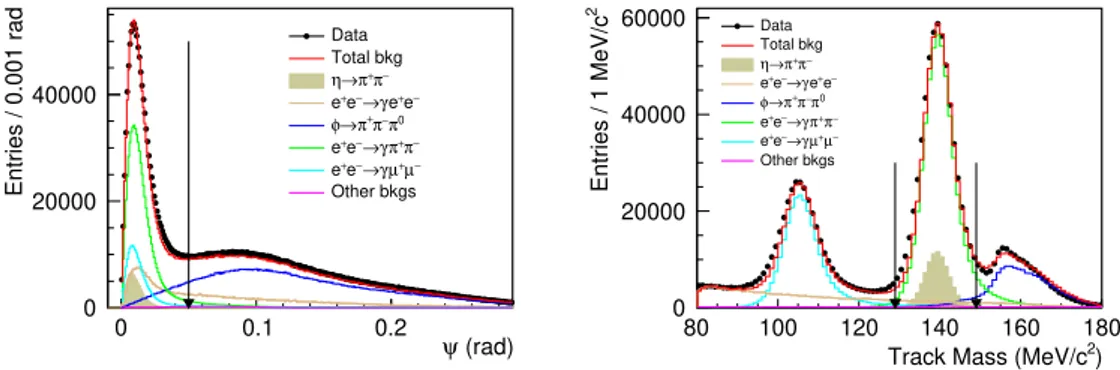
recoil photon has an energy of 363 MeV in the φ rest frame, the selected candidate photon is required to have an energy in the range [250, 470] MeV. To match the missing energy and momentum obtained from the two tracks with the photon kinematics, the angle ψ between the direction of the missing momentum of the two tracks and the direction of the recoil
photon, shown in the left panel of figure1, is required to be less than 0.05 rad.
The remaining background originates from the processes e+e− → e+e−γ, µ+µ−γ,
φ → ρ±π∓ with ρ± → π±γ, and φ → π+π−π0 with an undetected photon. To separate
π+π−γ and e+e−γ events, particle identification with a time of flight technique is used.
The difference between the time of the cluster associated to the track (Tcl) and the time
calculated from the track length L and particle momentum p under different mass
hypothe-ses is defined as δtX = Tcl − L/(cβX), where βX = p/
q
p2+ m2
X and mX is the pion or
electron mass, the scatter plots of δte vs δtπ for data and MC simulated signal are shown
in figure2. A track with 0.2 < δte< 2.5 ns and −0.4 < δtπ < 1.5 ns is identified as a pion.
Events with at least one pion are retained. The cuts have been chosen to optimize the
rejection of the e+e−γ background, while keeping almost unaltered efficiency on the signal.
The µ+µ−γ and π+π−π0 background events can be rejected using the mass of the
charged tracks, Mtrk, computed by assuming the φ decays to two identical mass particles
and a photon, i.e.
|~pφ− ~p1− ~p2| = Eφ−
q
|~p1|2+ Mtrk2 −
q
|~p2|2+ Mtrk2 , (3.1)
JHEP10(2020)047
(rad) ψ 0 0.1 0.2 Entries / 0.001 rad 0 20000 40000 Data Total bkg − π + π → η − e + e γ → − e + e 0 π − π + π → φ − π + π γ → − e + e − µ + µ γ → − e + e Other bkgs ) 2 Track Mass (MeV/c80 100 120 140 160 180 2 Entries / 1 MeV/c 0 20000 40000 60000 Data Total bkg − π + π → η − e + e γ → − e + e 0 π − π + π → φ − π + π γ → − e + e − µ + µ γ → − e + e Other bkgs
Figure 1. Left: The angle ψ between the direction of missing momentum of π+π−and the prompt
photon. Right: Distribution of the mass Mtrk of the charged-particle tracks. Black dots are
data; the red histogram is the sum of all background contributions evaluated from MC simulation: φ → ρπ with ρ → ππ (blue histogram), e+e− → π+π−γ (green histogram), e+e− → µ+µ−γ
(cyan histogram), e+e− → e+e−γ (yellow histogram), and the sum of other backgrounds (violet
histogram). The expected signal is shown as the shaded histogram with the branching fraction of η → π+π− arbitrarily fixed to 8.8 × 10⁻³ for visualisation purposes.
(ns) π t δ 2 − 0 2 (ns)e t δ 2 − 0 2 1 10 2 10 3 10 (ns) π t δ 2 − 0 2 (ns)e t δ 2 − 0 2 0 500 1000
Figure 2. Scatter plot of the time difference for the pion (δtπ) and electron (δte) mass hypothesis
for data (left) and MC simulated signal (right). Events within the rectangle are retained for further analysis, within the elliptic shapes are for systematic uncertainty studies.
Eφ is the energy of the φ-meson. Figure 1-right shows the Mtrk distribution for data, the
MC simulated signal and contributions from different background sources. The condition
129 < Mtrk < 149 MeV/c2 is required to be fulfilled for candidate events to reject most of
the backgrounds from µ+µ−γ and π+π−π0.
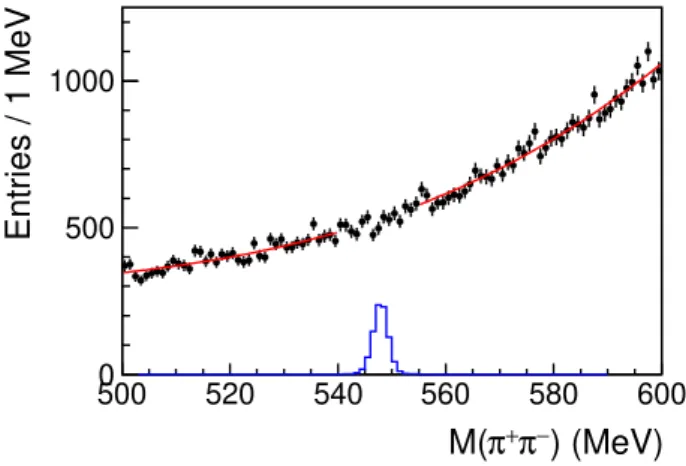
After the above selection criteria, 59,684 events remain in the η mass region [500,600]
MeV/c2. The π+π− invariant mass spectrum, M (π+π−), is shown as the black dots in
figure 3, which will be used to search for the decay η → π+π−. The survived events with
a π+π−γ final state are mainly from e+e− → π+π− accompanied by initial or final state
radiation, φ → f0(980)γ with f0(980) → π+π− and φ → ρ±π∓ with ρ± → π±γ. However,
none of these backgrounds is expected to contribute as a peak in the π+π− invariant mass
near the η mass value.
The irreducible background in the η signal region [540,555] MeV/c2 is evaluated by
performing a fit to the η side bands, [500,540] and [555,600] MeV/c2, with a third-order
polynomial function. The fit has χ2 = 84.9 with 81 degrees of freedom; the result is
JHEP10(2020)047
) (MeV) − π + π M( 500 520 540 560 580 600 Entries / 1 MeV 0 500 1000Figure 3. π+π−invariant mass distribution for data taken in 2004/2005. The dots with error bars
are data, the red lines represent the fit result to η sidebands, the blue histogram is the η signal with the branching fraction arbitrarily fixed to 8.8 × 10⁻⁵ for visualisation purposes.
illustrated by the red lines in figure3. The η signal is described by the corresponding MC
simulated shape, shown as the blue histogram in figure 3; to ease visualisation the signal
branching fraction has been arbitrarily fixed to 8.8 × 10⁻⁵.
The M (π+π−) signal shape and resolution are validated comparing the M (π+π−)
distributions of data and MC for a pure sample of KS → π+π− events.
The detection efficiency for the signal process φ → ηγ with η → π+π− is evaluated
from MC to be ε = (14.70 ± 0.02stat)%.
4 Upper limit on the branching fraction
As no evident peak is observed in the distribution of M (π+π−) in the signal region, an upper
limit on the branching fraction of η → π+π− is extracted with the CLstechnique [15,16].
The CLs value is defined as ps+b/(1 − pb), where pb is the p-value of the background only
hypothesis, ps+b is the p-value of the background plus signal hypothesis. The procedure
requires the measured M (π+π−) spectrum, the shape of the estimated background, the η
signal shape, and the systematic uncertainties as input [17]; the latter will be described in
section 5. It yields as output the limit on the branching fraction B(η → π+π−), with the
number of η → π+π− signal events evaluated as follows:
N (η → π+π−) = Nηγ · B(η → π+π−) · ε, (4.1)
where Nηγ is the number of φ → ηγ events with Nηγ = Lint· σ(e+e− → φ → ηγ); Lint
is the integrated luminosity, determined to be (1.61 ± 0.01) fb−1 from the very large-angle
Bhabha scattering events [10]. The cross section σ(e+e−→ φ → ηγ) has been evaluated to
be (41.7±0.6) nb and takes into account the small variations of√s on a run by run basis [18].
A series of statistical tests is carried out for each hypothesised B(η → π+π−) to
numerically evaluate the distribution functions for the test statistics. The upper limit on
B(η → π+π−) at 90% CL is determined by requiring the CL
JHEP10(2020)047
to be:
B(η → π+π) < 4.9 × 10⁻⁶. (4.2)
The corresponding upper limit on the number of signal events is N (η → π+π−) < 48.
5 Systematic uncertainty
The systematic uncertainties affecting the φ → η(π+π−)γ analysis mainly originate from
the non resonant backgrounds and the difference in variables distributions between data and MC samples.
The estimation of non resonant backgrounds in the signal region by fitting the signal sidebands has a relative uncertainty of 0.5%; by changing the fitting function to second- or
fourth-order polynomial or varying the fitting range by ± 2 MeV/c2, the result varies within
the quoted uncertainty, therefore 0.5% is taken as the systematic uncertainty associated with the non resonant backgrounds.
The systematic uncertainties associated to the selection criteria on ψ and Mtrk are
estimated by varying the cuts within their resolutions respectively and evaluating the
cor-responding effect on M (π+π−). The relative variation compared to the nominal M (π+π−)
spectrum and corrected for the corresponding variation in the MC efficiency is taken as systematic uncertainty, which is determined to be 2.0% for the ψ cut, and 3.0% for the
Mtrk selection.
To evaluate the systematic uncertainty associated with the time of flight selection, the
lower cuts of δteand δtπ are varied alternatively by ± 0.1 ns. In addition, different selection
criteria adopting elliptic cuts in the (δte, δtπ) plane, instead of rectangular, are checked,
i.e. (δte− 0.6)2+ (δtπ − 1.35)2 < 1.56 ns2, or (δte− 0.5)2+ (δtπ − 1.25)2 < 1.36 ns2, as
shown in figure 2. The maximum relative variation compared to the nominal M (π+π−)
spectrum and corrected for the corresponding variation in the MC efficiency is found to be around 1.0%, which is taken as systematic uncertainty.
The trigger efficiency has been evaluated from the comparison of the EMC and DC single and coincidence rates. The efficiency is in agreement with the MC evaluation, with a negligible uncertainty.
A sample of non-filtered and non-pre-selected events, prescaled by a factor of 20, is used to validate the efficiency of the background filter and event pre-selection algorithms.
The e+e− → π+π−γ process is used to estimate the differences between data and MC
associated with the two algorithms, the effect is found negligible.
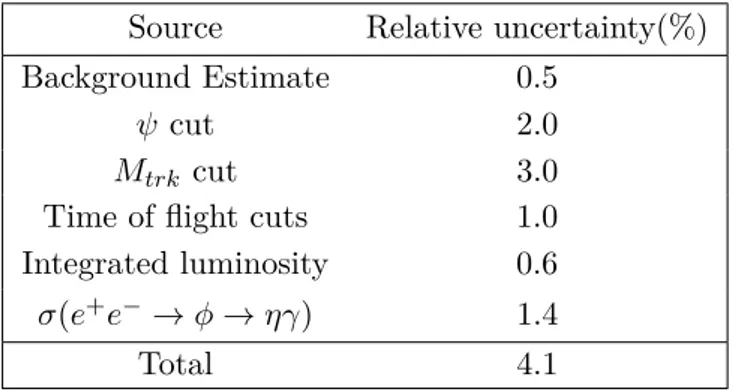
All the systematic uncertainties, including the uncertainty on the integrated
luminos-ity [10] and the cross section σ(e+e−→ φ → ηγ) [18], are listed in table1, where the total
systematic uncertainty is estimated as the sum in quadrature of all contributions.
6 Combination with 2001/2002 data
This section presents the procedure to combine the 2001/2002 data analysed in ref. [7] with
the 2004/2005 data sample to get a combined upper limit.
JHEP10(2020)047
Source Relative uncertainty(%)
Background Estimate 0.5
ψ cut 2.0
Mtrk cut 3.0
Time of flight cuts 1.0
Integrated luminosity 0.6
σ(e+e−→ φ → ηγ) 1.4
Total 4.1
Table 1. Summary of the systematic uncertainties.
In ref. [7] the upper limit was determined at 90% confidence level as:
B(η → π+π−) = N (η → π+π−)
Nη· ε
< 1.3 × 10⁻⁵, (6.1)
with N (η → π+π−) < 33, ε = (16.6 ± 0.2stat ± 0.4syst)%, and Nη = 1.55 × 10⁷ the
normalisation determined from the observed φ → η(3π0)γ decays with a systematic
uncer-tainty of 2%.
The upper limit for this totally independent data sample has been re-evaluated using
the same procedure described in section4. The signal shape is kept the same as in ref. [7],
a Gaussian function centered at the η mass value Mη = 547.874 MeV/c2 measured by
KLOE [19] and a standard deviation of 1.33 MeV/c2 estimated from the MC simulation.
The 90% CL upper limit on B(η → π+π−) is determined to be 1.36 × 10⁻⁵, which is
consistent with the published result.
The procedure described in section4is then used to evaluate the upper limit combining
the two data samples taking into account their differences in the η signal shape, the observed
M (π+π−) spectra and the shape of the estimated backgrounds, similarly to the procedure
used in ref. [20]. The systematic uncertainties estimated for both 2001/2002 and 2004/2005
samples are given as input to the procedure. The resulting upper limit at 90% CL is:
B(η → π+π−) < 4.4 × 10⁻⁶ (6.2)
which is almost a factor of three smaller than the previous limit.
Acknowledgments
We warmly thank our former KLOE colleagues for the access to the data collected during the KLOE data taking campaign. We thank the DAΦNE team for their efforts in maintain-ing low background runnmaintain-ing conditions and their collaboration durmaintain-ing all data takmaintain-ing. We want to thank our technical staff: G. F. Fortugno and F. Sborzacchi for their dedication in ensuring efficient operation of the KLOE computing facilities; M. Anelli for his contin-uous attention to the gas system and detector safety; A. Balla, M. Gatta, G. Corradi and G. Papalino for electronics maintenance; C. Piscitelli for his help during major maintenance
JHEP10(2020)047
periods. This work was supported in part by the Polish National Science Centre through the Grants No. 2013/11/B/ST2/04245, 2014/14/E/ST2/00262, 2014/12/S/ST2/00459, 2016/21/N/ST2/01727, 2016/23/N/ST2/01293, 2017/26/M/ST2/00697.
Open Access. This article is distributed under the terms of the Creative Commons
Attribution License (CC-BY 4.0), which permits any use, distribution and reproduction in
any medium, provided the original author(s) and source are credited.
References
[1] C. Jarlskog and E. Shabalin, How large are the rates of the CP -violating η, η0 → ππ decays?,
Phys. Rev. D 52 (1995) 248[INSPIRE].
[2] H.-Y. Cheng, The Strong CP Problem Revisited,Phys. Rept. 158 (1988) 1[INSPIRE].
[3] C. Jarlskog and E. Shabalin, On searches for CP , T , CP T and C violation in flavour-changing and flavour-conserving interactions,Phys. Scripta T 99 (2002) 23. [4] E. Shabalin, Decays of η and η0 mesons caused by the weak interaction,Phys. Scripta T 99
(2002) 104.
[5] T. Gutsche et al., CP-violating decays of the pseudoscalars η and η0 and their connection to the electric dipole moment of the neutron,Phys. Rev. D 95 (2017) 036022
[arXiv:1612.02276] [INSPIRE].
[6] A.S. Zhevlakov, M. Gorchtein, A.N. Hiller Blin, T. Gutsche and V.E. Lyubovitskij, Bounds on rare decays of η and η0 mesons from the neutron EDM,Phys. Rev. D 99 (2019) 031703
[arXiv:1812.00171] [INSPIRE].
[7] KLOE collaboration, Upper limit on the η → π+π− branching ratio with the KLOE detector,
Phys. Lett. B 606 (2005) 276[hep-ex/0411030] [INSPIRE].
[8] LHCb collaboration, Search for the CP -violating strong decays η → π+π− and
η0(958) → π+π−,Phys. Lett. B 764 (2017) 233 [arXiv:1610.03666] [INSPIRE].
[9] A. Gallo et al., DAΦNE status report, Conf. Proc. C 060626 (2006) 604 [INSPIRE].
[10] KLOE collaboration, Measurement of the DAΦNE luminosity with the KLOE detector using large angle Bhabha scattering,Eur. Phys. J. C 47 (2006) 589[hep-ex/0604048] [INSPIRE].
[11] M. Adinolfi et al., The tracking detector of the KLOE experiment,Nucl. Instrum. Meth. A 488 (2002) 51[INSPIRE].
[12] M. Adinolfi et al., The KLOE electromagnetic calorimeter, Nucl. Instrum. Meth. A 482
(2002) 364[INSPIRE].
[13] KLOE collaboration, The trigger system of the KLOE experiment,Nucl. Instrum. Meth. A 492 (2002) 134[INSPIRE].
[14] F. Ambrosino et al., Data handling, reconstruction, and simulation for the KLOE experiment,Nucl. Instrum. Meth. A 534 (2004) 403[physics/0404100] [INSPIRE].
[15] A. Birnbaum, On the foundations of statistical inference,J. Am. Statist. Assoc. 57 (1962)
269.
[16] A.L. Read, Presentation of search results: The CL(s) technique,J. Phys. G 28 (2002) 2693
[INSPIRE].
JHEP10(2020)047
[17] T. Junk, Confidence level computation for combining searches with small statistics,Nucl.Instrum. Meth. A 434 (1999) 435[hep-ex/9902006] [INSPIRE].
[18] S. Giovannella and S. Miscetti, Study of the e+e−→ π0π0γ process using 2001/2002 data,
KLOE note 212,http://www.lnf.infn.it/kloe/pub/knote/kn212.ps, (2006).
[19] KLOE collaboration, Precise measurements of the eta and the neutral kaon meson masses with the KLOE detector,JHEP 12 (2007) 073 [arXiv:0710.5892] [INSPIRE].
[20] KLOE-2 collaboration, Combined limit on the production of a light gauge boson decaying into µ+µ− and π+π−,Phys. Lett. B 784 (2018) 336 [arXiv:1807.02691] [