Università degli Studi di Ferrara
DOTTORATO DI RICERCA IN
BIOLOGIA EVOLUZIONISTICA E AMBIENTALE
CICLO XXV
COORDINATORE Prof. Guido Barbujani
Conservation genetics of the yellow-bellied
toad (Bombina variegata) and the common
lizard (Zootoca vivipara) in the Italian Alps
Settore Scientifico Disciplinare BIO/18
Dottorando Tutore
Dott. Cornetti Luca Prof. Bertorelle Giorgio
Cotutore Dott. Cristiano Vernesi
Conservation genetics of the yellow-bellied toad (Bombina variegata) and the common lizard (Zootoca vivipara) in the Italian Alps
Table of contents
General introduction p. 1
Studied species
Bombina variegata p. 6
Zootoca vivipara p. 7
The study area p. 8
Major aims of each study p. 9
Funding of the project p. 10
First study: Small effective population size and fragmentation in Alpine populations of Bombina variegata: the combined effects of recent bottlenecks and postglacial
recolonization p. 13
Second study: Mitochondrial and nuclear DNA survey of Zootoca vivipara across the eastern Italian Alps: evolutionary relationships, historical demography and
conservation implications p. 49
Third study: Reproductive isolation is complete between oviparous and viviparous lineages of Zootoca vivipara in a contact zone. p. 79 Fourth study: Zootoca vivipara as a model species to analyse the evolutionary transition from oviparity to viviparity in squamate reptiles: a genomic approach p. 97
General discussion p. 109
Conclusions and future perspective p. 113
Papers published, submitted or in preparation p. 113
General introduction
Global change in mountain ecosystems
Mountain ecosystems are generally considered to be more vulnerable than other areas to global changes (Beniston 2003). The European Alps, the highest mountain system in Europe, is about 1000 km long, ranging from near the Mediterranean Sea on the border between France and Italy, to Slovenia, through northern Italy, Switzerland, southern Germany and Austria. The broadest section of the Alps is over 260 km wide. As many of the most important mountainous regions (e.g. Andes, Rocky Mountains, Himalayas; Rabatel et al. 2013, Rieman & Isaak, 2010; Tse-ring et al. 2010), the Alpine environment is heavily affected by global change, in terms of both climate change and land use (Cannone et al. 2008; Vanham et al. 2009; Keiler et al. 2010; Huggel et al. 2010). Temperatures in the Alps have increased in the last century twice that of the global average (Brunetti et al. 2009). This exceptional temperature change is leading to profound modifications of mountain ecosystems; for example, decreasing snow and glacier cover (IPCC 2007) and changing hydrological systems. In addition, projected scenarios of changing climatic conditions (frequency and intensity of precipitation, temperature, etc.) may even worsen the current scenario (EEA 2009). In the last few decades human activities have also modified the Alpine landscape by both increased exploitation of the natural environment and decreased practice of traditional agricultural activities (Chemini & Rizzoli 2003). For example, urbanization and tourism are threatening the last natural areas leading to habitat fragmentation and loss of biodiversity in many Alpine valleys and lowlands (WWF 2013). On the other hand, abandonment of mountain fields and traditional activities, such as grazing and mowing, is resulting in forest expansion, causing changes in species biology and distribution (Chemini & Rizzoli 2003). Leonelli et al. (2011) observed a 115-metre upward shift of the tree-line during the last century, influencing the geomorphology of high-elevation habitats. Similarly, human impact (in term of change in land use) and modified climatic conditions have favored alien plant species invasions whose distribution may even increase in the near future under current global warming scenarios (Dainese et al. 2013).
Climate change is also predicted to increase the duration and frequency of heat waves (Meehl & Tebaldi 2004). The effects of such record-breaking heat wave, like
that which occurred in Europe during the summer 2003, have been described as the cause of increased mortality (without sign of recovery after 4 years) of plant species living in peatlands (Bragazza 2008); and glaciers melted eight times the annual mean of the period 1960-2000 (Paul et al. 2005). It is expected that the ongoing increase in greenhouse gases in the atmosphere will cause more severe heat waves in the future (Meehl & Tebaldi 2004); consequently, wetlands (such as bogs, swamps, marsh) are considered among the most threatened habitats from climate change worldwide (Moore et al. 2002) and in particular in the Alps, where the warming effects are amplified (Hansen et al. 2006).
The negative impact of global change on animal species in the Alps
Undoubtedly, the effects of global warming and change in land use have also had an impact on animal life histories and distribution. For example, Tafani et al. (2013) showed a continuous decrease in litter size of the Alpine marmot (Tafani et al. 2013) in correlation with reduced snow cover over the last 20 years. Increasing temperatures have also facilitated species invasions in the Alps, such as that of the Tiger mosquito Aedes albopictus (Roiz et al. 2011) with future scenarios predicting a northwards spread for this species (Neterler et al. 2013). The presence and distribution of some avian species are affected by the expansion of shrubs and forests due to the abandonment of mountain fields and meadows: in fact, grassland species, such as the rock partridge Alectoris graeca, have decreased in numbers in the last few decades. Similarly, the capercaille Tetrao urogallus is now endangered in the Alpine chain because of overhunting and decrease in forest management. On the contrary, change in land use favors the increase in density and diffusion of disease vectors (such as the tick Ixodes ricinus) and their main hosts (such as rodents and deer; Chemini & Rizzoli 2003). These trends can also have an impact on human health since it has been demonstrated that host (i.e. deer) abundance is among the most essential factors driving the spread of zoonoses, such as the potentially devastating tick borne encephalitis (TBE; Rizzoli et al. 2009).
Preserving biodiversity: the role of genetic analyses
The International Union for Conservation of Nature (IUCN) recognizes that biodiversity must be preserved at ecosystem, species and genetic levels. Wild species survival relies on the maintenance of all these levels and nowadays, not surprisingly, a
high number of species is considered “endangered” by the IUCN. Although extinction can be considered a natural phase of evolutionary processes, in this era of global change, the planet is facing an important loss of biodiversity due, directly or indirectly, to human activities. In fact, overexploitation of natural populations (hunting, fishing, etc.), habitat deterioration and fragmentation, pollution, introduction of alien species or pathogen outbreaks, interfere with populations survival, usually leading to reduction in population size. Small populations are prone to be affected by inbreeding and loss of genetic diversity, with negative consequences on the individual fitness and on the species or population evolutionary potential to adapt to a changing environment. In fact, the effects of genetic drift, which is the change in allele frequencies due to random sampling, are stronger in small populations. The integration of environmental and genetic factors that could lead to the shrinking of a natural population is described in the extinction vortex (Figure 1). In order to preserve global biodiversity, especially in regions were risks are higher, conservation biologists should therefore study the conservation status of wild species including always the analysis of genetic variation patterns within and between species.
Figure 1. The extinction vortex
An emerging discipline: conservation genetics
Conservation genetics is the use of genetics to aid in the conservation of population or species (Frankham et al. 2002). More specifically, conservation genetics can also be described as the science that attempts to preserve, from human-mediated environmental modifications, the current genetic diversity produced by evolution during the history of life in 3.5 billion years on the Earth (Eisner et al. 1995). Several
scientific fields contributes to conservation genetics, the most relevant being evolution, ecology, population genetics, phylogenetics, molecular biology and mathematical modelling. And several issues are addressed by conservation genetics, such as the loss of genetic variation in small populations or the identification of genetically distinct groups within a species, but also resolving taxonomic uncertainties and using molecular tools to identify illegal hunting. Very importantly, conservation genetics helps biodiversity managers to define conservation priorities and management strategies, and can detect conservation threats (for example, gene flow barriers or low evolutionary potential in populations with large census size) earlier than traditional population biology and ecology methods (Hoban et al. 2013).
The approach of conservation geneticists starts from the study of genetic markers, taking advantage of standard molecular biology techniques (Polymerase Chain Reaction (PCR), sequencing, genotyping, etc.) or from recently developed Next Generation Sequencing (NGS) technologies. Genetic information can be obtained even from a few milligrams of biological samples by means of semi- or non-invasive sampling. For example, high DNA/RNA quality can be achieved from hair, faeces or feathers, from biological samples that can be obtained without handling the animals. Similarly, genetic typing is now feasible from ancient samples available in museum collections.
Three major aims of a conservation genetics analysis, relevant for this thesis, are now briefly described.
Identifying conservation units. Genetic analyses are very useful for detecting evolutionary distinct groups of animals within a species. These groups are usually identified as “Evolutionary Significant Units” (ESUs). Many proposed definitions of ESU exist, but an ESU can be operatively summarized as a population or a group of populations that deserve separate management or priority for conservation because of its high genetic and ecological distinctiveness. Only the integration of genetic and ecological data reinforces the reasons for ESU preservation.
Estimating demographic dynamics. Genetic data are useful for estimating evolutionary parameters in natural populations. In particular, the pattern of genetic variation can be used to estimate the effective population size (Ne) and its dynamic in
time. Ne is a fundamental parameter that describes the number of individuals in an
ideal population having the same amount of genetic drift as in the actual population. Many important processes in evolution and conservation, such as the reduction of fitness due to inbreeding and the capability to adapt to new environments, depend on the effective, and not the census, population size. And the effective population size can be reduced by several factors even when the census size is high, such as unequal sex ratio, non-random number of progeny and fluctuating population size. Conservation geneticists are concerned by changes in Ne and particularly by the
reduction in effective population size, which is defined as a bottleneck. A bottleneck is a sharp decrease in the population size that can lead to reduction of genetic diversity and effective size, promoting the stochastic, and often negative, effects of genetic drift, and thus an additional reduction in population size. A bottleneck event can be viewed as the first step in the extinction vortex (Figure 1).
Identifying genetic fragmentation. Genetic data are also useful for understanding the level of population fragmentation and estimate the divergence among demes. Habitat fragmentation, due to anthropogenic pressure and, consequently, population subdivision are risk factors contributing to extinction of natural populations. Genetic substructure is the result of the lack (or reduced amount) of gene flow, which can counteract the effects of genetic drift. In order to preserve biodiversity, conservation plans are needed for reducing the consequences of fragmentation on wild populations.
In this thesis, I analyzed two vertebrate species living in the Italian Alps, whose distribution is strictly correlated with wetland habitats. The thesis is subdivided into four chapters, corresponding to four different studies. Before describing in detail the studies, I present here the two species, the study area, and provide a short summary of the specific aims of each study.
Studied species Bombina variegata Subphylum Vertebrata Class Amphibia Order Anura Family Bombinatoridae Genus Bombina
Species Bombina variegata
The yellow-bellied toad, Bombina variegata is a small (3-6 cm in length) aquatic toad. Its name derives from its brightly coloured orange-yellow ventral surface with irregular dark markings; its dorsal surface has a wrinkled grey-brown skin. It is well known for the faint but melodic mating call of the males, which can be heard during the mating season (usually from April to August).
B. variegata is found in central-southern Europe, including northern Italy (Figure 2). Its preferred habitats are ephemeral sites, such as small ponds, puddles, river loops and even wheel-ruts, where it reproduces several times a year, usually after heavy rainfalls that fill temporary basins. Egg deposition, which consists of a clutch of 45 to 100 eggs, peaks between the end of April and the end of June, depending on the altitudinal-latitudinal distribution of the population. Larval development is rapid,
taking about 40 days. B. variegata can live for more than 10 years in the wild, but records of even 20 years have been reported (Dino et al. 2010). Adults use the venomous mucus produced by their skin and bright ventral colours as warning signals to predators.
Zootoca vivipara Subphylum Vertebrata Classe Reptilia Ordine Squamata Famiglia Lacertidae Genere Zootoca
Specie Zootoca vivipara
The common lizard Zootoca vivipara (formerly Lacerta vivipara) has a squat body that reaches a length of 15-20 cm, including the tail. The dorsal surface is brown to grey, often with a darker streak running the entire length of the body. Small yellow-white spots are often present on its sides. The ventral surface shows sexual dimorphism: males have bright coloration, from yellow and orange to vermillion with black spots, while females have yellowish-grey unspotted belly.
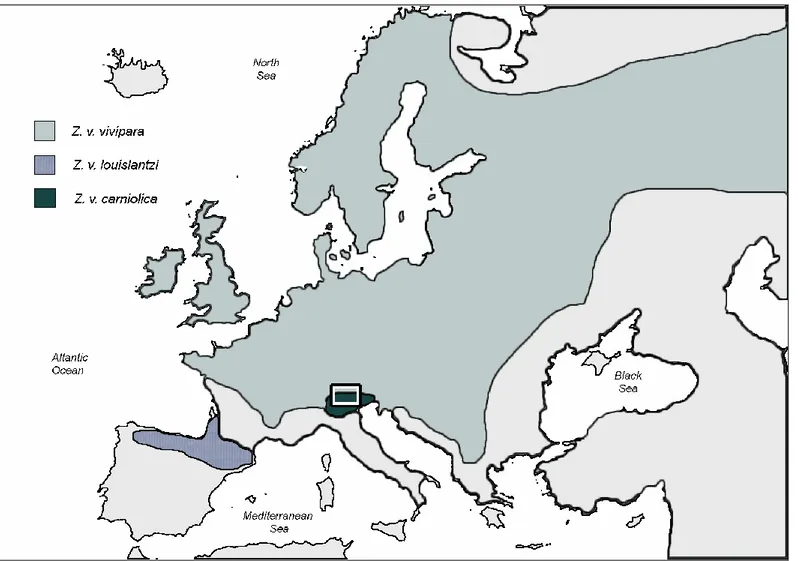
Zootoca vivipara has a wide distribution throughout Europe and Asia, reaching north of the Artic Circle. In the Mediterranean area it mainly occurs in mountainous regions (Alps, Balkans and Pyrenees, Figure 3).
Figure 3. Current distribution of Zootoca vivipara (in yellow, from IUCN 2013).
It is a grassland species and principally lives in herbaceous vegetation, favouring damp meadows, swamps and peat bogs. In particular, populations at low to medium altitudes are closely associated with wet environments. Depending on altitude-latitude, Z. vivipara is active from March-May to September-October and mating occurs after emergence from hibernation. Most of Z. vivipara populations are viviparous, in fact its name derives from the ability to give birth to live offspring; however, in the southern part of the distributional range of the species, oviparous populations occur.
The study area
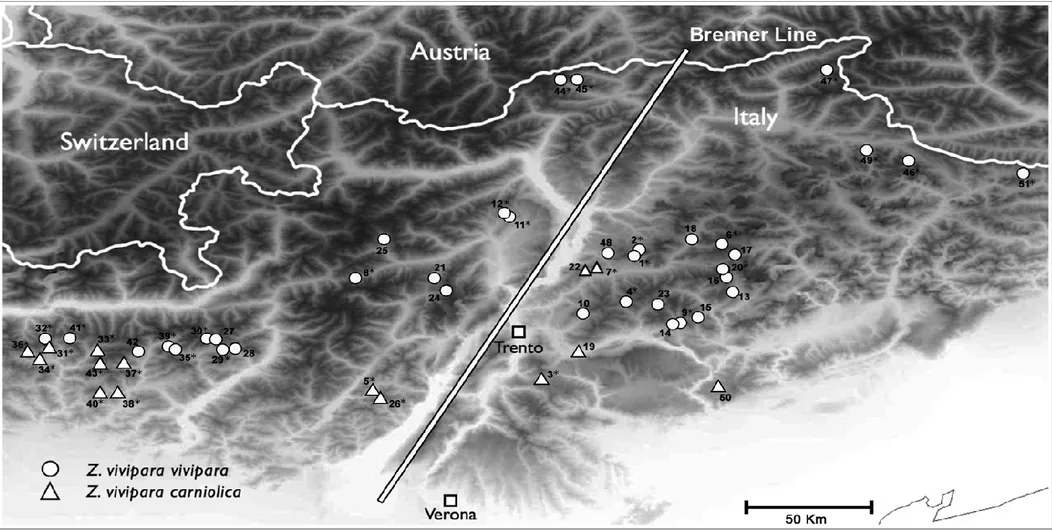
This thesis is focused on the central-eastern part of Alpine chain in Italy where B. variegata is present, and Z. v. vivipara and Z. v. carniolica overlap their distributional range. Most of the field work was conducted in the Trentino-Alto Adige region.
In the following map, the representation of the study area and the details about each study are given. The fourth study includes samples obtained from the second study and samples from the whole European distribution of Z. vivipara.
Major aims of each study
In this thesis, I used different types of genetic data and statistical methods for understanding the recent demographic dynamics and the conservation status of two vertebrate species across the Italian Alps.
In the first study, I investigated the genetic variability of the toad B. variegata populations to understand if the genetic pattern showed evidence of low effective size, demographic decline and fragmentation, as predicted by some field surveys.
In the second study, I analyzed mitochondrial and nuclear DNA phylogenies in the common lizard Z. vivipara. I focused on two subspecies (the oviviviparous Z. v. carniolica and the viviparous Z. v. vivipara) adding new molecular data for testing the ESU hypothesis for the endangered Z. v. carniolica subspecies.
In the third study, I analyzed a rare syntopic area between Z. v. carniolica and Z. v. vivipara that was identified during my field work in the central Alps, focusing on the level of gene flow between ovoviviparous and viviparous populations.
In the fourth study, I applied a Next Generation Sequencing approach (RAD-tag sequencing) for investigating the divergence between Z. v. carniolica and Z. v. vivipara subspecies at the genomic level. I also used Z. vivipara as model organism for studying the evolutionary transition from oviparity to viviparity in squamate reptiles.
Funding of the project
My PhD scolarship was funded by the Autonomous Province of Trento within the ACE-SAP project (Alpine ecosystems in a Changing Environment: biodiversity
Sensitivity and Adaptive Potential; University and Scientific Research Service,
regulation number 23, 12 June 2008, Trento). Work Package 1 (WP1) of ACE-SAP project was concerned with biological conservation and assessing the threat status of a group of species, including vertebrates, invertebrates and plants. Within WP1, I was co-responsible for the analyses of the toad B. variegata and the lizard Z. vivipara. The molecular analyses were performed at ‘Fondazione Edmund Mach’ in S. Michele all’Adige (Trento) in the laboratory of the Department of Biodiversity and Molecular Ecology.
References
Beniston M (2003) Climatic change in mountain regions: a review of possible impacts. Clim. Change, 59, 5-31.
Bragazza L (2008) A climatic threshold triggers the die-off of peat mosses during an extreme heat wave. Glob Change Biol, 14, 2688-2695.
Brunetti M, Lentini G, Maugeri M, Nanni T, Auer I, Böhm R, Schöner W (2009) Climate variability and change in the Greater Alpine Region over the last two centuries based on multi-variable analysis. International Journal of Climatology, 29, 2197-2225.
Cannone N, Diolaiuti G, Guglielmin M, Smiraglia C (2008) Accelerating climate change impacts on alpine glacier forefield ecosystems in the European Alps. Ecology Application, 18, 637-648.
Chemini C, Rizzoli A (2003) Land use change and biodiversity conservation in the Alps, Journal of Mountain Ecology, 7, 1-7.
Dainese M, Kuhn I, Bragaza L (2013) Alien plant species distribution in the European Alps: influence of species’ climatic requirements. Biological Invasion, 10.1007/s10530-013-0540-x
Dino M, Milesi S, Di Cerbo AR (2010) A long term study on Bombina variegata (Anura: Bombinatoridae) in the “Parco dei Colli di Bergamo” (North-western Lombardy). In: Atti VIII Congresso Nazionale S.H.I. (Chieti, 22-26 settembre 2010), p. 225-231.
EEA (2009) Progress towards the European 2010 biodiversity target. EEA Report No 4/2009. European Environment Agency, Copenhagen, Denmark
Eisner T, Lubchenco J, Wilson EO, Wilcove DS, Bean MJ. (1995). Building a scientifically sound policy for protecting endangered species. Science, 268, 1231-1232.
Frankham R, Ballou JD, Briscoe DA (2002) Introduction to Conservation Genetics Cambridge Univ. Press, Cambridge.
Hansen J, Sato M, Ruedy R, Lo K, David WL, Martin ME (2006) Global temperature change. PNAS, 103, 288-293.
Hoban S, Arntzen JW, Bertorelle, Bryja J, Fernandes M, et al. (2013) Conservation Genetic Resources for Effective Species Survival (ConGRESS): Bridging the divide between
conservation research and practice. Journal for Nature Conservation, http://dx.doi.org/10.1016/j.jnc.2013.07.005
Huggel C, Salzmann N, Allen S, Caplan-Auerbach J, Fischer L, Haeberli W, Larsen C, Schneider D, Wessels R (2010) Recent and future warm extreme events and high-mountain slope failures. Philosophical Transactions of the Royal Society A, 368, 2435-2459.
IPCC (2007) Climate Change 2007: The Physical Science Basis. Contribution of Working Group I to the Fourth Assessment Report of the Intergovernmental Panel on Climate Change Cambridge University Press, Cambridge, United Kingdom and New York, NY, USA.
IUCN 2013. The IUCN Red List of Threatened Species. Version 2013.2.
Keiler M, Knight J, Harrison S (2010) Climate change and geomorphological hazards in the eastern European Alps. Philosophical Transactions of the Royal Society A, 368, 2461-2479.
Leonelli G, Pelfini M, Morra di Cella U, Garavaglia V (2011) Climate warming and the recent treeline shift in the European Alps: the role of geomorphological factors in high-altitude sites. Ambio, 40, 264-273.
Meehl GA, Tebaldi C (2004) More intense, more frequent and longer lasting heat waves in the 21st century. Science, 305, 994-997.
Moore PD (2002) The future of cool temperate bogs. Environmental Conservation, 29, 3-20. Neteler M, Metz M, Rocchini D, Rizzoli A, Flacio E, et al. (2013) Is Switzerland Suitable for
the Invasion ofAedes albopictus? PLoS ONE, 8, e82090.
Paul F, Machguth H, Kääb A (2005) On the impact of glacier albedo under conditions of extreme glacier melt: the summer of 2003 in the Alps. EARSeL eProc, 4, 139-149.
Rabatel A, Francou B, Soruco A, Gomez J, Cáceres B, et al. (2013) Current state of glaciers in the tropical Andes: a multi-century perspective on glacier evolution and climate change. The Cryosphere, 7, 81-102.
Rieman BE, Isaak DJ (2010). Climate change, aquatic ecosystems, and fishes in the Rocky Mountain West: implications and alternatives for management, Gen. Tech. Rep. RMRS-GTR-250. USDA Forest Service Rocky Mountain Research Station, Fort Collins, Colo. Rizzoli A, Hauffe HC, Tagliapietra V, Neteler M, Rosà R (2009) Forest Structure and Roe
Deer Abundance Predict Tick-Borne Encephalitis Risk in Italy. PLoS ONE, 4, e4336. Roiz D, Neteler M, Castellani C, Arnoldi D, Rizzoli A (2011) Climatic Factors Driving
Invasion of the Tiger Mosquito (Aedes albopictus) into New Areas of Trentino, Northern Italy. PLoS ONE, 6, e14800.
Tafani M, Cohas A, Bonenfant C, Gaillard JM, Allainé D (2013) Decreasing litter size of marmots over time: a life-history response to climate change? Ecology, 94, 580-586. Tse-ring K, Sharma E, Chettri N, Shrestha A. (2010) Climate change vulnerability of
mountain ecosystems in the Eastern Hima layas; Climate change impact an vulnerability in the Eastern Himalayas – synthesis report. ICIMOD, Kathmandu.
Vanham D, Fleischhacker E, Rauch W (2009) Impact of snowmaking on alpine water resources management under present and climate change conditions. Water Science and Technology, 59, 1793-1801.
First study: Small effective population size and fragmentation in Alpine populations of Bombina variegata: the combined effects of recent bottlenecks and postglacial recolonization
Luca Cornetti, Andrea Benazzo, Heidi C. Hauffe, Cristiano Vernesi, Giorgio
Bertorelle
To be submitted to Molecular Ecology
Abstract
Amphibians are experiencing population declines in all continents caused by anthropogenic and natural factors. Evidences of reduction in population size and even local extinctions have been reported for Bombina variegata along all its distributional range. In this study, we examined 200 samples of B. variegata from Northern Italy and genetic variation within 9 populations using mtDNA cytochrome b and 11 nuclear microsatellites. We investigated fine-scale population structure and tested for genetic traces of population decline using different methods. We estimated that analyzed populations showed low level of genetic diversity in comparison with other studies. Moreover, low estimates of effective population size were found for all populations. The demographic analyses support a scenario with population decline due to postglacial recolonization, but also suggest that recent anthropogenic modifications and climate changes likely shaped genetic variability of the species in this area and contributed to reduction in effective population size.
Introduction
Amphibians are among the most threatened vertebrates. Many species from all continents are experiencing a demographic decline (Stuart et al. 2004), likely due to anthropogenic pressure and climate change (Allentoft & O’Brien 2010). Human activities, in fact, have an important impact for example on land use, leading to habitat loss and fragmentation, on pollution levels and indirectly on the increase of UV-B irradiation (Weyrauch et al. 2006.). Also, climate change and especially global warming affect the distribution of amphibians, influencing breeding phenology or leading to pathogen outbreaks (Corn 2005, Rohr et al. 2008). Amphibians appear to be particularly sensitive to all these processes, making them good biological indicators of the environmental quality (Blaustein & Wake 1990).
The causes and the consequences of the amphibian decline, and the use of this taxon as a biological indicator, cannot be generalized at a global scale. Many factors interact, and their impact likely differs in different geographic areas and in different species (Beebee & Griffiths 2005, Tafani et al. 2013). Studies at regional scale, where the major factors of habitat disturbance can be identified, the demographic dynamic of a species and its genetic impact can be reconstructed, and the possible association between causes and consequences can be inferred, are therefore very useful and valuable. In this context, the Alpine environment is of particular interest.
The Alpine environment is heavily affected by global change, in term of both climate change and land use (Cannone et al. 2008; Vanham et al. 2009; Keiler et al. 2010; Huggel et al. 2010). In particular, temperatures in the European Alps increased in the last century twice as much as the global average increase (Brunetti et al. 2009). In this area, the effects of climate warming, such a as the upwards shift of the tree-line (Leonelli et al. 2011), or the change in population genetic structure, have been already demonstrated or predicted in many plants species (Jay et al. 2012; Moradi et al. 2012). However, few examples exist in animals (but see for example the decreasing litter size in the marmot, Tafani et al. 2013), especially in terms of genetic patterns. Here we analyzed the genetic variation pattern in an amphibian species, Bombina variegata, sampled at different sites in an Alpine Italian region. The main objective of our study is to estimate the genetic impact, if any, of the demographic decline occurred in this species in the recent past.
The yellow-bellied toad, Bombina variegata, is mainly distributed across central western Europe, from Spain to the Carpathian Mountains, where it forms a stable hybrid zone with the sister species, B. bombina (Fijarczyk et al. 2011). Breeding sites are usually ephemeral, and include small puddles in meadows and river loops and occasionally farm ponds or water-filled wheel ruts (Gollnmann et al. 1999; Cabela et al. 2001; Di Cerbo & Ferri, 2001). Although the species is globally considered of Least Concern by the IUCN (IUCN, 2013), extinctions or demographic reductions have been reported in the last decades across the distributional range. In particular, severe declines are documented in Romania, the Netherlands, and Italy (Covaciu et al. 2010; Goverse et al. 2007; Barbieri et al. 2004). Only one population is now described in Luxembourg, and the species is probably extinct in Belgium and highly fragmented in France (Kuzmin et al. 2009). Urbanization and consequent loss of suitable habitat (e.g. abandonment of pastures, heavy use of unpaved forestry roads and drainage of natural breeding sites) are considered as the major factors reducing the population sizes and increasing the fragmentation in this species. As in many other amphibians in natural conditions, B. variegata has small effective population size (Funk et al. 1999; Beebee & Griffiths 2005) and low dispersal ability (Blaustein et al. 1994; Kraaijeveld et al. 2005), making the genetic and non genetic risks associated to small numbers of highly isolated individuals even higher.
In Italy, B. variegata was common in the last century (De Betta 1857; Giacomelli 1887; Vandoni 1914), but it is significantly declining in many areas (Stagni et al. 2004). Anthropization of natural habitats, pollution and use of pesticides lead to a regular decline in the last decades (Barbieri et al. 2004), fragmentation and local extinction events (Di Cerbo & Ferri 2000). In a recent study, it has been estimated using simulations under various models of climate change, environmental alteration and solar irradiation, that the yellow-bellied toad in Italy will lose between 13 and 75% of its suitable natural habitat in the next 50 years (D’Amen et al. 2011).
Here we study the pattern of genetic variation at the mitochondrial cytochrome b gene and at 11 microsatellite markers in a restricted area in the Italian Alps, where local extinctions and population declines have been previously documented (Caldonazzi et al. 2002). We typed 200 individuals from 9 different populations to address the following two main questions: 1) Is the genetic pattern showing evidence of low effective population size, demographic decline and/or fragmentation? 2) Can we directly infer that recent human-related factors are responsible for the genetic
pattern? We will address these questions using a set of statistical methods suitable to estimate effective population sizes, times of population size changes, population structure, individual genomic compositions and isolation by distance, and to probabilistically compare alternative demographic models. We believe that our results have important implications for evaluating the conservation status in this species and developing conservation plans, and in general for the understanding of the genetic effects of recent and ancient demographic declines.
Materials and Methods
Samples collection and DNA extraction
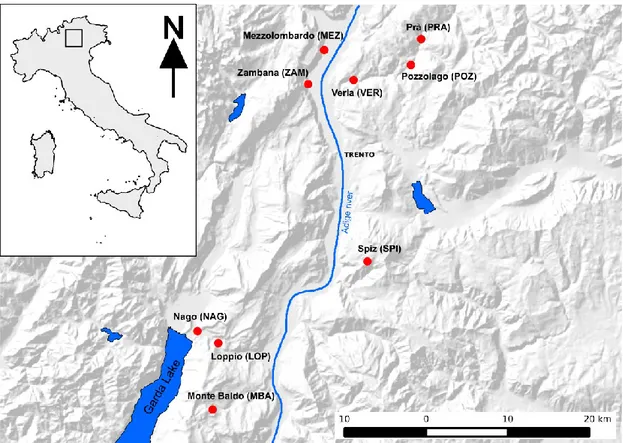
Two hundred samples of B. variegata were collected from nine different localities in the Province of Trento (Northern Italy) from 2009 to 2011. Sampling sites and their abbreviation used throughout this paper are reported in Figure 1. Different ecosystems were sampled: samples from Spiz (SPI) and Monte Baldo (MBA) came from isolated mountain areas (about 1500 m asl); samples from Zambana (ZAM) and Mezzolombardo (MEZ) were collected in the main valley of the Region (the Adige valley), close to areas devoted to agriculture (about 210 m asl); samples from Nago (NAG) and Loppio (LOP) came from sites close the touristic area of Garda Lake (160 and 250 m asl, respectively); samples from Verla (VER), Pozzolago (POZ) and Prà (PRA) were collected from scarcely urbanized areas along the Avisio river (from 450 to 620 m asl), and in particular from agricultural ponds (VER) and river loops (POZ and PRA). Individual GPS coordinates of each sample were recorded. Toe clips were obtained and stored in 95% ethanol; about 20 mg of tissue were used to perform DNA extraction using the protocol of the DNeasy Tissue kit (QIAGEN Inc, Hilden, Germany). All sampling procedures were approved by the Italian Ministry of Environment and Wildlife Committee of the Autonomous Province of Trento (DPN/2D/2003/2267 and 4940-57/B-09-U265-LS-fd).
Figure 1.1 Map of the nine sampling sites (indicated by red dots) in the Alpine region of Trentino Alto-Adige.
Genetic typing
We initially sequenced a fragment of the mitochondrial DNA (mtDNA) cytochrome b gene to verify the haplotypic affiliation of the samples, with respect to the known maternal phylogeographic pattern in Europe. We used the primer pairs L14850 and H 15410 according to Tanaka et al. (1994). PCR amplifications were conducted in 20 ul (containing 1ul of template DNA 2 ul of buffer, 1 ul of each pair of primers, 1 unit of Hot Master Taq polymerase and ultra pure water) under the following conditions: 10 minutes at 94°C, 35 cycles of 30 seconds at 94°C, 45 sec at 52°C, 60 sec at 65°C, and a final extension step for 10 min at 65°C. Sequences were edited using Finch TV 1.4.0 (an open source application developed by Geospiza Research Team), assembled with Sequencer v.4.7 and aligned using ClustalX (Thompson et al. 1997) using default parameters.
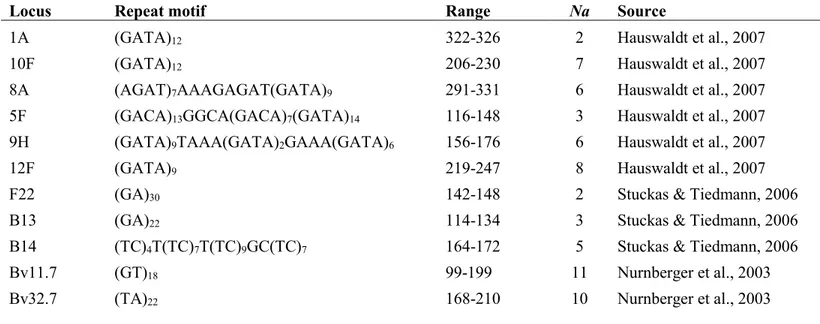
The genetic variation level and structure at the micro-geographic scale was then investigated typing 11 autosomal microsatellites. Nine of them were originally developed for the sister species B. bombina (Nurnberger et al. 2003; Hauswaldt et al. 2007; Stuckas & Tiedemann 2006). PCR amplifications were conducted in four
different multiplex reactions in a final volume of 20 ul containing: 1ul of template DNA, 2 ul of buffer, 0,5 ul of each pair of primers, 1 unit of Hot Master Taq polymerase (Applied) and ultra-pure water. The amplification protocol consisted of an initial denaturation step at 94°C for 10 minutes, followed by 30 cycles of the series: 94°C for 30 seconds, annealing temperature (Ta: 53°C for Bv11 and Bv32; Ta: 56°C for 1A, 10F and F22; Ta: 45°C for B13 and 8A; Ta: 52°C for 5F, 9H, 12F and B14) for 30 seconds, 65°C for 45 seconds; then, a final extension step at 65°C for 10 minutes. PCR labeled products were run on a four capillary system ABI 3130 Genetic Analyzer (Applied Biosystem) and scored with an internal lane standard (LIZ) using GeneMapper software.
Statistical analysis
Mitochondrial DNA
A phylogenetic tree was built using the maximum-likelihood algorithm implemented in MEGA5 (Tamura et al. 2011), using the Kimura two-parameter model (selected as the best model by JModelTest (Posada 2008)) and 1000 bootstrap replicates. This analysis included the haplotypes from our study, the sequences available in Genbank for B. variegata (EF212448-EF212809), and two sequences used as outgroups from B. bombina and B. orientalis (JF898352, EU531278).
Microsatellites
Microsatellites were tested for the presence of null alleles, allele drop-out and scoring errors using MicroChecker (Van Oosterhout et al. 2004). We used GENEPOP 3.4 (Raymond & Rousset 1995) to test for deviations from Hardy–Weinberg equilibrium for each locus and globally. We also tested genotypic Linkage Disequilibrium (LD) for each pair of loci. To evaluate overall genetic variation, expected and observed heterozigosity (He and Ho) and number of alleles (Na) within each population were
calculated using Arlequin v3.5 (Excoffier & Lischer 2010); FSTAT software (Goudet 1995) was used to calculate allelic richness (Ar). In addition, pairwise Fst values
between populations were computed with Arlequin v3.5 and the corresponding triangular matrix of distances was visualized using Principal Coordinates analysis (PCoA) implemented in GenAlex v6.5 (Peakall & Smouse 2012).
Bayesian clustering analyses
STRUCTURE v2.3.4 (Pritchard et al. 2000; Hubisz et al. 2009) was used to detect the most plausible number K of genetically homogeneous groups and to estimate the genetic composition of each individual. We applied the LOCPRIOR with admixture model, which assumes that sampling locations are informative and allows for mixed ancestry of individuals. This model is more powerful in detecting weak genetic structure and reduces misassignments (Hubisz et al. 2009). Each run of STRUCTURE consisted of 1000000 iterations after a burn-in period of 250000, and 10 runs were analysed for all K values between 1 and 9. The most probable K was selected comparing the likelihood at different K values and using the approach of Evanno et al. (2005) based on the rate of change of the likelihood.
Genetic vs. geographic distances
The correlation between genetic similarity (or dissimilarity) and geographic distance was evaluated separately at the individual and at the population levels. At the individual level, we estimated with the software SPAGeDi (Hardy & Vekemans 2002) the kinship coefficient derived by Loiselle et al. (1995) for all pairs of individuals. These coefficients were then pooled in classes with similar number of comparisons, corresponding to different geographic distances. At the population level, we analysed the relationship between the linearized Fst based distance (Fst/(1-Fst)) and
the logarithm of the linear geographic distance. The statistical significance of this relationship was evaluated using the Mantel’s test.
Recent effective population size
Two methods were used to estimate the recent effective population size (Ne) of each
population: LDNe (Waples & DO 2008) and ONeSAMP (Tallmon et al. 2004). LDNe is based on the linkage disequilibrium among unlinked loci created by random drift, and the estimated Ne reflects the population size in the last few generations (Hare et
al. 2011). As suggested by the authors (Waples & DO 2008), we excluded the alleles with frequencies smaller than 0.02 to avoid the bias related to rare alleles. ONeSAMP implements an Approximate Bayesian Computation analysis (Beaumont et al. 2002; Bertorelle et al. 2010). Eight summary statistics are used by ONeSAMP to compare observed and simulated data sets, but the inclusion of linkage disequilibrium among these statistics makes this method particularly sensitive to recent population sizes
(Skrbinsek et al. 2012). The lower and upper limits of the uniform prior distribution of Ne were set to 2 and 5000, respectively.
Demographic dynamic
We analysed the demographic dynamic of each population using four different methods: 1) the M-ratio test (Garza & Williamson 2001); 2) the heterozygosity excess test implemented in the software BOTTLENECK 1.2.02 (Piry et al. 1999), 3) a Bayesian analysis based on the coalescent framework and able to estimate the posterior distributions of the parameters of a contraction/expansion demographic model, as implemented in the software MSVAR v1.3 (Beaumont 1999, 2004); 4) a model comparison based on the Approximate Bayesian Computation approach (Beaumont et al. 2002; Bertorelle et al. 2010), as implemented in the software in DIYABC v 1.0.4.46b (Cornuet et al. 2008, 2010). These methods have different statistical properties, which differently depend on the number of markers, the specific feature of the bottleneck (like age, initial population size, intensity, presence or not of recovery) and the possible violations of the model they assume (e.g., migration events among populations). Therefore, no one can be considered better than the others in all conditions (e.g., Swatdipong et al. 2010; Chikhi et al. 2010; Peery et al. 2012; Hoban et al. 2013). We briefly describe here these methods, and we will come back on their properties in the discussion.
The M-ratio test is based on the frequency distribution of allelic sizes, which is expected to have gaps after a bottleneck due to stochastic loss of rare alleles. Statistical significance was established comparing the observed values with the empirical null distribution obtained simulating 10,000 times the genealogy expected under demographic stability with M_P_VAL (Garza & Williamson 2001). Simulations assume the two-phase mutation model, and require three parameters: the population- mutation parameter, θ = 4Ne, the mean size of multi-repeat mutations, g, and the proportion of multistep events, ps. Different values of θ were tested, i.e. 1,
2, and 5 (corresponding to pre-bottleneck Ne of 500, 1000 and 2500 individuals,
respectively, assuming a standard rate x10-4);
g and ps were fixed to 3.1 and
0.22 as estimated in a recent review by Peery et al. (2012).
The heterozygosity excess test is based on the comparison between heterozygosity and number of alleles, which is predicted to deviate from the
expectation after a bottleneck because the former decreases more slowly than the latter. Statistical significance (one tail) is computed using the Wilcoxon’s signed ranked test to compare observed and expected heterozygosities (Cornuet & Luikart 1996), where expected values are computed by simulations assuming again a two phase mutation model, a variance among multiple steps equal to 12 (corresponding to g = 3.1, see Peery et al. 2012) and ps = 0.22.
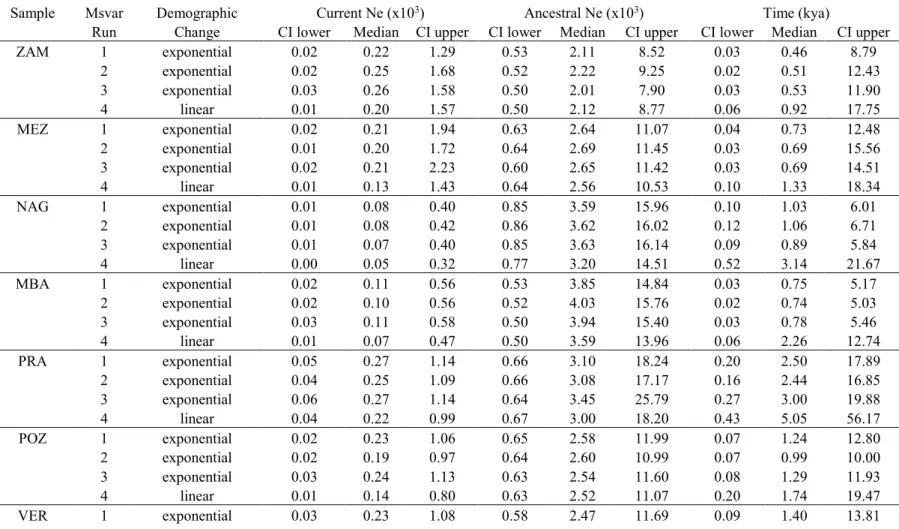
The method implemented in MSVAR assumes that an ancestral population with effective size N1, increased or decreased (linearly or exponentially) to its current size N0, starting T generations ago. The estimation algorithm is based on Markov Chain Monte Carlo simulations, and the simple Single-step Mutation Model (SMM) is assumed. Simulations were run for 4 x 10⁸ iterations; convergence and posterior distributions of the parameters were evaluated with Tracer v1.5 (Rambaut & Drummond 2007), after discarding the first 10% of the chains (burn-in). For each population, three independent runs were performed assuming an exponential demographic change. The possible effect of this choice was tested assuming a linear change in an additional run of the program. Priors means for the ancestral and current population sizes were set equal to a log-10 transformed value of 3 (1000 individuals), with a standard deviation equal to 1. The prior distributions are log-normal, and this setting allows the testing of population sizes from few tens to hundred of thousand of individuals. Three different prior distributions of the time since the demographic change were tested, with means equal to 2, 3, and 4, respectively (corresponding to 100, 1000, and 10000 years) and standard deviations equal to 1. All the other prior settings in the hierarchical model implemented in MSVAR are reported in Table S1.1 and follow standard choices used in other studies (e.g., Storz et al. 2002). Time estimates are transformed in years assuming a generation time of 3 years (Szymura 1998; Gollmann & Gollman 2002).
Finally, the demographic dynamic was also analysed comparing three alternative scenarios with the ABC (Approximate Bayesian Computation) approach as implemented in DIYABC (Cornuet et al. 2010): constant effective population size, ancient bottleneck, recent bottleneck. The models assuming ancient or recent reductions were simulated to mimic the demographic effects possibly related to the post-glacial founding of the Alps populations and the human-mediated processes affecting amphibians in the last century, respectively. Hereafter, we call these models
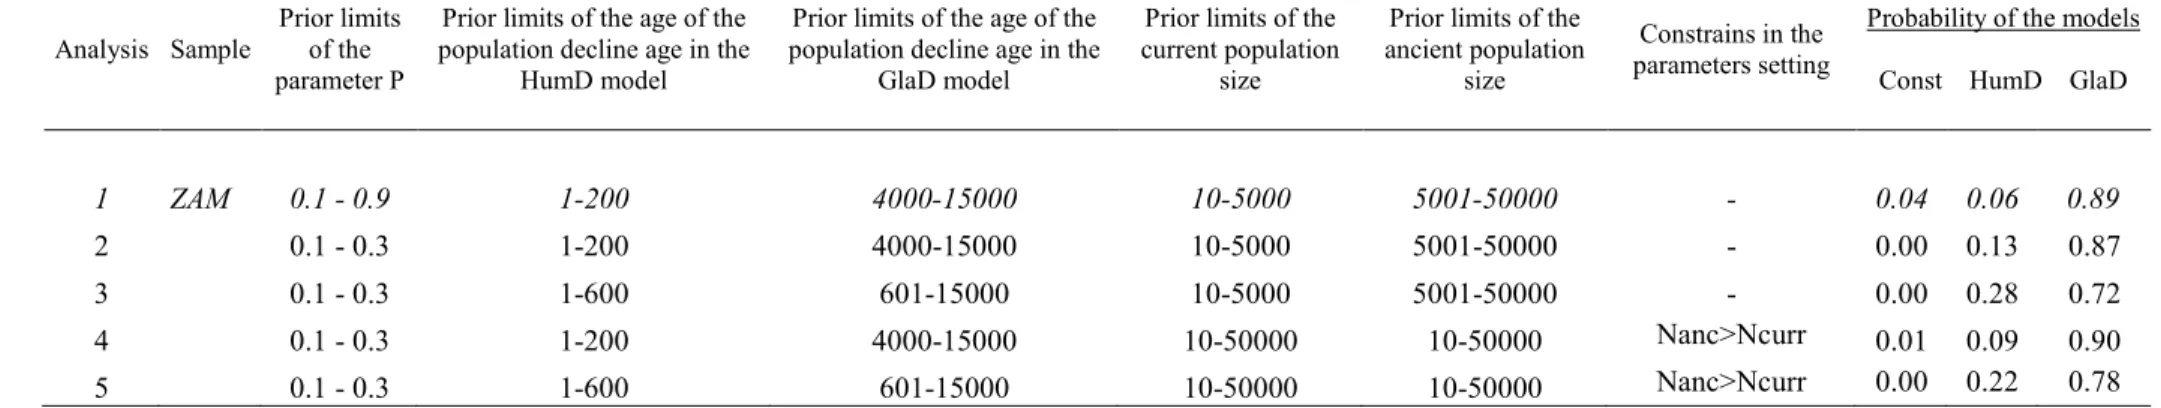
Const (constant population size), GlaD (post-glacial decline) and HumD (human-related decline). Different settings and prior distributions were tested to check the robustness of the results (Table S1.2).
Results
Mitochondrial sequences
Three polymorphic sites, and an average pairwise divergence of 0,043% among individuals, were found in the 420 bp alignment of the cytb gene. Four different haplotypes were detected, three of which had never been observed before in this species. The ML phylogenetic tree (Figure S1.1) indicates that the samples we analyzed belong to the previously described “Balkano-Western” clade of the nominal form, Bombina variegata variegata (Hoffman et al. 2007).
Microsatellite markers
All the 200 samples from 9 populations were successfully genotyped at all the 11 amplified loci. MicroChecker results did not suggest any significant presence of null alleles, scoring errors or allelic drop-out. Systematic deviation form Hardy-Weinberg and linkage equilibrium can be excluded: only 5 out of 99 (11 loci x 9 populations) Hardy-Weinberg tests were significant with P<0.05, and only 2 out of 55 locus pairs showed significant genotypic linkage with P<0.05. All loci were polymorphic and the number of alleles per locus ranged from 2 for F22 to 11 for Bv32 (Table S1.3). Genetic variation is relatively low in all populations. Heterozygosity values are around 0.50, with very low values in in SPI (He = 0.41) and NAG (He = 0.34). The
allelic richness per locus is between 3 and 4 for most populations, again with SPI and NAG showing the lowest values (2.5 and 2.4, respectively).
Population Label N Na Ar Ho He Ne (LDNe) Ne (OneSamp) Zambana ZAM 29 4.2 3.7 0.58 0.54 51.9 (23.9-552.1) 26.17 (20.32-49.93) Mezzolombardo MEZ 10 3.4 3.4 0.52 0.49 31.1 (6.9-inf) 12.24 (9.41-19.44) Nago NAG 23 2.5 2.4 0.36 0.34 6.5 (2.0-25.7) 17.85 (13.45-29.99) Monte Baldo MBA 25 3.5 3.2 0.47 0.51 61.5 (22.7-inf) 23.15 (17.12-39.64) Prà PRA 17 3.6 3.2 0.49 0.48 10.0 (3.2-32.3) 17.58(14.07-27.75) Pozzolago POZ 25 4.0 3.5 0.53 0.51 55.7 (17.1-inf) 25.47 (19.69-41.21) Verla VER 24 3.9 3.3 0.54 0.48 50.8 (17.4-inf) 19.10 (15.29-27.59) Loppio LOP 32 3.6 3.1 0.50 0.50 166.6 (29.1-inf) 26.62 (20.55-41.09) Spiz SPI 15 2.5 2.5 0.42 0.41 65.8 (12.7-inf) 13.08 (10.86-18.59)
Mean 3.5 3.1 0.49 0.47
Table 1.1. Genetic diversity and effective population size estimates of 9 populations of B. variegata. Sampling localities, including the corresponding acronym, number of samples collected (N), number of alleles (Na), allelic richness (Ar), observed (Ho) and expected (He) heterozygosity, and estimates of
effective population size by linkage-disequilibrium method (Ne (LDNe)) and by Bayesian method (Ne
(OneSamp)). Intervals in brackets are 95% confidence intervals (LDNe) and 95% credible limits for the posterior distribution (OneSamp).
Population differentiation
Significant genetic differentiation (after following the Benjamini & Hochberg (1995) approach for multiple testing) was found in 34 out 36 pairwise Fst comparisons. The
only exceptions are the comparisons between two pairs of geographically adjacent populations (ZAM vs. MEZ and PRA vs. POZ). Fst values (see Table S1.4) ranged
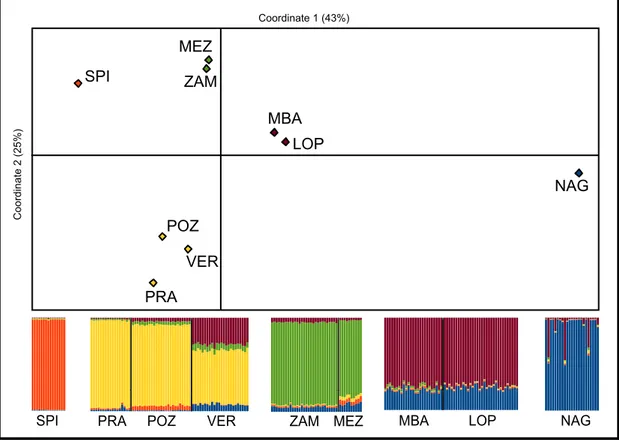
between 5% and 15% in most cases, with higher values (up to 32%) when the NAG site was involved. The matrix of distances is graphically visualized in Figure 1.2 using the Principal Coordinate Analysis (PCoA).
Bayesian clustering analyses
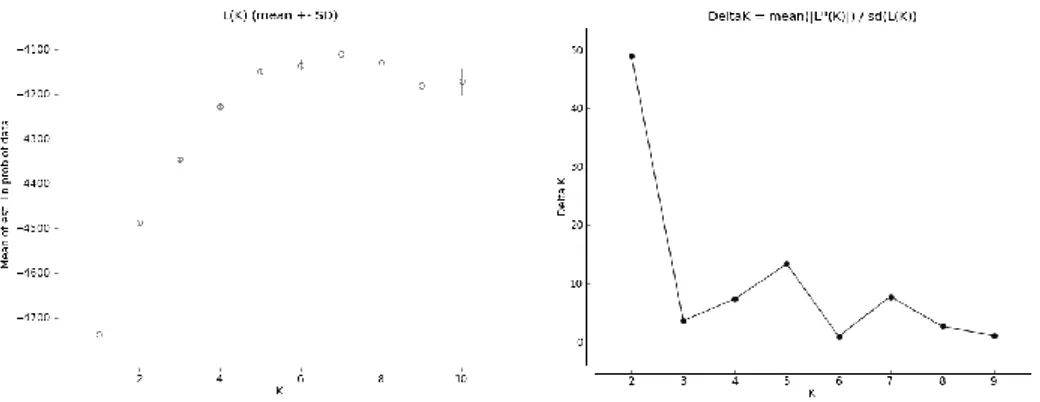
The inspection of the likelihood plot for different K values (Figure S1.2a), and the plot based on the rate of change of the likelihoods (Figure S1.2b), clearly suggests that the most relevant partition of the data are those with 2 and with 5 inferred groups. We present therefore these results.
For K=2, the inferred groups are predominant in central/northern and southern locations (Figure S1.3), respectively. All the individuals in 4 populations can be entirely or almost entirely assigned to the central/northern (PRA, POZ and SPI) or the
southern (NAG) groups. Individuals in the other 5 populations show admixed composition with very similar fractions of the two inferred groups within the same locality, suggesting shared ancestry rather than recent admixture (e.g., Jarvis et al. 2012)
For K=5, the groups inferred by STRUCTURE roughly correspond to the groups graphically identified by the PCoA analysis (Figure 1.2). In the southern area, NAG is genetically distinct form MBA and LOP, but with a clear portion of shared ancestry with these neighboring localities. Some individuals in NAG also appears as recent hybrids, with ancestors both in NAG and in MBA or LOP. In the central/northern group, PRA and SPI are well differentiated, POZ is very similar to the adjacent PRA, and all VER individuals have a majority of their genetic composition shared with the adjacent PRA and POZ, but also a similar and relatively large affinity with the southern localities of MBA and LOP.
Genetic vs. geographic distances
The relationship between linearized Fst and the logarithm of geographic distance is
positive, weak (R2 = 0,07, Figure S4), and statistically significant (Mantel test, P= 0.04). Estimated kinship coefficients are relatively high (as among first cousins) only when individuals from localities separated by 5 kilometers or less are compared, and very low otherwise (Figure S1.5).
Figure 1.2. Principal Coordinate Analysis of pairwise Fst distances among populations and plots of proportion of ancestry of each sampled individual for five genetic clusters inferred using STRUCTURE.
Recent effective population sizes
Point estimates of recent effective population sizes are low or very low (Table 1.1). The maximum value is around 170 individuals for the Loppio population using the LDNe method, but for the same population the estimated size is less than 30 when the OneSamp method is applied. All the other values range approximately between 10 and 50, with LDNe producing in most cases larger estimates than OneSamp. The confidence intervals have large upper limits in most LDNe estimates, but the posterior distributions of Ne produced by OneSamp have very small probabilities for Ne>50.
Demographic dynamic
All the populations have M-ratio values (see Table 1.2) below the 0.68 threshold usually taken as evidence for a bottleneck (Garza & Williamson 2001). When M-ratios are formally tested controlling for false positives (Benjamini & Hochberg 1995), significant support of the bottleneck (P<0.05) is found in all populations, the only exception being ZAM and MEZ when the largest values of θ = 5 is assumed. The
SPI PRA POZ VER ZAM MEZ MBA LOP NAG
ZAM MEZ SPI POZ VER PRA NAG MBA LOP Coordinate 1 (43%) C o o rd in a te 2 ( 25 % )
heterozygosity excess test indicates that heterozygosities are higher than predicted from the number of alleles, as expected after a bottleneck, but this difference is significant only for SPI.
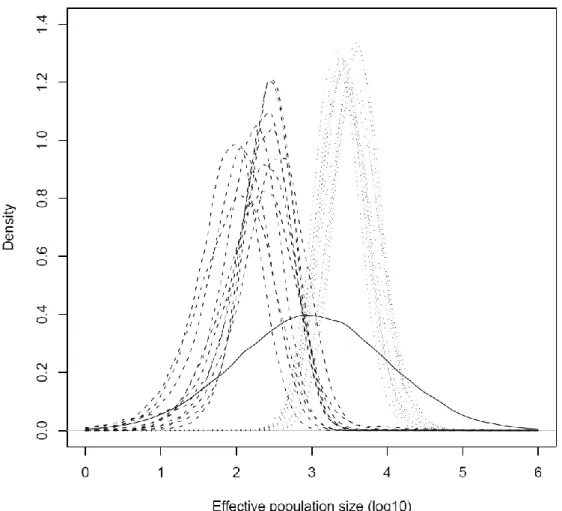
The posterior distributions of ancestral and current population sizes, as estimated by MSVAR, are shifted from their equal prior distributions, clearly suggesting a demographic decline in all populations (Figure 1.3). The distributions in different populations are largely overlapped, but considering the point estimates we note that the ratio between ancestral and current median sizes varies approximately between 7 and 70. NAG, MBA, LOP, and SPI show the most extreme reduction (>25 fold), and a less extreme decline is estimated for the other populations (<15 fold). Ancient sizes distributions have peaks at around 2000-4000 individuals, and current sizes estimates vary between 70 to 300 animals in different populations. The most supported age of the decline varies in different populations between 500 and 3000 years BP (see Figure 4a). Given the evident overlap between prior and posterior distributions, we checked the influence of the former on the latter. The posterior distributions support a decline age between few hundred and few thousand years also when the prior mean was decreased or increased by a factor of 10 (see Figure 4b and 4c). These general results of MSVAR are consistent across runs, assuming either an exponential or linear decline, and pooling samples from pairs of populations not genetically differentiated (see all the point estimates and 95% credible intervals in Table S5).
Figure 1.3. Posterior distribution of the effective population sizes (in log 10 units) for each population obtained with MSVAR (assuming the exponential demographic change). Dashed lines represent current Ne, while dotted lines represent pre-bottleneck Ne. The solid line is the prior distribution for both current and ancient population sizes.
The ABC analysis confirms that the genetic variation pattern is compatible with a demographic decline (Table 1.2). In particular, the model GlaD (post-glacial decline) obtains in all population a posterior probability at least double than Const (constant size) or HumD (human-related decline). When different prior distributions are tested, these general results are confirmed, though in some specific setting and only for NAG, MBA, LOP and SPI, the posterior probability of HumD becomes similar to the posterior probability of GlaD (Table 1.2 and Figure S1.6).
P value (M-ratio) (p-value) H excess Scenario 1 Scenario 2 Scenario 3 Population Label N ratio
M-θ=1 θ=2 θ=5 Const HumD GlaD
Zambana ZAM 29 0.63 0.010 0.029 0.062 0.052 0.04 0.06 0.89 Mezzolombardo MEZ 10 0.60 0.003 0.011 0.072 0.216 0.06 0.07 0.87 Nago NAG 23 0.48 0.001 0.001 0.001 0.326 0.31 0.07 0.62 Monte Baldo MBA 25 0.51 0.001 0.001 0.001 0.042 0.10 0.13 0.76 Prà PRA 17 0.53 0.001 0.001 0.001 0.080 0.07 0.02 0.90 Pozzolago POZ 25 0.61 0.002 0.003 0.008 0.350 0.07 0.01 0.92 Verla VER 24 0.61 0.001 0.003 0.010 0.382 0.36 0.02 0.62 Loppio LOP 32 0.53 0.001 0.001 0.001 0.042 0.11 0.08 0.81 Spiz SPI 15 0.60 0.005 0.016 0.008 0.002 0.06 0.21 0.73 Table 1.2. Tests of demographic bottleneck. The heterozygosity excess is tested using the Wilcoxon approach implemented in the software BOTTLENECK. Significant P values (=0.05) for the M-ratio and the heterozygosity excess tests, after controlling (separately for each test) for multiple testing, are underlined. The last three columns report the posterior probabilities of three different demographic scenarios tested with the ABC approach. Const = constant population size; HumD = recent, human related, decline; GlaD = ancient decline associated to the post-glacial colonization of the Alps. Prior distributions for all the model parameters are reported in Table S1.2 (in italics). The posterior probabilities of each model in each population are only slightly affected by the choice of prior distributions (see details of all the analyses with different priors in Table S1.2).
Discussion
Phylogeography and genetic diversity
The mitochondrial phylogenetic analysis showed that all samples included in this study fall into Balkan-Western clade (Figure S1.1). The level of variation at this marker was very low, with 89% of the individuals sharing the same mtDNA sequence, and only 4 haplotypes in total. This result is compatible with the hypothesis by Hofman et al. (2007) and Fijarczyk et al. (2011), who suggested that the populations characterized by this clade originated in a Balkan refugium and expanded northwestward after the last glaciation, losing genetic variation during the colonization process. Additional analyses at this marker in the Alpine populations here considered are prevented by the very low level of polymorphism.
The microsatellite markers allowed a more detailed genetic analysis even in a geographically restricted area in the Italian Alps, a biodiversity hot-spot where declines and local extinctions of B. variegata have been previously documented. First of all, the populations of yellow-bellied toad in the Alps show low to moderate level
of genetic variation when compared to other populations of this species or the sister species B. bombina sampled in Northern Europe (where the drift effect associated to the post-glacial colonization is expected to be higher). In particular, when samples sizes are adjusted by resampling, and only overlapping loci are considered, the average number of alleles was about 27% and 40% lower in the Alps than in a B. variegata and B. bombina population in Northern Germany, respectively (Hauswaldt et al. 2007). The number of alleles and the heterozygosities observed in the Italian Alps are similar to the values found in endangered frog or toad species (Wang 2012; Igawa et al. 2013, Morgan et al. 2008; Beauclerc et al. 2010).
When the microsatellite variation pattern was used to estimate the contemporary effective population size, most populations showed values smaller than 50 individuals, and some of them values smaller than 20. These values are lower than those estimated in other ranid species (Wilkinson et al. 2007; Phillipsen et al. 2011), and similar to the estimates obtained in endangered anuran species (Ficetola et al. 2010; Wang 2012).
Considering the environmental modifications predicted in the future, and that small populations showing low genetic variation have reduced capacity to adapt to global changes (Willi et al. 2006), we should take the levels of microsatellite variation within the populations and the estimated contemporary effective population sizes as an early warning of genetic risks and a motivation for implementing specific conservation measures in this species.
Habitat fragmentation
Gene flow, which could counteract the negative consequences of genetic drift and inbreeding, is unlikely to occur in a fragmented landscape and especially in species with reduced movement capabilities such as frogs (e.g., Dolgener et al. 2012; Igawa et al. 2013). This expectation was met in our study: despite the fine geographic scale, a clear evidence of genetic substructure was found, and most populations were genetically differentiated from the others. Five major genetic groups were identified, with two of them corresponding to two single and highly divergent populations, and the others associated to geographically homogenous areas. Genetic data also showed that kinship levels are high only at very short distances, supporting very small local population sizes and previous mark-recapture field studies that indicated travel
distances of single adult individuals rarely exceed 500 meters (Smith & Green 2005 and Hartel 2008).
The population of NAG showed the highest values of Fst against all the other
(from 0.15 to 0.32). In this case, although the population of LOP is very close, gene flow is probably prevented because of habitat discontinuity due to urbanization in the touristic area of Garda Lake. Interestingly, NAG is also the only population where clear signals of recent hybridization with the neighboring populations were found in some individuals. Future investigations should be performed to test the hypothesis of human-mediated translocation events.
All in all, the high level of genetic structure among populations indicates that gene flow is very limited, and rapidly declines as the geographic distance increases. In terms of conservation, this result suggests that, as in other species with limited mobility (Walker et al. 2008), the risk of inbreeding due to low population sizes will be enhanced.
Bottleneck inferences
Are the low contemporary population sizes we estimated related to the population declines recently documented in B. variegata populations in Northern Italy (Caldonazzi et al. 2002)? Here, we applied several statistical methods to address this question. More specifically, we aimed at detecting if the genetic variation data support the bottleneck hypothesis and, if so, for estimating the properties of this decline.
Clear genetic traces of extreme bottleneck events emerged according to all the statistical approaches in most of the populations. Declines from some thousand to few hundred of individuals, or less, were estimated by the full-likelihood Bayesian method MSVAR, and the starting date of the decline estimated by MSVAR and the ABC approach was mostly compatible with a postglacial (model GlaD) rather than a recent human-related (model HumD) decline. However, the four populations showing the most extreme (>25fold) decline, NAG, MBA, LOP, and SPI, also showed an equivalent support for the GlaD and the HumD models under the ABC approach. In addition, MBA, LOP, and SPI were the only populations where a significant or marginally significant support was found by the Wilcoxon test, which is a statistical test that detects the transitory excess of heterozygosity over a very short period of time (Luikart & Cornuet 1998). Considering only these last three populations, we note
that a genetic impact due to recent human-related processes appears likely. In 1956 the Loppio Lake, where we collected samples for LOP population, was totally drained because of construction of a tunnel under the lake, leading to drastic changes of the habitat and dangerous consequences for the species living there. On the other hand, MBA and SPI are the most elevated populations in our study (and also higher than the mean altitudinal distribution of the species), and the negative effects due to global warming are expected to be high at these altitudes. The timing of seasonal activities, including hibernation and breeding, are in fact tightly related to climatic conditions. Blaustein et al. (2001), for example, showed a trend of earlier breeding activity for 9 amphibian species in response to increasing temperature, but the occurrence of late frosts, increased by climate change, can have fatal consequences on spawn especially for early breeding species (Henle et al. 2008). Moreover, the decreasing in depth of winter snow cover (IPPC 2007) may have an impact on amphibian survival during hibernation, making them more vulnerable to cold waves. This pattern, amplified for populations with low Ne, such as MBA and SPI, could have led to population decrease and genetic depletion.
In summary, therefore, we suggest that at least one demographic decline occurred and left a genetic signature in all populations, but it is difficult to safely discriminate whether the bottleneck occurred during the post-glacial colonization of the Alps, in the last century, or in both time intervals. This uncertainty is due to the relatively small number of markers we analyzed, but also to the not well-known statistical properties of some of methods we applied. For example, it is not clear if, in case of two successive bottlenecks, the single decline model implemented in the method MSVAR would identify the earliest, the latest, or would rather estimate a decline age of intermediate age. We can however conclude that current effective sizes are much smaller than in the past, that some demographic process occurring in B. variegata and likely related to the colonization of the Alps reduced the genetic variation, and that, at least in some areas, recent anthropogenic modifications and climate changes are likely to have contributed to the reduction in effective population size.
Finally, we note that the interaction between low genetic variation and effects of climate change has been considered one of the main cause for the outbreak of the fungus Batrachochytrium dendrobatidis, which is driving the worldwide declines and extinctions of amphibians (Allentoft & O’Brien 2010 and references therein).
Infections of this fungus were largely recorded in the endangered Apennine yellow-bellied toad B. pachypus (Canestrelli et al. 2013). In the light of the genetic results obtained here and the predicted effects of climate change, northern Italian populations of B. variegata might be also at risk of chytridiomycosis.
Figure 4. Posterior distributions in different populations (dashed lines) of the time since the change in effective population size estimated by MSVAR assuming the exponential change. Three different means of the prior distribution (solid lines) were tested: a) 100 years (log10 transformed value = 2); b) 1,000 years (log10 transformed value = 3); c) 10,000 years (log10 transformed value = 4).
References
Allentoft ME, O'Brien J (2010) Global amphibian declines, loss of genetic diversity and fitness: a review. Diversity, 2, 47-71.
Barbieri F, Bernini F, Guarino FM, Venchi A (2004) Distribution and status of Bombina variegata in Italy. Italian Journal of Zoology, 1, 83-90.
Beauclerc KB, Johnson B, White BN (2010) Genetic rescue of an inbred captive population of the critically endangered Puerto Rican crested toad (Peltophryne lemur) by mixing lineages. Conservation Genetics, 11, 21-32.
Beaumont MA (1999) Detecting population expansion and decline using microsatellites. Genetics, 153, 2013-2029.
Beaumont MA, Zhang WY, Balding DJ (2002) Approximate Bayesian computation in population genetics. Genetics, 162, 2025-2035.
Beaumont, MA (2004) Msvar 1.3 readme [Documentation file, draft]. Available with the program at http://www.rubic.rdg.ac.uk/~mab/stuff/
Beebee TJC, Griffiths RA (2005) The amphibian decline crisis: a watershed for conservation biology? Biological Conservation, 125, 271-285.
Benjamini Y, Hochberg Y (1995) Controlling the false discovery rate: a practical and powerful approach to multiple testing. Journal of the Royal Statistical Society B, 57, 289-300.
Bertorelle G, Bonazzo A, Mona S (2010) ABC as a flexible framework to estimate demography over space and time: some cons, many pros. Molecular Ecology, 19, 2609-2625.
Blaustein AR, Wake DB. (1990) Declining amphibian populations: a global phenomenon. Trends in Ecology and Evolution, 5, 203-204.
Blaustein, AR, Belden LK, Olson DH, Green DM, Root TL, Kiesecker JM (2001) Amphibian breeding and climate change. Conservation Biology, 15, 1804-1809.
Brunetti M, Lentini G, Maugeri M, Nanni T, Auer I, Böhm R, Schöner W (2009) Climate variability and change in the Greater Alpine Region over the last two centuries based on multi-variable analysis. International Journal of Climatology, 29, 2197-2225.
Caldonazzi M, Pedrini P, Zanghellini S (2002) Atlante degli anfibi e dei rettili della provincia di Trento (Amphibia, Reptilia). 1987-1996 con aggiornamento al 2001. Studi Trentini di Scienze Naturali, Acta Biologica, 77, 1-165.
Canestrelli D, Zampiglia M, Nascetti G (2013) Widespread Occurrence of Batrachochytrium dendrobatidis in Contemporary and Historical Samples of the Endangered Bombina pachypus along the Italian Peninsula. PLoS One, 8, e63349.
Cannone N, Diolaiuti G, Guglielmin M, Smiraglia C (2008) Accelerating climate change impacts on alpine glacier forefield ecosystems in the European Alps. Ecology Application, 18, 637-648.
Corn PS (2005) Climate change and amphibians. Animal Biodiversity and Conservation, 28, 59-67.
Cornuet JM, Luikart G (1996) Description and evaluation of two tests for detecting recent bottlenecks. Genetics, 144, 2001-2014.
Cornuet JM, Ravigné V, Estoup A (2010) Inference on population history and model checking using DNA sequence and microsatellite data with the software DIYABC (v1.0). BMC Bioinformatics, 11, 401.
Cornuet JM, Santos F, Beaumont MA, Robert CP, Marin J-M, Balding DJ, Guillemaud T, Estoup A (2008) Inferring population history with DIYABC: a user-friendly approach to Approximate Bayesian Computation. Bioinformatics, 24, 2713-2719.
Covavciu-Marcov SD, Ferenti S, Dobre F, Ccondure N. (2010) Research upon some Bombina variegata populations (Amphibia) from Jiu Gorge National Park, Romania. Muzeul Olteniei Craiova. Oltenia. Studii şi comunicări. Ştiinţele Naturii, 26, 1.